Identification of BCR related genes based on Weighted gene co-expression network analysis (WGCNA)
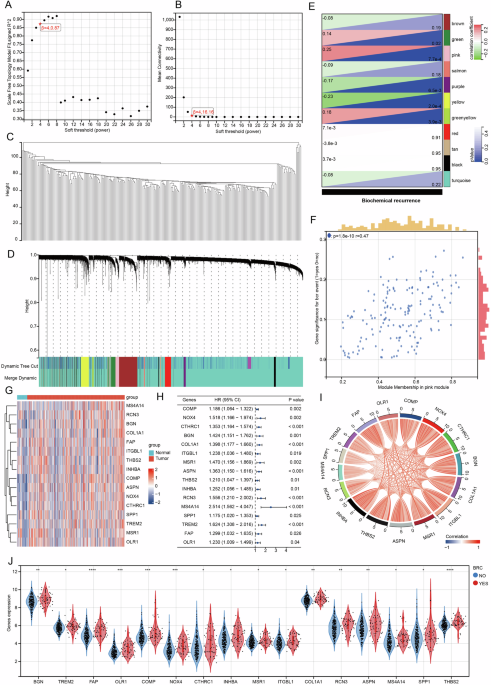
WGCNA is a systems biology method that describes gene association patterns across different samples. This approach can identify gene sets that change collaboratively and pinpoint candidate organisms based on the interconnectivity of these gene sets, as well as their association with phenotypes, marker genes, or therapeutic targets. In this study, we employed the WGCNA method to identify regulatory genes associated with BCR of PRAD, utilizing 248 samples from the GSE116918 data set. Initially, we screened and determined the optimal soft threshold, followed by the clustering analysis of the 248 samples within the GSE116918 data set (Fig. 1A–C). The GSE116918 sample was ultimately categorized into 11 stable modules, with the pink module exhibiting the highest correlation with BCR of PRAD. Furthermore, the genes within the pink module also demonstrated a significant correlation with BCR (Fig. 1D–F). This pink module comprises 162 genes, of which only 16 were found to be highly expressed in PRAD and associated with patient progression-free interval (PFI) (Fig. 1G, H). Notably, these 16 genes exhibited a positive correlation with one another in the TCGA-PRAD dataset (Fig. 1I). Finally, we validated the correlation of these genes with BCR in PRAD patients using the GSE116918 dataset. Our analysis revealed that the expression of these genes was significantly higher in the group with BCR compared to the group of patients without BCR (Fig. 1J).
Fig. 1: Identification of 16 BCR-associated genes based on WGCNA.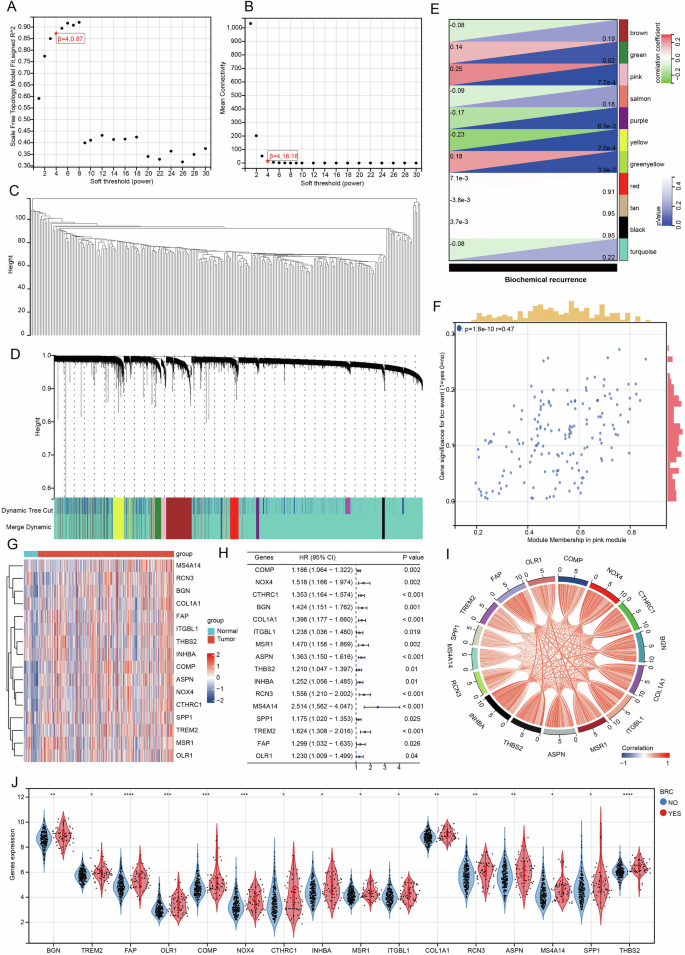
A Plot scale independence. B Plot average connectivity. C Draw sample clusters. D Dividing the GSE116918 sample into 11 modules. E Module-phenotype correlation heat map. F Scatter plot of correlation between gene significance and module membership. G Heatmap of BCR-related gene expression in TCGA-PRAD. H Prognostic forest plot of BCR-related genes in TCGA-PRAD. I Heatmap of correlation of biochemical relapse-related genes in TCGA-PRAD. J Differential expression of BCR-related genes in BCR and non-BCR samples in GSE116918.
Functional analysis of genes associated with BCR
The potential functions of these 16 genes associated with BCR were analyzed using KEGG and GO databases. The KEGG analysis revealed that these genes are significantly linked to several pathways, including ECM-receptor interaction, phagosome formation, focal adhesion, and the PI3K-Akt signaling pathway. Meanwhile, the GO analysis indicated that these genes predominantly contribute to the regulation of B cell differentiation, autophagic cell death, and the regulation of macrophage differentiation (Fig. 2A). Furthermore, we conducted an analysis of these genes using the GSCA database, which indicated that they are associated with the activation of the cell cycle, epithelial-mesenchymal transition (EMT), activation of estrogen receptors, and inhibition of the RTK pathway (Fig. 2B). Subsequently, we analyzed the correlation between these genes and the frequency of copy number variation. Our findings indicated that CTHRC1, ITGBL1, FAP, THBS2, MSR1, and OLR1 exhibited significant changes in copy number variation (CNV) frequency (Fig. 2C). Finally, we examined the expression differences of these genes across various pathological stages within the TCGA-PRAD dataset, revealing that all genes were highly expressed in higher pathological T stages, N stages, and Gleason scores (Fig. 2D–F).
Fig. 2: BCR-related genes play an important role in PRAD.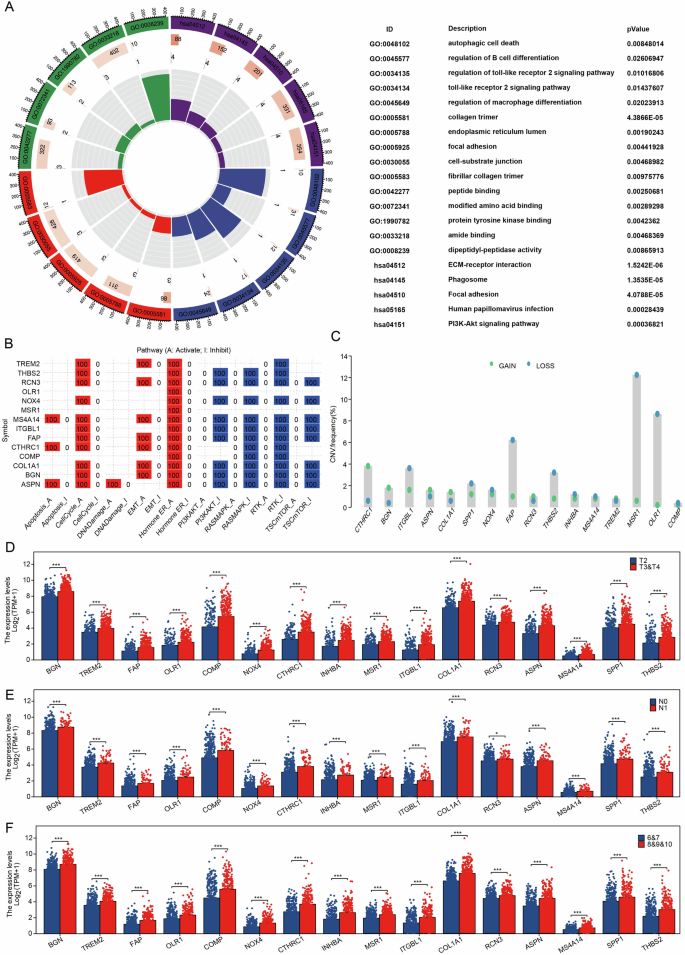
A KEGG and GO analysis of BCR-related genes in PRAD. B GSCA database-based analysis of BCR-associated gene function in PRAD. C Analysis of the correlation between BCR related genes and the frequency of copy number variants. D–F Differential expression of BCR-related genes in different pathological stages of TCGA-PRAD. ***p < 0.001.
Cluster analysis based on BCR-related genes
The TCGA-PRAD samples were clustered using the Negative matrix factorization (NMF) clustering algorithm. To identify the most suitable method for categorizing TCGA-PRAD sample subgroups for our subsequent research, we employed a judgment standard based on co-expression curves, which is currently regarded as the clearest method. The optimal grouping is defined by the vertex corresponding to the largest drop in the co-expression curve. Our study demonstrates that dividing TCGA-PRAD samples into two clusters based on co-expression curves is the most appropriate approach. Additionally, the clustering heat map indicates that color distribution is more concentrated when the samples are divided into two clusters (Fig. 3A, B). When samples were categorized into two groups, individuals in cluster 1 exhibited a significantly better prognosis compared to those in cluster 2 (Fig. 3C). Furthermore, we analyzed the expression of genes associated with BCR across different groups, revealing significant differences in gene expression between the groups (Fig. 3D). Additionally, we incorporated various pathological parameters to compare the distribution of patient numbers across different clusters. Our results consistently demonstrate significant differences in patient counts among the clusters, regardless of the pathological T stage, N stage, or variations in PSA and Gleason scores (Fig. 3E–H).
Fig. 3: BCR-related genes are significantly associated with prognostic and pathologic parameters in PRAD patients.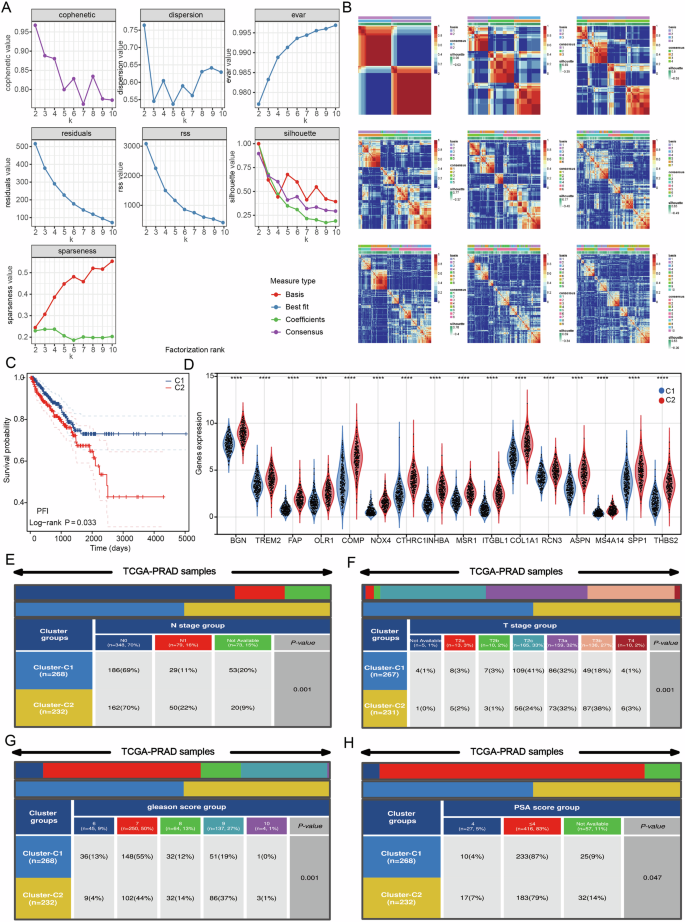
A, B Consensus map of NMF clustering. C Survival differences between clusters. D Differences in the expression of BCR related genes between different clusters. E–H Differences in the distribution of different subgroups in different pathological stages of PRAD. ****p < 0.0001.
Analysis of BCR-related genes and immune infiltration and chemosensitivity in PCa patients
The level of immune cell infiltration in each sample from the TCGA-PRAD dataset was evaluated using the XCELL algorithm. Significant differences (p < 0.005) were observed in the levels of myeloid dendritic cell activation, T cell CD4+ memory, T cell CD4+ effector memory, common lymphoid progenitor, common myeloid progenitor, myeloid dendritic cell, granulocyte-monocyte progenitor, hematopoietic stem cell, macrophage, macrophage M1, monocyte, T cell CD4 + Th1, T cell CD4 + Th2, and regulatory T cells (Tregs) between the two clusters (Fig. 4A, B). A heat map illustrating the levels of immune cell infiltration was also generated (Fig. 4C). Furthermore, we analyzed differences in the IC50 scores of various compounds across the two clusters. Notably, several compounds, including commonly used therapeutic drugs for PCa patients, exhibited significant differences between the clusters, particularly bicalutamide (Fig. 4D). To further investigate the mechanisms underlying these findings, we conducted gene enrichment analysis on the two clusters. Given that patients in cluster 2 have a worse prognosis, we focused our analysis on pathways enriched in this cluster. The results indicated that WNT, PI3K-AKT, NOTCH1, VEGF, EGFR, and immune-related pathways were significantly enriched in cluster 2 (Fig. 4E).
Fig. 4: BCR-related genes are strongly associated with immune infiltration in PRAD.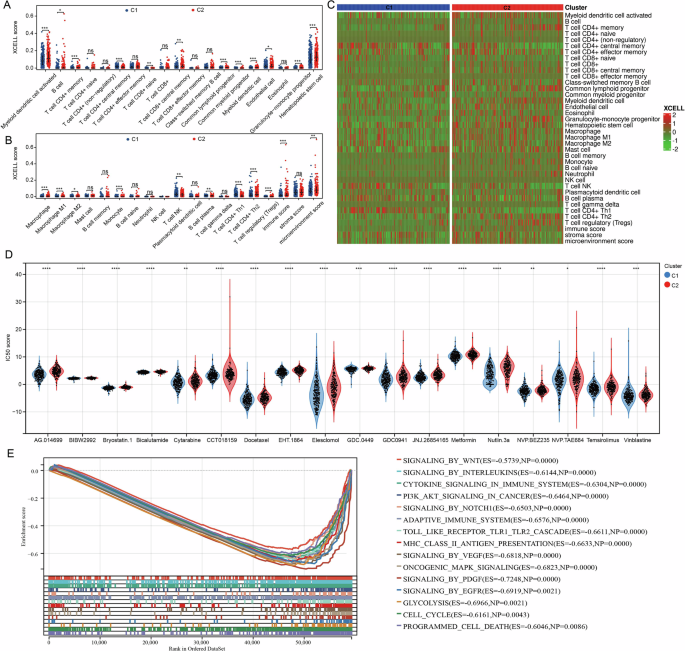
A, B Analysis of BCR-related genes correlating with PRAD immune infiltration. C Heat map of different immune cell infiltration levels. D Analysis of biochemical relapse-related genes and chemotherapy sensitivity in PRAD patients. E Gene enrichment analysis of two clusters. ns på 0.05, *p < 0.05; **p < 0.01; ***p < 0.001; ****p < 0.0001.
Construction of a diagnostic model based on the expression of biologic recurrence-related genes
To thoroughly investigate the role of biologic recurrence-related genes in PRAD, we assessed the predictive capability of these genes for diagnosing PRAD patients using ROC curves. Our analysis revealed that certain genes exhibit significant predictive ability for the diagnosis of PRAD, while COL1A1, INHBA, RCN3, and THBS2 demonstrate limited predictive capacity for PRAD diagnosis (Fig. 5A). Consequently, we endeavored to develop diagnostic models for PRAD based on these genes, utilizing six datasets from PRAD: the TCGA-PRAD dataset for training and GSE32571, GSE62872, GSE16120, GSE14206, and GSE38241 for validation. Among the 108 algorithm combinations tested, the LASSO + LDA algorithm emerged as the most effective for model development. The area under curve (AUC) value for the training set TCGA-PRAD was 0.911, while the AUC values for the validation cohorts GSE32571, GSE62872, GSE16120, GSE14206, and GSE38241 were 0.764, 0.616, 0.824, 0.860, and 0.897, respectively (Fig. 5B). Notably, 13 genes associated with BCR were incorporated into the diagnostic model constructed using the LASSO + LDA algorithm. These genes include ASPN, BGN, COMP, CTHRC1, FAP, INHBA, ITGBL1, MSR1, NOX4, OLR1, RCN3, SPP1, and TREM2 (Fig. 5C).
Fig. 5: The LASSO + LDA algorithm combination is considered to be the best combination for constructing diagnostic models.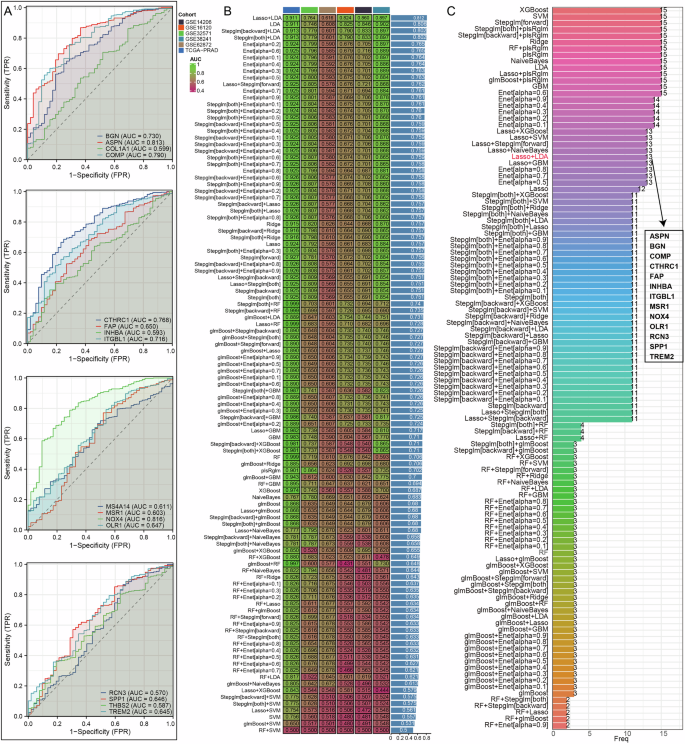
A An examination of how biologic recurrence-related genes predict diagnosis in PCa patients. B AUC values for diagnostic models created using various algorithm combinations. C The count of genes included in diagnostic models that were formed with different algorithm combinations.
Constructing a prognostic model for BCR
To construct a prognostic model related to BCR, we initially collected clinical data from patients with BCR in the TCGA-PRAD dataset. We defined the time node as the number of days prior to the first BCR, with the occurrence of BCR serving as the outcome measure. A total of 70 samples with comprehensive information from TCGA-PRAD were included in the analysis. Additionally, we incorporated data from 248 patients from the GSE116918 dataset into our study. Subsequently, samples from both the GSE116918 and TCGA-PRAD datasets were merged and randomly divided into a training set (50%), a validation set (50%), and a complete dataset using a random seed for randomization. Prognosis-related single genes were screened using univariate Cox analysis with a p-value cutoff of less than 0.05. This study identified a total of six genes: OLR1, COMP, INHBA, COL1A1, RCN3, and ASPN (Fig. 6A). Subsequently, genes were compressed using LASSO and stepwise regression, leading to the construction of a model through multivariate Cox analysis (Fig. 6B). In the entire dataset, our prognostic model demonstrated a robust predictive capability for BCR-related prognosis in patients. Notably, patients categorized in the high-risk group exhibited significantly poorer BCR-free prognosis compared to those in the low-risk group (Fig. 6C, D). Additionally, we presented risk factor plots for COMP and INHBA, which are included in the model, in both the test set and train set (Fig. 6E, F). The results derived from the ROC curves and Kaplan-Meier curves indicated that our BCR-related prognostic model exhibited strong predictive value in both the test set and train set (Fig. 6G–J).
Fig. 6: Constructing BCR-related prognostic models.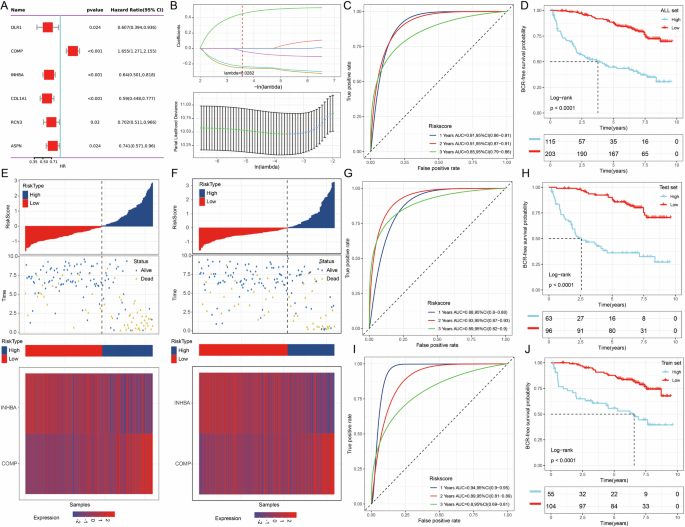
A Screening of prognosis-related genes by univariate Cox analysis. B Genes were screened through lasso/stepwise regression, and a model was constructed using multivariate Cox analysis. C ROC curve analysis of the model’s predictive ability for BCR-related prognosis in the entire dataset. D The Kaplan-Meier survival curves for the high-risk and low-risk groups in the entire dataset. E Risk factor plot of the test dataset. F Risk factor plot of the train dataset. G ROC curve analysis of the model’s predictive ability for BCR-related prognosis in patients within the test dataset. H The Kaplan-Meier survival curves for the high-risk and low-risk groups in the test dataset. I ROC curve analysis of the model’s predictive ability for BCR-related prognosis in patients within the train dataset. J The Kaplan-Meier survival curves for the high-risk and low-risk groups in the train dataset.
Machine learning algorithm identifies key BCR regulatory genes
To further identify the key regulatory genes associated with BCR in PCa, we employed the XGBoost algorithm and interpreted the results through SHAP, using BCR as the outcome variable to analyze the correlation between the genes included in the model and the recurrence. We displayed the top 15 genes associated with BCR in the TCGA-PRAD and GSE116918 datasets (Fig. 7A, B). Subsequently, we analyzed the importance of these genes through Friends analysis (Fig. 7C). Among the genes incorporated into our diagnostic and therapeutic model, COMP and INHBA consistently emerged as pivotal regulatory genes. Based on the results obtained from the combination of the XGBoost algorithm and Friends analysis, we found that the importance of COMP and its correlation with BCR were both higher than those of INHBA. Therefore, we selected COMP as the key gene for subsequent analysis. We divided the samples in the TCGA-PRAD dataset into two groups based on the median expression level of COMP: samples with expression levels above the median were designated as the COMP high-expression group, while those with expression levels below the median were designated as the COMP low-expression group. Our findings confirm a significant relationship between COMP expression and the level of immune cell infiltration (Fig. 7D, E). To further investigate the binding affinity of COMP with commonly used clinical drugs for PCa, we conducted molecular docking analysis. The three selected PRAD-related drugs demonstrated strong binding capabilities with COMP (Fig. 7F). We also performed gene enrichment analysis on COMP, revealing its significant association with immunotherapy pathways in tumors (Fig. 7G, H). The results of the TIDE algorithm indicated that patients with high COMP expression had poorer responses to immunotherapy (Fig. 7I).
Fig. 7: COMP is identified as a key regulatory gene for BCR.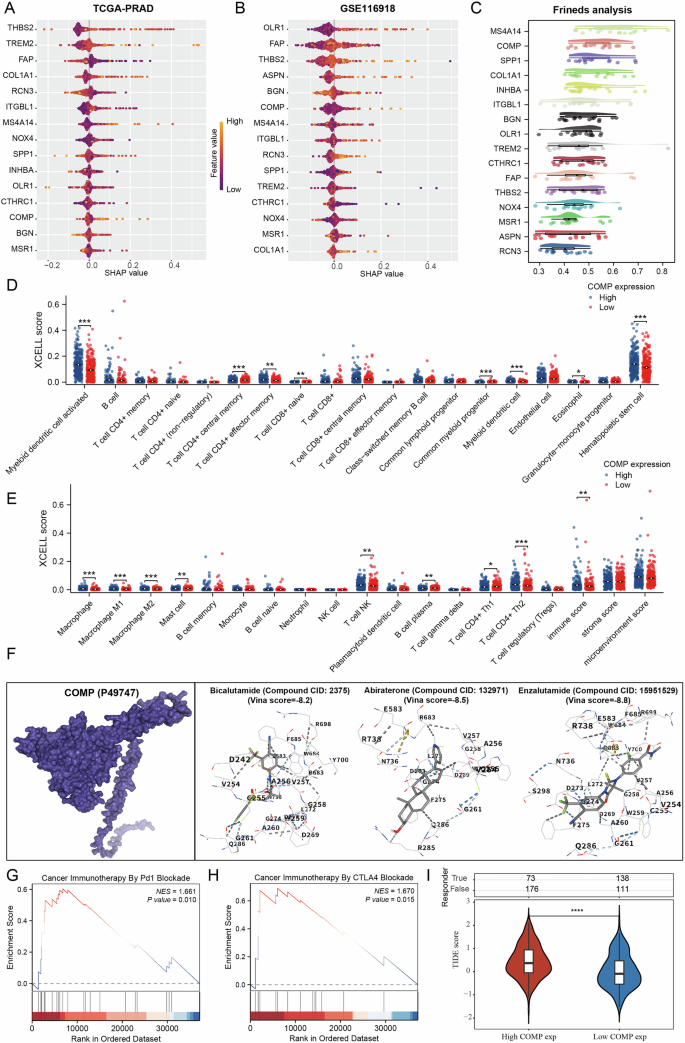
A, B Xgboost algorithm identifies key regulatory genes for BCR. C Friend analysis of dominant genes in BCR-regulated genes. D, E Correlation analysis of COMP with the level of immune cell infiltration. F Molecular docking of COMP with drugs. G, H Functional analysis of COMP in PRAD. I Correlation Analysis Between COMP and Immunotherapy. *p < 0.05; **p < 0.01; ***p < 0.001.
The expression analysis of COMP in PRAD
Our study highlights the critical role of COMP as a gene associated with BCR in PCa. We collected a total of 60 PRAD samples along with their corresponding normal prostate tissue samples. To investigate the differences in COMP expression and its relationship with recurrence and diagnosis in PRAD patients, we employed immunohistochemical staining techniques. Our results indicate that COMP expression is significantly higher in PRAD tissues compared to normal prostate tissues, with even more pronounced expression in recurrent samples than in non-recurrent samples (Fig. 8A–I). Furthermore, we utilized violin plots to visually illustrate the differences in COMP expression between PRAD and normal tissues (Fig. 8J). We evaluated the predictive potential of COMP for diagnosing PRAD patients through ROC curve analysis, which indicated that COMP possesses significant predictive value for this diagnosis (Fig. 8K). Finally, we analyzed the expression differences of COMP in recurrent versus non-recurrent samples, confirming that COMP is expressed at higher levels in recurrent samples and exhibits strong predictive ability for recurrence in PRAD patients (Fig. 8L, M).
Fig. 8: COMP is highly expressed in PRAD.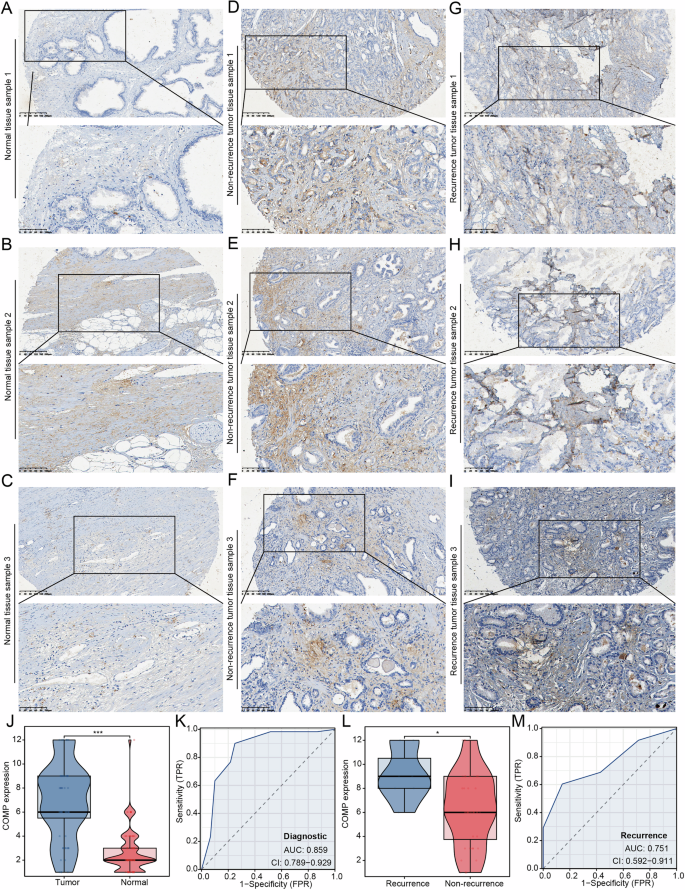
A–C The expression of COMP in normal prostate tissue. D–F Expression of COMP in non-recurrence PRAD tissues. G–I Expression of COMP in recurrence PRAD tissues. J Differences in COMP expression between normal prostate tissue and PRAD. K The predictive value of COMP in the diagnosis of PRAD patients. L The expression difference of COMP in recurrence and non-recurrence PRAD samples. M The predictive value of COMP for recurrence in PRAD patients. *p < 0.05; ***p < 0.001.
Inhibiting COMP expression can suppress tumor progression
We first confirmed the knockdown efficiency of COMP siRNA in PCa cells using qRT-PCR (Fig. 9A). Our results demonstrated that COMP knockdown significantly impaired PCa cell proliferation (Fig. 9B, C). Furthermore, Transwell assays revealed that COMP knockdown markedly inhibited the migration and invasion capabilities of PCa cells (Fig. 9D, E). To investigate the in vivo role of COMP in tumor proliferation and metastasis, we established subcutaneous xenograft and lung metastasis models using male BALB/c nude mice (Fig. 9F). COMP knockdown significantly inhibited prostate tumor growth, evidenced by a marked reduction in both tumor volume and weight compared to controls (Fig. 9G–J). Immunohistochemical analysis indicated that COMP knockdown resulted in a notable decrease in Ki67 staining within tumors (Fig. 9K, L). Subsequently, we established a tail vein lung metastasis model and quantified metastatic burden using in vivo imaging. COMP knockdown effectively suppressed lung metastasis of prostate tumors, with nude mice exhibiting reduced lung fluorescent signals compared to the control group (Fig. 9M, N).
Fig. 9: Knockdown of COMP can inhibit the proliferation and metastasis of PCa.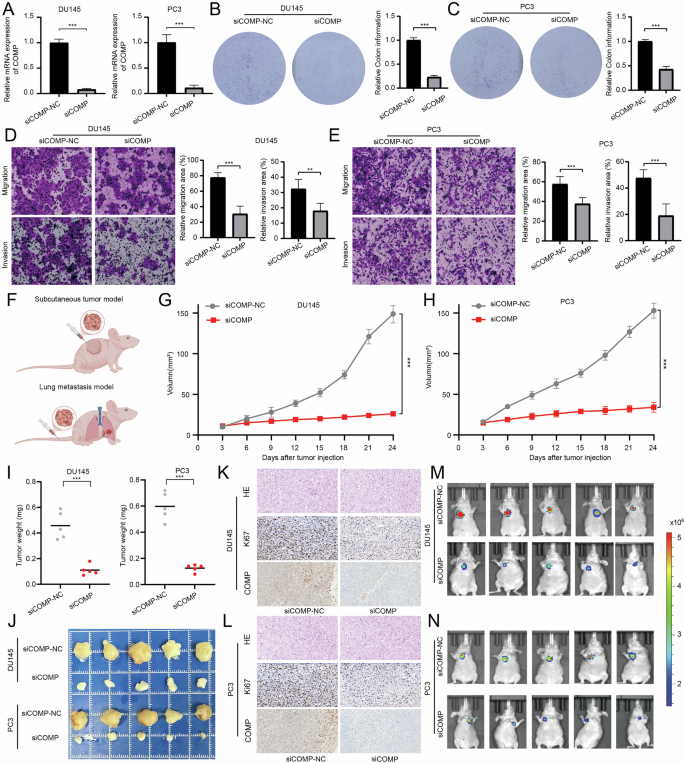
A Verification of COMP knockdown efficiency in PCa cells. B, C Colony formation assay used to evaluate the effect of COMP on PCa cell proliferation. D, E Transwell assays to assess the effect of COMP on the metastatic ability of PCa cells. F Tumor modeling in male BALB/c nude mice. G, H Subcutaneous tumor volume change curve. I Final subcutaneous tumor weight. J Final subcutaneous tumor size. K, L IHC staining images of COMP and Ki-67 in subcutaneous tumors. M, N Measurement of lung metastasis luciferase activity via in vivo imaging system. **p < 0.01; ***p < 0.001.

