
Of the 125 participants who began the survey (provided demographic information), 103 completed the survey and provided information about their clinical experience with RBDs (27.8% response rate). The following results are based on these 103 responses. Table 1 provides the aggregated result to the survey questions and interactive visualizations of the results are also provided on the Bone2Gene website.
Demography
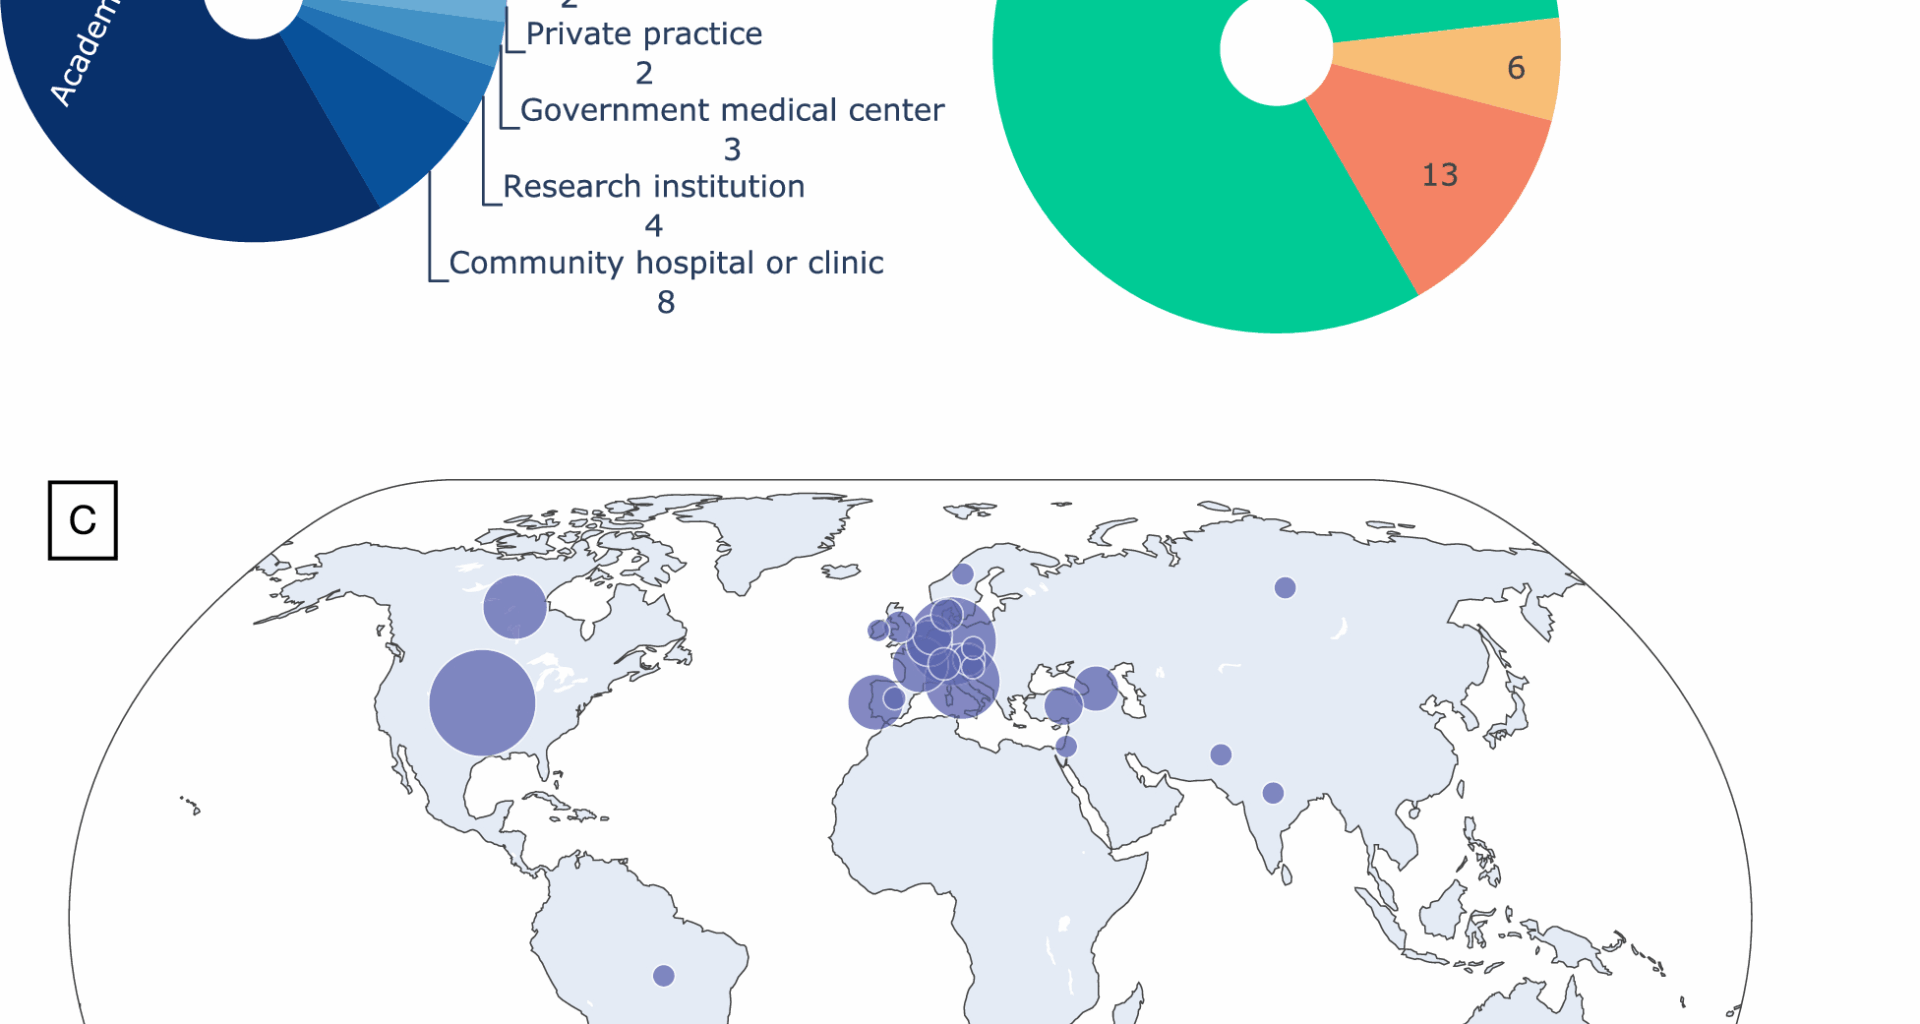
Out of a total of 103 complete survey responses 23 individuals (22%) describe themselves as involved in the diagnostic process, 6 (6%) in pre- and post-diagnostic care, and 69 (67%) are involved in both. The remaining 5 (5%) are only involved in research activities in this field. Ninety-two (89%) of the participants are physicians. The majority of participants (84, 81%) primarily work at academic medical centers (Fig. 1A) and have more than 10 years of experience (also 84, 81%, Fig. 1B). Ninety-six (93%) of the respondents are involved in teaching or training other healthcare professionals (Table 1 and Supplementary Fig. 1).
Fig. 1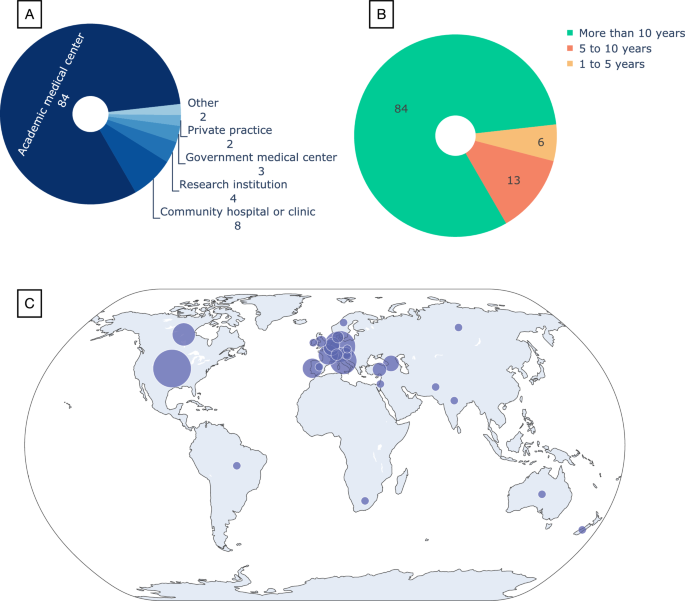
Demographics of the 103 participants who completed the survey. A Type of healthcare facility best describing where they primarily work. B Years of experience in the healthcare field. C The distribution of participants on the world map; the circle sizes reflect the number of participants (see the Supplementary information for the exact number per each of the 27 countries)
Survey participants represented most global regions (Fig. 1C) and a total of 27 different countries (Supplementary Fig. 2). Fifty-eight (56%) of the respondents are located in Europe and 30 (29%) are in the United States and Canada.
The diagram in Fig. 2 shows the distribution of the responses from the 92 physician participants to the question “Which title best describes your position?”. Participants could indicate multiple specialties. The most frequent groups were medical geneticists, pediatricians, and endocrinologists, together accounting for 71 (69%) of the respondents.
Fig. 2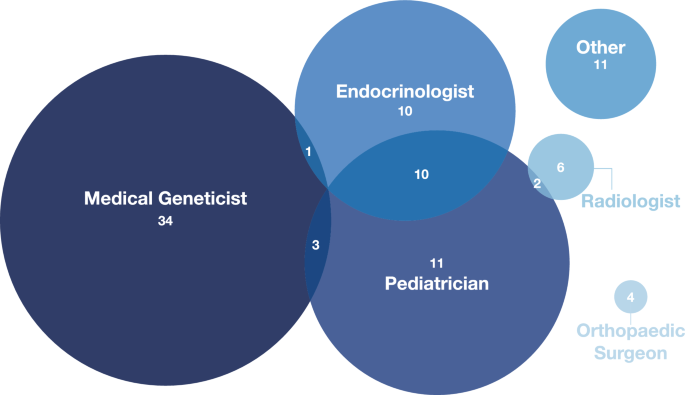
Specialties of the physician participants (n = 92). The most common specialty represented amongst participants was medical genetics. Some participants selected multiple specialties (e.g., endocrinologists who also practice pediatrics, n = 10). Other specialties represented include nephrologist, internist, rheumatologist, pediatric physiatrist, maternal–fetal medicine, general surgeon, pathologist, and geriatrician. We note that countries may have variable requirements regarding initial (general) training versus allowing clinicians to enter a subspecialty immediately, and some clinicians may have responded regarding their current practice rather than their entire training
Patients statistics
In this section, we report the responses to the questions related to the RBD patients seen by the participants. Fifty respondents (48%) see patients from all four age groups described in our questionnaire, namely 0–1,1–10,10–18, and greater than 18 years old. Further, most of the respondents see patients below 18 years old but 63 (61%) of them also see patients 18 years old or above (Table 1 and Supplementary Fig. 3).
The number of patients with known or suspected rare bone diseases seen by the facilities where the respondents work follows a roughly bell-shaped distribution (Supplementary Fig. 3). Sixty-four (62%) of the facilities see 10–100, seventeen (16%) see less than 10, and twenty-one (20%) see more than 100 patients per month.
According to the most recent revision of the nosology of RBDs [1] there are 41 different groups of skeletal disorders. In one of the questions in our survey, we asked the participants to mark all the groups that they or their healthcare facility have dealt with. The results are visualized in Supplementary Fig. 4. The most frequently observed disorder was the Osteogenesis imperfecta and bone fragility group, with 89% (n = 92) of participants reporting care of patients with this group of conditions at their institution. This was followed by Disorders of bone mineralization (n = 89, 86%) and FGFR3 chondrodysplasias (n = 88, 85%).
Role of imaging in diagnosing RBDs
Ninety-four (91%) of the respondents find imaging to be very or extremely important, and the majority (n = 84, 81%) consider X-rays to be the most important imaging modality (Table 1 and Supplementary Fig. 5).
Further, our result (Table 1 and Supplementary Fig. 6) shows that most participants, 83% (n = 86) regardless of years of experience, find the interpretation of patients’ radiographs and delineation of different RBDs based on visual inspection to be somewhat (n = 59) or extremely difficult (n = 27).
Participants’ perception of the use of AI
Forty-four percent of the participants (45/103) are somewhat (n = 31) or very (n = 14) concerned about AI-related errors, while 24% (n = 25) are not very concerned (Fig. 3A). Around half of the participants (n = 51) consider the explainability of AI algorithms to be very (42/103) or extremely (9/103) important (Fig. 3B). There was no relation between the years of experience of the participants and their answers to these questions.
Fig. 3
Responses of the participants regarding A concerns about potential AI errors, B importance of explainability, C regulatory considerations, and D willingness to undergo further training for using AI
On the subject of regulatory considerations or ethical concerns (Fig. 3C), the interpretability of AI algorithms received the most attention (n = 69) followed by data privacy and security (n = 64). Ninety-three (90%) of the participants indicated they would be willing to do additional training for utilizing AI (Fig. 3D), and when asked how likely they are to consider integrating image recognition AI into their current diagnostic workflow, 81% responded they were somewhat (n = 39) or extremely (n = 45) likely (Fig. 4). Forty-five participants expressed interest in further collaborations in this area.
Fig. 4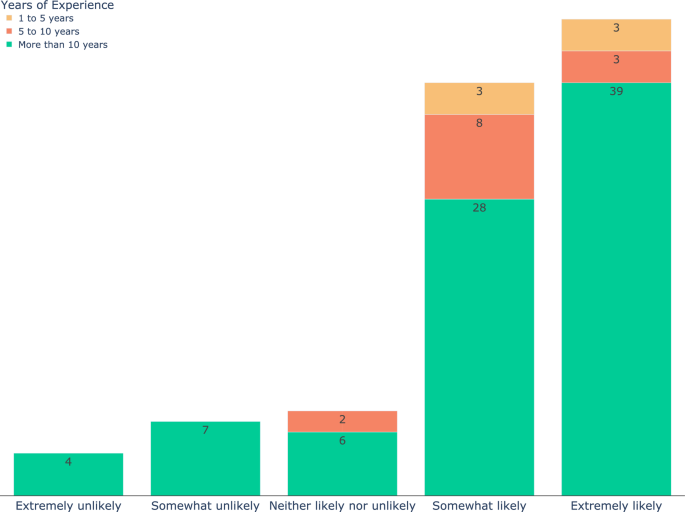
The responses of the participants to the question “If an image recognition AI is developed that provides you with a prioritized list of syndromes based on a radiograph, how likely are you to consider integrating it into your current diagnostic workflow?”. The color code shows the years of experience. Eighty-one percent of the participants (including all those with 1–5 years of experience) responded somewhat (n = 39) or extremely (n = 45) likely