
Identification of T3SS+ strains and candidate effectors in culture collections and MAGs
Reference genomes for Pseudomonadota strains isolated by the human microbiome project from human guts and available from DSMZ (via BacDive), ATCC (atcc.org) or BEI (beiresources.org) were identified and cross-referenced with GenBank (release 229), yielding 77 matches, and subjected to T3SS identification, along with 92,143 and 9,367 MAGs, respectively, from two different meta-studies21,22 that were at least 50% complete and less than 5% contaminated. Prediction performance of EffectiveDB16 was evaluated by fivefold cross-validation with five repeats using simulated MAGs of 0–100% completeness and 0–50% contamination (in 5% steps) by random sampling genes from the test set. A performance-improved re-implementation of the EffectiveDB classifier (https://github.com/univieCUBE/phenotrex, trained on EggNOG 4.0 annotations62) was used with a positive prediction threshold of >0.7.
For 770 T3SS+, MAGs protein coding sequences for 474,871 representative proteins were identified using prodigal (v.2.6.3)63 and CD-HIT (v.4.8.1, parameters: ‘-c 1.0’)64. A total of 61,115 proteins were encoded by 44 T3SS+ culture collection genomes. Three machine-learning tools (EffectiveT3 v.2.0.1, DeepT3 v.2.025 and pEffect27) were used to predict T3SS signal or effector homology. Predictions were integrated using a 0–2 scoring scheme: 2 for perfect score (pEffect >90, EffectiveT3 >0.9999, DeepT3: both classifiers positive prediction); 1 for positive prediction at default thresholds (pEffect >50, EffectiveT3 >0.95, DeepT3: one classifier); 0 for negatives. Sequences with a sum score above 4 were regarded as potential effectors. Sequences lacking start/stop codons or containing transmembrane regions (TMHMM 2.0) were excluded. Proteins were clustered using 90% sequence identity (CD-HIT parameters: ‘-c 0.9 -s 0.9’) to reduce redundancy. Effector clusters with diverse effector-prediction scores were removed (full data in Supplementary Data 1 and 2).
Cohort analyses
T3SS were analogously predicted for 4,753 strains from the human gastrointestinal bacteria genome collection (HBC)17, Broad Institute–Open Biome Microbiome Library (BIO–ML) and Global Microbiome Conservancy (GMC)18,19. To obtain phylogenetic relationships for T3SS+ strains, concatenated bac120 marker proteins from GTDB-Tk (v.2.1)65 were used. T3SS+ genomes were matched to Weizmann Institute of Science representative genomes of the human gut24 with FastANI v.1.0 using average nucleotide identity (ANI) values >95% (ref. 66). The relative abundance of the 10 matching representatives was identified across 3,096 Israeli and 1,528 Dutch individuals24.
Identification of effector similarities and homology groups
Effectors were aligned using the Needleman Wunsch algorithm and were considered ‘homologous’ in HuMMIHOM using mutual sequence identity of ≥30% over 90% of the common sequence length (Supplementary Data 11).
Commensal vs pathogen effector similarity
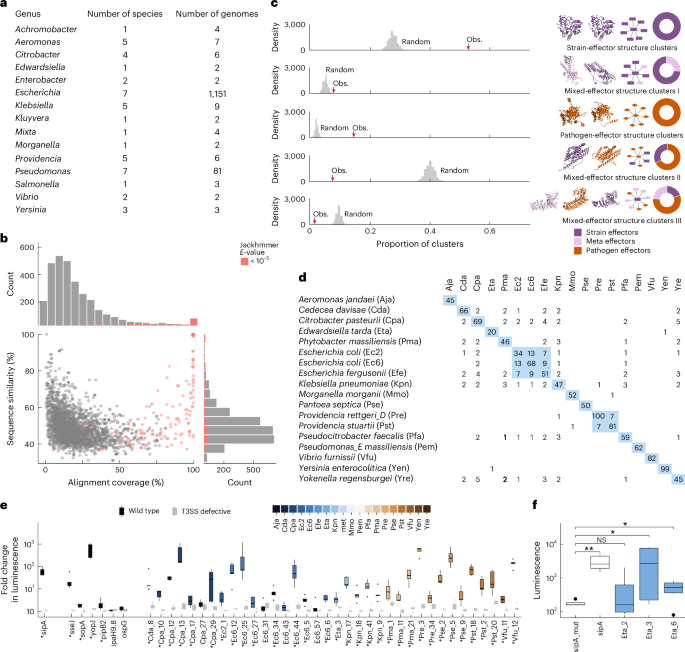
Sequences of 1,195 known pathogenic T3 effectors were obtained from BastionHub28 (29 August 2022), and sequence similarity between commensal and pathogenic effector sequences was assessed using BLAST (v.2.10)67. For each commensal effector, the pathogen effector with the highest sequence similarity was considered as the best match and used to calculate alignment coverage. Additional significant similarities were identified using iterative sequence searches against ~124 M non-redundant bacterial sequences from UniRef90 (January 2024) with Jackhmmer29. For each commensal effector, we ran five iterations using inclusion and comparison E-value thresholds of <10−5 (Supplementary Data 5).
Domain identification and analysis
Protein domain annotation for effectors was carried out using the standalone version of InterProScan (v.5.75-106.0), using Pfam v.37.4 as reference. Amino acid sequences in FASTA format were used as input across three datasets: effector proteins from commensal bacterial strains (n = 3,002) and MAGs (n = 186), human and vertebrate pathogen effectors obtained from BastionHub, and all reviewed human proteins from the UniProtKB/Swiss-Prot reference proteome. Pathogen effectors were classified on the basis of the host annotation (human, vertebrate) of the corresponding species or strain, as provided by PHI-base68 and BV-BRC69. InterProScan used (translated) protein sequences (Supplementary Data 4) with default parameters. Domain hits with an E-value < 10−5 were considered significant.
Domains identified as significant in commensal effectors were used as reference for comparative analysis and evaluated for their presence in pathogen effectors and human proteins, applying the same annotation criteria and significance threshold. All domain annotation results, including individual hits across datasets and the comparative summary, are provided in Supplementary Data 5.
Structural effector similarity
Structures of pathogen and commensal effectors were compared using FoldSeek70. Effector structures were downloaded from the AlphaFold DB when available; otherwise, a model with >95% sequence identity and >90% sequence coverage was selected as representative. Clustering was performed by setting bidirectional query coverages (qcov) at 0.5, 0.7 and 0.9, and E-value thresholds at 0.001, 0.01 and 1 using FoldSeek Cluster’s greedy set cover algorithm. To assess the statistical significance of the obtained cluster distributions, we performed label permutation tests (n = 10,000) while keeping the graph’s topology intact. The clustering analysis was run for all commensals against three sets of pathogen effectors: all pathogens (895 structures from human, vertebrate and plant pathogens), human and vertebrate pathogens (536 structures) and human pathogen effectors only (488 structures) (Supplementary Data 6).
Effector cloning
For PCR cloning, genomic DNA or bacterial stocks were obtained from culture collections: ATCC (via LGC Standards, Wesel, Germany, or ATCC, Manassas, VA, USA), DSMZ (Leibniz Institute DSMZ, Braunschweig, Germany) and BEI resources (Manassas, VA, USA) (Supplementary Data 9). Live strains were cultured according to supplier protocols and DNA was extracted using the NucleosSpin Plasmid mini kit. Effectors were cloned into pENTR223.1 by nested PCR to add Sfi sites and by restriction enzyme-based cloning using standard protocols, and verified by Sanger sequencing. Effectors identified from MAGs and effectors for the PRS were synthesized by Twist Bioscience. For experiments, effectors were moved into pDEST-DB (pPC97, Cen origin), the pDEST-N2H-N1 and -N2 and pMH-Flag-HA by Gateway LR reactions.
For bacterial injection assays, effector ORFs were cloned into a modified bacterial expression plasmid based on the pEYFP backbone (BD Biosciences, 6004-1). The EYFP sequence (positions 217–1,407) was removed and replaced with (1) SfiI and XbaI restriction sites for directional cloning of effector ORFs, (2) a 3× Flag epitope tag, (3) the HiBiT tag coding sequence VSGWRLFKKIS (Promega), and (4) the E. coli rrnB transcriptional terminator (pLac_FL_HiBiT). PCR-amplified effectors were ligated into pLac_FL_HiBiT at SfiI and XbaI restriction sites (primers in Supplementary Data 7). The positive control SipA was amplified from a pT10-based plasmid (pMIB6433)34. Cloning was verified by analytical PCR.
Electroporation of plasmids into bacterial strains for injection experiments
Electrocompetent S. enterica sv. Typhimurium (wild-type SB300 and ΔsctV mutant SB1751)34, E. tarda (ATCC 23685), C. pasteurii (DSM 28879) and P. massiliensis (DSM 26120) were generated in-house and electroporated with effector encoding plasmids using a Gene Pulser Xcell Electroporation System (Bio-Rad) at 2.5 kV and 200 Ω for ~5 ms. Transformed strains were cultured overnight in LB medium with ampicillin for subsequent use in injection assays.
Injection assay
The injection assay was adapted from ref. 34. HeLa cells stably expressing LgBiT (HeLa-LgBiT) were grown using standard conditions (DMEM, 10% fetal bovine serum (FBS), 37 °C, 5% CO2) for 24 h before infection. S. Typhimurium strains carrying pLac_FL_HiBiT effector constructs were cultured overnight in LB supplemented with 0.3 M NaCl and ampicillin. Edwardsiella tarda, C. pasteurii and P. massiliensis strains were cultured with 200 μM IPTG to induce effector expression. Overnight bacterial cultures were added to the HeLa-LgBiT cells at a multiplicity of infection of 50 and jointly incubated for 1 h (Salmonella) or 1.5 h. After media replacement, extracellular luminescence was quenched by addition of 1× DarkBiT peptide (Promega, CS3002A02) for 50 min. Luminescence was measured after addition of 25 μl fresh Nano-Glo reagent (Promega, N2012) using a SpectraMax ID3 microplate reader (1,000 ms). Each strain was tested with four technical replicates and five biological replicates performed on separate days. Luminescence values from technical replicates were averaged to obtain a single value for each biological replicate. Luminescence fold-change was calculated by dividing the average signal from the effector-expressing strain by that of the mock control separately for wild-type and ΔsctV strains. To assess effector translocation, fold-change values were statistically compared between wild-type and mutant strains for Salmonella and against the negative control (SipA in ΔsctV) for E. tarda, using Wilcoxon rank-sum test (Supplementary Data 10).
Western blot analysis for injection assay and co-immunoprecipitations
Proteins were separated by 10% or 15% SDS–PAGE, transferred to PVDF membranes (Bio-Rad, 1620177) and blocked in blocking solution (5% non-fat dry milk in 1× PBS) for 1 h at room temperature or overnight at 4 °C. Blots were done with mouse anti-Flag M2 monoclonal antibody (Sigma-Aldrich, F1804, 1:5,000), rabbit anti-Myc (Abcam, ab9106, 1:1,000), followed by HRP-conjugated secondary antibody (Santa Cruz Biotechnology; anti-mouse: sc-516102; anti-rabbit: sc-2357, both 1:5,000) for 1 h each with three washes with blocking solution or PBST, respectively. Signal was detected with SuperSignal West Femto Substrate (Thermo Scientific, 34094) according to manufacturer instructions. Blots were imaged using the Intas ChemoStar imaging system.
Meta-interactome mapping
A multi-assay interactome mapping pipeline was used37 (Extended Data Fig. 2). In the initial screening by Y2H, candidate effectors fused to the Gal4 DNA-binding domain (DB-X) were screened against 17,472 human proteins fused to the Gal4 activation domain (AD-Y). Before screening, DB-X ORFs were tested for autoactivation by mating against AD-empty plasmids. Autoactivators were excluded. In the primary screen, DB-X strains in Y8930 (MATα) were mated on yeast extract peptone dextrose (YEPD) agar (1%) plates against minipools of ~188 AD-Y in Y8800 (MATa) representing the human ORFeome collection (v.9.1)36. After 24 h, yeasts were replica-plated onto selective media lacking leucine, tryptophan and histidine (SC-Leu-Trp-His), containing 1 mM 3-AT (3-amino-1,2,4-triazole) (3-AT plates) and replica-cleaned after 24 h. After 48 h, colonies were picked and then grown for 72 h in SC-Leu-Trp liquid medium for secondary phenotyping using the same selective +SC-Leu-His + 1 mM 3-AT + 1 mg l−1 cycloheximide plates to identify spontaneous autoactivators. Clones growing on 3-AT plates but not on cycloheximide plates were processed for sequence identification using a modified Kilo-seq procedure35: ORFs were amplified and tagged by PCR using a universal ‘term’ reverse primer (5’-GGAGACTTGACCAAACCTCTGGC) and Gal4-AD and -DB specific forward primers with position barcodes (Supplementary Table 11) and a TruSeq P7 sequence (0.2 µl DreamTaq DNA polymerase (ThermoFisher, EP0702), 3 µl 2 µM term primer, 3 µl forward primer, 2 µl yeast lysis). For every 96-well plate, 5 µl from each well were pooled, purified with 24 µl magnetic beads (magtivio, MDKT00010075) and eluted in 25 µl TE buffer. The DNA concentration of each pool was quantified by the QuantiT PicoGreen dsDNA Assay kit (ThermoFisher, P7589) using a lambda DNA dilution series (50–0.390625 ng μl−1), then diluted to 1–2 ng μl−1 and tagmented with 0.25 µl TDE enzyme (Illumina Tagment DNA TDE1 Enzyme and Buffer kit, 20034197). A second PCR added plate-specific Nextera i5/i7 indices (Supplementary Table 11) (8 µl tagmented DNA, 0.2 µl DreamTaq (ThermoFisher, EP0702), 1 µl 10 µM i5/i7 primers), followed by bead cleanup (80 µl beads per 100 µl PCR, eluted in 30 µl). Libraries were sequenced on a MiSeq v.2 kit (Illumina, MS-102-2002) and demultiplexed with bcl2fastq2 (v.2.20.0.422) by Illumina.
Finally, haploid yeasts of the DB-X and AD-Y candidate interaction pairs were mated individually and tested four times on selective plates using empty AD and DB plasmids as negative controls. Growth scoring was performed using a custom dilated convolutional neural network35. Pairs scoring positive in at least three out of four repeats qualified as bona fide Y2H interactors. The AD-Y and DB-X constructs were again identified by Illumina sequencing. All interaction data are provided in Supplementary Data 11.
Assembling reference sets for quality control
To identify reliably documented interactions between bacterial effectors and human proteins for our control set, we queried the IMEx consortium protein interaction databases71 for pairs supported by multiple evidence and at least one experiment detecting direct interactions. We manually recurated the corresponding publications and identified 67 well-documented direct interactions between 29 T3 effectors and 64 human proteins, described in 38 distinct publications constituting bhLit_BM-v1. To assemble bhRRS-v1, we randomly paired T3 effectors from bhLit_BM-v1 with human proteins in HuRI (Supplementary Data 12). Effector ORFs were cloned into Entry and experimental plasmids as described above. Human hsPRS/RRS-v2 ORFs were taken from hORFeome9.1 (ref. 36) and verified by end-read Sanger sequencing.
Interactome validation by yN2H
yN2H was used to independently validate the quality of the HuMMI dataset38. A total of 200 interaction pairs were randomly picked from HuMMI; all ORFs (Supplementary Data 14) were transferred by Gateway LR reactions into pDEST-N2H-N1 and pDEST-N2H-N2, and transformed into haploid Saccharomyces cerevisiae Y8800 (MATa) and Y8930 (MATα) strains. Protein pairs from all datasets were randomly distributed across matching 96-well plates. Luminescence from reconstituted NanoLuc for each sample was measured on a SpectraMax ID3 (Molecular Devices) with a 2-s integration time. The normalized luminescence ratio (NLR) was calculated by dividing the raw luminescence of each pair (N1-X N2-Y) by the maximum luminescence value of one of the two background measurements. All obtained NLR values were log2 transformed and the positive fraction for each dataset was determined at log2 NLR thresholds between –2 and 2, in 0.01 increments. Statistical results were robust across a wide range of stringency thresholds. Supplementary Data 14 reports the results at log2NLR = 0. Reported P values were calculated by Fisher’s exact test.
Co-immunoprecipitation of selected effector–host interactions
We evaluated whether N-terminally Flag-HA-tagged effector, or negative control Flag-GFP, co-immunoprecipitated the human proteins carrying an N-terminal MYC tag. Transfections for test and control pairs were always processed in parallel. HEK293 cells (RRID: CVCL_0045, DSMZ) were seeded in 10-cm dishes at a density yielding 60–70% confluency on the day of transfection. Plasmid DNA and X-tremeGENE transfection reagent (Roche) were mixed at a ratio of 1:2 (µg DNA:µl reagent) in serum-free DMEM. Per dish, 10 µg plasmid DNA (consisting of 3 µg effector- or GFP-encoding plasmid, 3 µg plasmid encoding the human protein and 4 µg empty vector) was diluted in 500 µl serum-free medium, followed by the addition of 20 µl X-tremeGENE reagent. The mixture was inverted twice, incubated for 15 min at room temperature and then added dropwise to the culture dish containing cells in complete growth medium. Cells were incubated under standard culture conditions (37 °C, 5% CO2) for 24 h before downstream analysis.
For cell lysate preparation, all steps were performed on ice. Culture medium was aspirated, and cells were washed three times with ice-cold 1× PBS by rinsing and aspirating sequentially. Cells were lysed directly on the plate by adding 1 ml NP-40 lysis buffer per plate (50 mM Tris-HCl, pH 8.0, 150 mM NaCl, 1% (v/v) NP-40 and 2.5 mM EDTA, with Roche complete protease inhibitor). Cells were detached using a rubber policeman and transferred to a 1-ml centrifuge tube. Lysates were incubated on ice for 30 min and cleared by centrifugation at 30,000g for 15 min at 4 °C. The supernatant was collected and the protein concentration was measured using the Bradford assay (Bio-Rad); the lysate was immediately used.
For immunoprecipitation experiments, 1 mg of cleared lysates of each sample was diluted into a final volume of 750 µl, and then 50 µl of an NP-40 buffer equilibrated with 20% anti-Flag M2 affinity gel (Sigma-Aldrich, A2220) slurry was added. Samples were rotated at 4 °C for 1 h. For washing, the tube was centrifuged at maximum speed for 30 s, the supernatant aspirated and 1 ml NP-40 wash buffer added, followed by a brief inversion. After three washes, the beads were resuspended in 50 µl NP-40 buffer, 50 µl Laemmli loading buffer was added, and the beads were heated at 98 °C for 10 min and briefly centrifuged before analysis. For analysis, 10 µl of cleared lysates and 15 µl of all immunoprecipitates were loaded on SDS–PAGE and processed through western blots as described above.
Interactome framework parameter calculation
The completeness of an interactome map is an important parameter that enables assessment of overlap and how complete a given biology is covered by the map. The framework incorporates assay sensitivity (that is, the proportion of interactions the assay can detect), sampling sensitivity (that is, saturation of the screen) and search space, describing all pairwise protein combinations. For the meta-interactome studied here, the search space cannot reasonably be estimated due to the uncertainty of T3SS-containing microorganisms in all human guts and the resulting inability to define that dimension of the problem.
Assay sensitivity (Sa) was assessed using the effector bh_LitBM-v1 (54 pairs) and bhRRS-v1 (72 pairs) as well as the human hsPRS/RRS-v2 (60 and 78 pairs, respectively) for benchmarking. All reference sets were tested four times using the Y2H screening pipeline (Supplementary Data 13). To assess sampling sensitivity (Ss), a repeat screen was conducted. A total of 288 bacterial effectors were screened 4 times against 5 pools comprising 1,475 human proteins. A saturation curve was calculated as described37. In brief, all combinations of the number of interactions of the four repeats were assembled and the reciprocal values calculated. From these, a linear regression was determined to obtain the slope and the intercept. Reciprocal parameters were calculated and the Michaelis Menten equation was used with modified variables: analogous to increasing substrate concentrations in enzyme reactions, repeat screens progressively drive the screen to saturation91. Hence a saturation curve was predicted using Ni(R) = Nimax × R/Km + R, with Ni representing the interaction count after R repeats, Nimax the saturation limit and Km the Michaelis constant. Overall sensitivity emerges from both sampling and assay limitations and was calculated as So = Sa × Ss.
Intra- and interspecies effector convergence
To estimate the significance of effector convergence, we performed a permutation test by randomly sampling with replacement 979 target nodes from HuRI36 (n = 8,274). In each iteration, we counted the number of unique targets, and the distribution from 10,000 random permutations was used to compute the z-score for the observed 349 targets. A P value was obtained from the z-scores using the ‘pnorm()’ R command and multiplied by 2 for a two-tailed test. To avoid overestimation and increase stringency, we restricted the analysis to Y2H positive proteins in HuMMIMAIN and HuRI. To assess interspecies convergence, we used a conditional permutation test that preserves the strain contribution. Each iteration generated 18 samples corresponding to the observed number of targets for each strain (Supplementary Data 11). For every protein, the frequency of selection across all strains was recorded as its convergence value. On the basis of 10,000 iterations, we derived the convergence value distribution, calculated z-scores and obtained the P value using the pnorm() R function. Significance was observed from four strains onward (P < 0.004), and proteins targeted by at least four strains were considered to show interspecies convergence.
Sequence similarity and interaction profile
To investigate the relationship between the effector sequence and the interaction profile similarity, we calculated the pairwise Jaccard indices for all effector pairs within each homology cluster. The index was defined as the ratio of shared to total human targets. Pairs with fewer than three targets were excluded.
AlphaFold-based interaction modelling
To analyse the interfaces of effector–host interaction pairs, all identified pairs were subjected to structural prediction using AlphaFold v.2.3.1 with the following options: –model_preset=multimer, –db_preset=full_dbs, –max_template_date=2023-12-19, –num_multimer_predictions_per_model=1, –enable_cpu_relax and –use_precomputed_msas. Predictions were not generated for pairs whose combined length exceeded 2,500 residues. The predicted aligned error (PAE) matrix was extracted from the AlphaFold pickle output using alphapickle v.1.4.1 (https://github.com/mattarnoldbio/alphapickle, https://doi.org/10.5281/zenodo.5752375). To assess confidence, we used the confident contacts count (CCC), which is the number of residue–residue contacts72 with PAE < 4 Å. Each putative interface residue was assigned a PAE value. When a residue was in contact with multiple residues on the partner protein, the minimum PAE value among those contacts was used. Structure predictions were considered confident when the CCC was ≥5.
Interface similarity analysis using PAE thresholding
Protein sequences (Supplementary Data 17) were converted from single-letter aa notation to three-letter residue annotation, and residue identifiers were assigned to match their positions in the AlphaFold PAE matrix. Only human proteins targeted by at least two bacterial effectors were retained. Residue contacts were extracted and matched to PAE coordinates, and pooled PAE values defined the 25th, 50th, 75th and 95th percentile thresholds. Contacts with PAE values equal or below the threshold were retained, and the corresponding human and bacterial residues and total retained contacts were recorded. This procedure was repeated for the 25th, 50th, 75th and 95th percentiles, and the resulting subsets were merged into the main dataset.
Interface similarities
Interface similarity between bacterial effectors targeting the same human protein was assessed using the Jaccard index across all PAE thresholds. For each targeted human protein, all interacting bacterial effectors were identified, and all possible effector–effector combinations were generated. At each threshold, the Jaccard index was calculated as the number of overlapping human interface residues divided by the total number of unique residues in both interfaces. Indices were classified as distinct (Jaccard index ≤ 0.1), overlapping (0.1 < Jaccard index < 0.6) or same (Jaccard index ≥ 0.6). Analogous calculations were performed to analyse interfaces of human proteins targeted by the same bacterial effector.
Interface domain annotations
Domains were assigned to the interacting human proteins using InterProScan v.5.75 with InterPro release 106.0, run through the EBI web server. Domain coordinates, descriptions and confidence scores were retrieved. The number of interface residues within each domain boundary (n_interface_residues_in_domain) was then counted, along with the total residues in the predicted interface (n_residues_in_interface), the percentage of interface residues in the domain (IF%), the number of residues in the domain (Domain_length) and the proportion of the domain length relative to the full protein length (Domain%).
SLiM–domain interface predictions
We used as mimicINT43 input, a representative set of effectors identified in isolated strains (2,300 sequences clustered at 90% identity) and all effectors identified in MAGs (186). mimicINT detects domains in effector sequences using the signatures from the InterPro v.81.0 database73, retaining matches with an E-value < 10−5. For motif detection, mimicINT uses definitions available in the ELM database74. The IUPred 1.0 algorithm75 was employed to detect motifs in disordered regions with both short and long models (motif disorder propensity = 0.2 (ref. 76), minimum size = 5). The interface inference step used the 3did database77 for domain–domain templates and the ELM database (2022 release) for motif–domain templates. Two scoring strategies were applied. First, domain binding specificity within the same family was accounted for by computing a profile HMM-based domain score41 (stringency threshold = 0.3). Second, given the degenerate nature of motifs41, mimicINT uses Monte Carlo simulations to estimate the probability of a SLiM occurring by chance, by shuffling disordered regions of the input sequences to generate N randomized proteins. Effectors were first grouped by strain, with MAG-derived effectors assigned to the closest strain. Disordered regions were shuffled 100,000 times using two backgrounds: same-strain effectors (within-strain shuffling) and full effector set (interstrain shuffling). Motif occurrences in each effector were compared to those in the shuffled sequences, retaining only those with an empirical P < 0.1 in both backgrounds. To assess whether the number of inferred interface-resolved interactions exceeded random expectation, the analysis was controlled using 10,000 degree-controlled random networks generated from the human interaction search space (Supplementary Data 18).
For the reverse analysis of bacterial domains interacting with SLiMs in the human proteins, the annotated bacterial domains were matched to domains in the ELM templates. For interactors of the so-identified effectors (Efe_1, Pfa_18, Pre_16, Pst_8, Vfu_32), we identified disordered regions as above and screened these for motifs matching the templates in the ELM database, yielding the reported example.
Holdup assay
Holdup is a biochemical assay used to validate the interface predictions involving PDZ domains. A total of 54 human PDZ domains and 11 tandem constructs were recombinantly expressed as His6-MBP-PDZ constructs in E. coli BL21(DE3) pLysS and purified by Ni2+-affinity columns using 800 µl of beads (Chelating Sepharose Fast Flow immobilized metal affinity chromatography, Cytiva) per target. After elution, purified proteins were desalted using PD10 columns (GE healthcare, 17085101) into 3.5 ml 50 mM Tris (pH 8.0), 300 mM NaCl and 10 mM imidazole buffer. Protein concentrations were determined using A280 nm on a PHERAstar FSX plate reader (BMG LABTECH), and purity assessed by SDS–PAGE and capillary electrophoresis; 4 µM stocks were stored at −20 °C. Biotinylated peptides (10-mer) corresponding to the C-terminal sequences of effectors were synthesized by GenicBio Limited; the N-terminal biotin was attached via a 6-aminohexanoic acid linker, and all peptides were >95% pure (HPLC and MS). Peptides were solubilized in dH2O, 1.4% ammonia or 5% acetic acid, aliquoted at 10 mM and stored at −20 °C.
For the assay, 2.5 µl of streptavidin resin (Cytiva, 17511301) was incubated in a 384-well filter plate (Millipore, MZHVN0W10) for 15 min with 20 µl of a 42 µM peptide solution. The resin was washed with 10 resin volumes (resvol) of holdup buffer (50 mM Tris-HCl, 300 mM NaCl, pH 8.0, 10 mM imidazole, 5 mM dithiothreitol), incubated for 15 min with 5 resvol 1 mM biotin and washed three times with 10 resvol of holdup buffer. Individual PDZ domains were added to wells, incubated for 15 min, and unbound PDZ recovered by centrifugation into 384-well black assay plates for fluorescence readout. Concentrations were quantified by intrinsic Trp fluorescence, and fluorescein/mCherry was used for peak normalization. Binding affinities and equilibrium dissociation constants were calculated as previously described45, using the mean PBM concentration. Raw values and statistical analysis are provided in Supplementary Data 19.
Function enrichment analysis
Functional enrichment of effector targets was assessed using the ‘gost()’ function in the ‘gprofiler2’ R package (v.0.2.1)78 with HuRI as the background (custom_bg), excluding electronic annotations (exclude_iea = TRUE), with Benjamini–Hochberg correction (correction_method = ‘fdr’). Functional categories were drawn from Gene Ontology biological process terms (GO:BP), Kyoto Encyclopedia of Genes and Genomes (KEGG) pathways, and the Reactome pathways database (sources = c(‘GO:BP’, ‘KEGG’, ‘ REAC’)). Odds ratios and fold enrichments were calculated to estimate effect sizes, where the odds ratios was the ratio of odds in the target set to those in the HuRI background, and fold enrichment compared observed to expected annotated targets. Expected values were based on random sampling from the HuRI background (GO:BP = 6,988; KEGG = 3,250; Reactome = 4,592) (Supplementary Data 20). Similar analyses were performed for functional enrichment analysis of human proteins targeted by pathogens (Supplementary Data 20).
Metabolic subsystem analysis
We assessed enrichment of targeted enzymes across metabolic subsystems using the human genome-scale model Recon3D48. Recon3D is a curated static model of human metabolism that lacks post-translational and allosteric regulation. Ligases and kinases were excluded to focus on metabolic enzymes. For each of the 95 Recon3D subsystems, enrichment was tested using the ‘phyper()’ R function, with inputs corresponding to annotated and unannotated targeted enzymes and BH false discovery rate (FDR) correction. OR and fold enrichment were calculated as described for functional analyses (Supplementary Data 20).
Disease enrichment analysis
Associations of effector targets and convergence proteins with human disease genetics were tested using a two-sided Fisher’s exact test. Disease-causal genes were obtained from the Open Targets genetic portal (access date 23 August 2022), which integrates variant-to-gene distance, quantitative trait loci co-localization, chromatin interactions and variant pathogenicity79. The portal’s machine-learning model assigns each locus-to-gene (L2G) score to genes in loci identified in GWAS to identify the most probable causal gene. Genes with L2G ≥ 0.5 were considered causal as recommended80. Ensembl identifiers were converted to gene symbols using the biomaRt R package (v.2.60.1, Bioconductor 3.19), and Fisher’s exact test was implemented in R (fisher.test), stats v.4.2.2 using default parameters on 2 × 2 contingency tables comparing causal gene presence in query and background sets. HuRI protein encoding genes were used as the background, and targets or convergence proteins as the query sets. FDR correction and OR and fold enrichments were calculated as done for functional enrichment (Supplementary Data 21).
Random walk-based determination of commensal effector network neighbourhoods
We implemented a random walk with restart (RWR) algorithm, RWR-MH81, to explore the network neighbourhood of 338 human proteins targeted by 243 commensal effectors in HuRI36 (HuMMIMAIN). Human targets were used as seeds, with the restart probability of 0.7 generating a ranked list of proteins. Statistical significance was assessed by random walks in degree-preserved randomized networks. We generated 1,000 random networks from HuRI and computed RWR scores for each protein, retaining as network neighbour only those with empirical P < 0.01.
For each set of significant neighbourhood proteins, we tested for enrichment of Open Targets causal genes (L2G ≥ 0.5) linked to traits supported by at least three causal genes. Enrichment in each strain neighbourhood was assessed using two-sided Fisher’s exact test with BH correction. No associations were significant (FDR < 0.05). We therefore focused on 400 associations with nominal P < 0.01 and odds ratio > 3. Disease categorizations were refined to reflect aetiology; Sjogren syndrome, eczema and psoriasis were grouped as immunological rather than eye or skin traits, and osteoarthritis as musculoskeletal/connective tissue rather than metabolic traits. For Fig. 4d, related asthma and psoriasis terms were merged (Supplementary Data 23).
NF-κB activation assay
HEK293 cells (RRID: CVCL_0045, DSMZ) were maintained in DMEM, 10% FBS, 100 U ml−1 penicillin–streptomycin at 37 °C and 5% CO2. IKKβ (pRK5-Flag) and A20 (pEF4-Flag) served as positive and negative controls, respectively. Cells (1 × 10⁶ per 60 mm dish) were transfected with 10 ng NF-κB reporter plasmid (6× NF-κB firefly luciferase pGL2), 50 ng pTK reporter (Renilla luciferase) and 2 µg bacterial ORF in pMH-Flag-HA using the calcium phosphate method. After 6 h, medium was replaced. To assess NF-κB inhibition, cells were treated for 4 h with 20 ng ml−1 TNF (Sigma-Aldrich, SRP3177) at 24 h post transfection. Lysates were analysed using the dual-luciferase reporter kit (Promega, E1980) with a luminometer (Berthold Centro LB960 microplate reader, software: MikroWin 2010). NF-κB induction was determined as firefly/Renilla luminescence. P values were calculated using Kruskal–Wallis test with Dunn’s post hoc comparisons followed by FDR correction. Raw values and statistical analysis are provided in Supplementary Data 24.
Protein expression was analysed by western blot as described above with following modifications: blocking solution contained 0.1% Tween-20. Membranes were incubated overnight at 4 °C with primary antibodies in 2.5% BSA in PBST, washed and probed with anti-mouse secondary antibody in PBST for 1 h at room temperature (1:10,000; Jackson ImmunoResearch Labs, RRID:AB_2340770). Primary antibodies used were: anti-β-actin (1:10,000; Santa Cruz Biotechnology, RRID:AB_626632), anti-Flag M2 (1:500; Sigma-Aldrich, RRID:AB_259529) and anti-HA (1:1,000; Sigma-Aldrich, RRID:AB_514505). Signals were detected using LumiGlo reagent (CST, 7003S) and chemiluminescence film (Sigma-Aldrich, GE28-9068-36).
Cytokine assays
Caco-2 cells (RRID: CVCL_0025) were maintained in DMEM glutamax medium (Gibco) with 10% FBS and 1% Pen/Strep at 37 °C and 5% CO2. Experiments in Fig. 5c were performed by transfecting Caco-2 cells using 40,000 MW linear polyethylenimine (PEI MAX) (Polysciences) at a ratio of 1:5 pDNA:PEI. Cells were exposed to the transfection mixture for 16 h, washed, recovered for 6 h and then sorted (BD FACSAria III cell sorter, BD Biosciences). After 24 h recovery, cells were activated for 48 h using a stimulation mix containing 200 ng ml−1 phorbol-12-myristate-13-acetate (P8139, Sigma-Aldrich), 100 ng ml−1 lipopolysaccharide (L6529, Sigma-Aldrich) and 100 ng ml−1 TNF (130-094-014, Miltenyi Biotec). During activation, proliferation was monitored in the Incucyte S3 Live Cell Analysis system (Essen BioScience). Cytokine levels were determined using the human inflammation panel 1 LEGENDplex kit (Biolegend). We performed three biological repeats, each with three or four technical repeats. Statistical significance was tested on the average of the technical replicates using Kruskal–Wallis test with Dunn’s post hoc comparisons. Experiments in Fig. 5d and Extended Data Fig. 4d were performed by transfecting cells using the 4D-Nucleofector system (Lonza). Collected cells were resuspended in SF nucleofector solution, added with 0.6 µg plasmid, and pulsed (code DG-113) and plated in DMEM + 5% FBS. Cells were allowed to recover overnight and then rested in culture medium for 24 h. Cells were stimulated with 10 µg ml−1 Pam3CSK4 (tlrl-pms, Invivogen), 1 µg ml−1 flagellin (tlrl-stfla, Invivogen) or 100 ng ml−1 TNF (130-094-014, Miltenyi Biotec) for 24 h. We performed five biological repeat experiments with three technical repeats each. For each experiment, pooled supernatants were analysed using the Human Anti-virus Response Panel V02 (BioLegend). The data were analysed using Kruskal–Wallis test with Dunn’s post hoc comparisons. Raw and statistical summary data are available in Supplementary Data 25.
Protein ecology on IBD metagenomes
Metagenomic assemblies from the Inflammatory Bowel Disease Multiomics DataBases (IBDMBD)53 and from the skin metagenome82 were downloaded, and protein repertoires predicted using Prodigal (option: -p meta)83. Effectors were compared to the metagenomic protein repertoires using DIAMOND 0.9.24 (options: >90% query length, >80% identity). For analyses in Fig. 5, samples were grouped into individuals with ulcerative colitis (n = 304), Crohn’s disease (n = 508) and the controls without IBD (n = 334). Binary presence and absence vectors for each effector across the sample were generated and the prevalence of each effector in patients compared to the controls was assessed using Fisher’s exact test, implemented within the SciPy 1.9.3 Python 3.10.12 module, and FDR corrected using BH correction. Differences in prevalence distributions between healthy and either patient cohort were estimated using the Wilcoxon rank-sum test, implemented in the ‘wilcox.test()’ R function. We used fold change as the measure of effect size in Fig. 5e, calculated as prevalence in the test group divided by prevalence in the healthy group. To avoid division by zero, we applied a small pseudo-count to the healthy cohort data for individuals with 0% prevalence. The pseudo-count was equivalent to half a case in the healthy cohort (n = 334 individuals), ensuring minimal influence on results while enabling calculation of fold change. Statistical details are provided in Supplementary Data 26.
Statistics and reproducibility
Data were subjected to statistical analysis and plotted in Microsoft Excel 2010 or Python or R scripts. For comparison of normally distributed values, we used one-way analysis of variance (ANOVA). For comparison of values not passing the normality tests, we used either Kruskal–Wallis test with Dunn’s correction for multiple-group comparisons or Wilcoxon rank-sum test for two-group comparisons as indicated. Enrichments were calculated using Fisher’s exact test with Bonferroni FDR correction. All statistical evaluations were done as two-sided tests. Generally, a corrected P < 0.05 was considered significant. GO, KEGG and Reactome functional enrichments were calculated using the gprofiler2 R package with the indicated background sets. For the disease target enrichments and neighbourhood associations, no associations were significant after multiple hypothesis correction, which is why nominally significant associations calculated by Fisher’s exact tests were used for Fig. 4c,d. All raw values, n and statistical details are presented in Supplementary Data as indicated in figure legends and in Methods.
Reporting summary
Further information on research design is available in the Nature Portfolio Reporting Summary linked to this article.