
C. elegans strains and maintenance
C. elegans were maintained at 20 °C on standard nematode growth medium (NGM) seeded with OP50 E. coli39. In all the experiments, worms were raised at the standard temperature (20 °C) until adulthood and then transferred to the temperatures indicated in the corresponding figures (15 °C, 20 °C and 25 °C). All of the experiments were performed using hermaphrodite adult worms at the ages indicated in the corresponding figures and figure legends.
Wild-type (N2), TQ233 (trpa-1(ok999) IV, outcrossed 6× to wild-type N2 worms), LC141 (him-8(e1489) IV; cat-4(e3015) V, outcrossed 6× to N2), LC35 (cat-4(ok342) V, outcrossed 3× to N2), LC81 (cat-4(tm773) V, outcrossed 5× to N2), LC143 (pcbd-1(tm5924) I, outcrossed 4× to N2), LC87 (qdpr-1(tm2337) III, outcrossed 2× to N2), MT15620 (cat-2(n4547) II, outcrossed 6× to N2), MT14984 (tph-1(n4622) II, outcrossed 6× to N2), LC144 (agmo-1(e3016) III, outcrossed 6× to N2), LC74 (pah-1(ok687) II, outcrossed 5× to N2), MQ887 (isp-1(qm150) IV, outcrossed 3× to N2), DA1116 (eat-2(ad1116) II, outcrossed 2× to N2), DA597 (phm-2(ad597) I, outcrossed 2× to N2), SJ4100 (zcIs13[hsp-6p::GFP]) V, outcrossed 3× to N2) and AM141 (rmIs133[unc-54p::Q40::YFP] X, outcrossed 5× to N2) strains were obtained from the Caenorhabditis Genetics Center at the University of Minnesota (CGC), which is supported by the NIH Office of Research Infrastructure Programs (P40 OD010440). CF1041 (daf-2(e1370) III) and CF512 (fer-15(b26) II; fem-1(hc17) IV) were provided by C. Kenyon. BJ49 (kcIs6[ifb-2p::ifb-2a::CFP] IV)40 was a gift from R. E. Leube. The AM23 (rmIs298[F25B3.3p::Q19::CFP]) and AM716 (rmIs284[F25B3.3p::Q67::YFP]) strains were provided by R. I. Morimoto27. MAH602 (sqIs61[vha-6p::Q44::YFP + rol-6(su1006)]) was gifted by M. Hansen41.
For tissue-specific RNAi experiments, we used either rde-1- or sid-1-mutant worms in which wild-type rde-1 or sid-1 genes were rescued using tissue-specific promoters, respectively. The strains WM118 (muscle RNAi, rde-1(ne300) V; neIs9[myo-3p::HA::RDE-1 + rol-6(su1006)])42, IG1846 (epidermis RNAi 1, rde-1(ne300) V; frSi21[col-62p::rde-1 3′UTR] II; frIs7[nlp-29p::GFP + IV)43, NR222 (epidermis RNAi 2, rde-1(ne219) V; kzIs9[lin-26p::NLS::GFP + + rol-6(su1006)])44, MAH677 (neuronal RNAi, sid-1(qt9); sqIs71 [rgef-1p::GFP + rgef-1p::sid-1]45, IG1839 (intestine RNAi 1, rde-1(ne300) V; frSi17[mtl-2p::rde-1 3UTR] II; frIs7 [nlp-29p::GFP + col-12p::DsRed] IV)43, VP303 (intestine RNAi 2, rde-1(ne219) V; kbIs7[nhx-2p::rde-1 + rol-6(su1006)])46, and DCL569 (germline RNAi, mkcSi13[sun-1p::rde-1::sun-1 3′UTR + unc-119(+)] II; rde-1(mkc36) V) were provided by the CGC. The RB891 strain (ent-1(ok743) IV) was also obtained from the CGC and outcrossed four times to N2 wild-type worms to generate DVG397. Then, DVG397 was crossed with MAH677 and WM118 to generate DVG399 and DVG400, respectively.
The control DVG9 strain (N2, ocbEx9[myo3p::GFP]) was generated by microinjecting 20 ng μl−1 pPD93_97 (myo-3p::GFP) into the gonads of adult N2 hermaphrodite animals47. To generate DVG348 (N2, ocbEx280[sur-5p::cat-4, myo-3p::GFP]), we injected a DNA mixture containing 70 ng μl−1 of the sur5-p::cat-4 plasmid and 5 ng μl−1 pPD93_97 (myo3-p::GFP). Following this method, we generated the strains DVG349 (intestine-specific overexpression: N2, ocbEx281[gly-19p::cat-4, myo-3p::GFP]), DVG351 (neuron-specific overexpression: N2, ocbEx283[rgef-1p::cat-4, myo-3p::GFP]), and DVG352 (muscle-specific overexpression: N2, ocbEx284[myo-3p::cat-4, myo-3p::GFP]). Likewise, we used the neuronal-specific RNAi strain (MAH677) to generate DVG377 (sid-1(qt9); sqIs71[rgef-1p::GFP + rgef-1p::sid-1]; ocbEx301[myo-3p::cat-4, myo-3p::mCherry]) and the corresponding control DVG378 (sid-1(qt9); sqIs71[rgef-1p::GFP + rgef-1p::sid-1]; ocbEx302[myo3p::mCherry]). To generate DVG389 (trpa-1(ok999) IV; ocbEx309[myo-3p::GFP]) and DVG390 (trpa-1(ok999) IV; ocbEx310[myo-3p::cat-4, myo-3p::GFP]), we injected the gonads of TQ233 worms as indicated above.
To generate DVG373 (rmIs298[F25B3.3p::Q19::CFP]; ocbEx297[myo-3p::cat-4, myo-3p::mCherry]) and DVG375 (rmIs284[F25B3.3p::Q67::YFP]; ocbEx299[myo-3p::cat-4, myo-3p::mCherry]), we injected the gonads of AM23 and AM716 worms with a DNA mixture containing 100 ng μl−1 of the myo3-p::cat-4 plasmid and 5 ng μl−1 of pCFJ104 (myo-3p::mCherry). The corresponding control strains, DVG376 (rmIs298[F25B3.3p::Q19::CFP]; ocbEx300[myo-3p::mCherry]) and DVG380 (rmIs284[F25B3.3p::Q67::YFP]; ocbEx304[myo-3p::mCherry]), were generated by injecting 5 ng μl−1 of the pCFJ104 plasmid (myo-3p::mCherry) alone.
The VDL20/PHX10108 strain expressing endogenous CAT-4 tagged with GFP (cat-4(syb10108)) was generated by SunyBiotech (http://www.sunybiotech.com/) using the following sgRNAs: sg1, CACCACAACATCCTGCATGTTGG; and sg2, CCGTGACGATCCAAAGACTCGCG. Genome editing was confirmed by sequencing the cat-4 gene fused to GFP (primers: 5′-CATTTAGTTCCATTTATGGG-3′ and 5′-TTTGGAGCTCGAGTCGCTTA-3′). From the VDL20 strain, we generated DVG387 (cat-4::SL2::GFP) by CRISPR–Cas9-mediated insertion48 of an SL2 sequence using the crRNA AAAGGAGAAGAACTTTTCAC, enabling independent translation of CAT-4 and GFP from a single bicistronic pre-mRNA transcribed under the endogenous cat-4 promoter. The editing was confirmed using the following primers: 5′-CCGGAGTTGCAGTTGTTATTG-3′ and 5′-TCTCGAGAAGCATTGAACACC-3′.
For all C. elegans experiments, exact sample sizes are indicated in the corresponding figure legends. No statistical methods were used to predetermine sample size. Sample sizes were selected based on standards established in the field and were similar to or greater than those reported to be sufficient in previous studies using the same procedures (for example, lifespan, nose-touch, chemotaxis and motility assays)2,10,28,49,50,51,52. Worm populations were synchronized either by allowing young hermaphrodites to lay eggs for 6 h or by bleaching53. For synchronization by egg laying, young hermaphrodites were randomly selected from maintenance plates. For synchronization by bleaching, agar chunks containing mixed-stage animals were randomly selected from maintenance plates, and larvae were allowed to develop until sufficient young hermaphrodites were available for bleaching. After the 6 h egg-laying period or bleaching, larvae were raised to adulthood. For lifespan assays, adult worms were randomly selected from the synchronized population and allocated to the different experimental conditions. For all other experiments, adult worms were randomly distributed from single synchronized populations into the different experimental groups. Thus, allocation of worms to experimental conditions was randomized throughout the study. Samples from different experimental conditions were collected and lysed in a randomized order to minimize potential processing-order effects. Samples and experimental conditions were not processed in a blinded manner. To minimize potential bias and assess reproducibility, key experiments, including phenotypic assays, were independently repeated by at least two researchers involved in the study.
Metabolomics
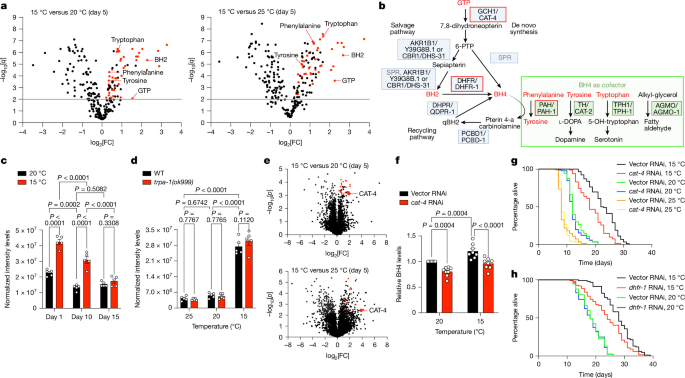
Adult worms were collected at the ages indicated in the corresponding figures. Worms were lysed in an extraction solution consisting of 50% LC–MS–grade methanol (Thermo Fisher Scientific, 10284580), 30% LC–MS–grade acetonitrile (Thermo Fisher Scientific, 10001334), 20% ultrapure water and 5 μM valine-d8 (CK Isotopes, DLM-488), using a volume equivalent to 10× the worm pellet weight. The worm pellet was transferred to a Precellys tube and homogenized using a Precellys Evolution Touch Homogenizer (Bertin Technologies). The lysates were then transferred to Eppendorf tubes and incubated for 15 min at 4 °C on a shaker at maximum speed. After incubation, the samples were centrifuged at the maximum speed for 25–40 min and the supernatant was collected.
The worm extracts were normalized by weight for metabolomics analysis of all possible metabolites. Metabolites were separated chromatographically using a Millipore SeQuant ZIC-pHILIC analytical column (5 µm, 2.1 × 150 mm) with a matching 2.1 × 20 mm guard column, both with 5 µm particle size. A binary solvent system was used, consisting of 20 mM ammonium carbonate with 0.05% ammonium hydroxide as solvent A and pure acetonitrile as solvent B. Chromatography was performed at 40 °C with a flow rate of 0.200 ml min−1, using the following gradient program: 80% solvent B from 0 to 2 min, a linear gradient to 20% solvent B from 2 to 17 min, a rapid return to 80% solvent B from 17 to 17.1 min, and a hold at 80% solvent B from 17.1 to 23 min. The autosampler tray was maintained at 4 °C, and 5 µl of each sample was injected. The samples were randomized to minimize analytical variability, and pooled quality-control samples, prepared by mixing equal volumes of all individual samples, were analysed regularly to ensure consistency.
Metabolite quantification was performed using a Vanquish Horizon UHPLC system coupled to the Orbitrap Exploris 240 mass spectrometer (Thermo Fisher Scientific) with a heated electrospray ionization (HESI) source. Ionization parameters were set to +3.5 kV (positive mode) and −2.8 kV (negative mode), with an RF lens value of 70, a heated capillary temperature of 320 °C and an auxiliary gas heater temperature of 280 °C. Sheath gas flow was set to 40, auxiliary gas to 15 and sweep gas was off. MS1 scans covered a mass range of m/z 70–900, with automatic gain control (AGC) targets and maximum injection times. Data were acquired in full-scan mode with polarity switching at a resolution of 120,000. The AcquireX Deep Scan workflow facilitated untargeted metabolite identification by iterative data-dependent acquisition. Fragmentation was conducted with resolutions of 60,000 for full scans and 30,000 for MS/MS, an intensity threshold of 5.0 × 10³, a 10 s dynamic exclusion, a 5 ppm mass tolerance, an isolation window of 1.2 m/z and stepped normalized collision energies of 30, 50 and 150. Mild trapping was enabled to improve signal quality.
Metabolite identification was performed using Compound Discoverer software (v.3.2, Thermo Fisher Scientific), with criteria including a precursor ion m/z within 5 ppm of the theoretical mass, fragment ions within 5 ppm of an internal spectral library, a minimum match score of 70 and retention times within 5% of purified standards analysed under identical conditions. For downstream analyses, we focused on annotated metabolites with spectra and retention times matching entries in our in-house library, which contains over 1,000 compound standards. Peak area integration and chromatogram review were carried out using TraceFinder software (v.5.0, Thermo Fisher Scientific). To correct any potential variations introduced from sample handling to instrument analysis, we normalized the detected metabolites in each sample using the probabilistic quotient normalization method54. The data were processed using the R package MetaProViz55 (https://github.com/saezlab/MetaProViz), with the only modification being that probabilistic quotient normalization was performed using 100% of the features from the multtest package (v.2.56.0)56, instead of total ion count normalization. Downstream statistical analyses were performed using GraphPad Prism (v.10.6.0). Data were analysed with two-sided unpaired t-tests, followed by the two-stage step-up method of Benjamini, Krieger and Yekutieli to correct for multiple comparisons.
For correlation analysis of metabolite changes between independent datasets (experiments 1 and 2), metabolites were filtered to retain metabolites, log2[fold change] and FDR-adjusted P (q value). The datasets were merged using an inner join on metabolite names. Significance was defined as an FDR-adjusted P < 0.01. Pearson correlation was calculated using only metabolites that were significant in both datasets. Scatter plots showing log2-transformed fold changes from experiments 1 and 2 were generated using the ggplot2 package (v.4.0.3) in R (v.4.5.2). Reference lines at zero (x and y axes) and a diagonal identity line (slope = 1) were included to aid interpretation. The Pearson correlation coefficient (r) and corresponding P value were annotated on the plot. Extreme outliers (for example, carnitine-C16) were excluded before visualization. For Venn diagram analysis, significantly upregulated metabolites were identified independently in each dataset using thresholds of fold change > 1 and FDR-adjusted P < 0.01. Venn diagrams were generated using the ggvenn package (v.0.1.19) in R (v.4.5.2). Dot plots comparing the 45 commonly and significantly upregulated metabolites (fold change > 1 and FDR-adjusted P < 0.01) across experiments 1 and 2 were generated using ggplot2 (v.4.0.3) in R (v.4.5.2).
ELISA quantification of BH4 levels
We quantified BH4 levels using a BH4 ELISA Kit (Novus, NBP2-74983), according to the manufacturer’s instructions. Worms were lysed at day 5 of adulthood in protein lysis buffer (50 mM Tris-HCl, pH 7.8, 150 mM NaCl, 0.25% sodium deoxycholate, 1 mM EDTA and protease inhibitor (Roche)) using a Precellys 24 homogenizer. Worm lysates were centrifuged at 10,000 rpm for 10 min at 4 °C and the supernatant was collected. Protein concentrations were determined with standard BCA protein assay (Thermo Fisher Scientific). In total, 650 µg of total protein was used for measurement.
Label-free quantitative proteomics
For comparison of protein abundance across temperatures (15 °C, 20 °C and 25 °C), synchronized day 5 adult worms were lysed in urea buffer (8 M urea, 50 mM triethylammonium bicarbonate (TEAB)) by glass-bead homogenization and cleared by centrifugation (13,000 rpm, 10 min). The supernatants were reduced with 5 mM dithiothreitol (DTT) for 1 h, alkylated with 40 mM chloroacetamide for 30 min and digested with trypsin (1:75 ratio, w/w) after dilution of urea to 2 M with 50 mM TEAB. For tyrosine-treatment experiments, day 3 adult worms were lysed in urea buffer as indicated above. The supernatants were reduced with 10 mM DTT for 30 min, alkylated with 40 mM chloroacetamide for 30 min and digested with Lysyl endopeptidase (Lys-C, 1:100 ratio) at 25 °C for 2 h. Proteins were then further digested with trypsin (1:50 ratio) after dilution of urea to 2 M with 50 mM TEAB. One day later, the samples were acidified with formic acid (1% final concentration), cleared by centrifugation (16,000 g for 5 min), purified using StageTips and subjected to mass spectrometry (MS) analysis.
MS was performed at the CECAD Proteomics Facility. Temperature-comparison samples were analysed on the Orbitrap Exploris 480 mass spectrometer equipped with a FAIMSpro differential ion mobility device coupled to an UltiMate 3000 (Thermo Fisher Scientific). Tyrosine-treatment samples were analysed on the Orbitrap Eclipse coupled to a Vanquish neo system (Thermo Fisher Scientific). The samples were loaded onto a precolumn (Acclaim 5 µm PepMap 300 µ Cartridge or Ionopticks NanoShield, respectively) before being reverse-flushed onto an in-house-packed analytical column (30 cm length, 75 µm inner diameter, filled with 2.7 µm Poroshell EC120 C18, Agilent) or an Aurora Ultimate 25 cm column (Ionopticks), respectively. Peptides were chromatographically separated at a constant flow rate of 300 nl min−1 on a 90 min linear gradient running 0.1% formic acid against increasing amounts of 80% acetonitrile with 0.1% formic acid. For measurements where FAIMS pro was used, it was operated at constant −50 V compensation voltage and electrode temperatures of 99.5 °C for the inner and 85 °C for the outer electrode.
For the gas-phase fractionated library57, a pool generated from all samples was analysed in six individual runs covering the range from 400 m/z to 1,000 m/z in 100 m/z increments. For each run, MS1 was acquired at 60,000 resolution with a maximum injection time of 98 ms and an AGC target of 100%. MS2 spectra were acquired at 30,000 resolution with a maximum injection time of 60 ms. Spectra were acquired in staggered 4 m/z windows, resulting in nominal 2 m/z windows after deconvolution using ProteoWizard58.
For each sample acquired on the Orbitrap Exploris 480, MS1 scans were obtained from 399 m/z to 1,001 m/z at 15,000 resolution. The maximum injection time was set to 22 ms and the AGC target was set to 100%. MS2 scans ranged from 400 m/z to 1,000 m/z and were acquired at 15,000 resolution with a maximum injection time of 22 ms and an AGC target of 100%. DIA scans covering the precursor range from 400 to 1,000 m/z and were acquired in 60 × 10 m/z windows with an overlap of 1 m/z. All of the scans were stored as a centroid. For samples acquired on Orbitrap Eclipse, the MS1 and MS2 resolution was set to 30,000 with a maximum injection time of 54 ms and identical AGC targets. The same range of 400 to 1,000 m/z was covered using 20 windows of 30 m/z each.
For samples acquired on the Orbitrap Exploris 480 (temperature-comparison datasets), the gas-phase fractionated library was build using DIA-NN (v.1.8.1)59 and the C. elegans proteomic database from WormBase (PRJNA13758.WBPS15, downloaded on 27 July 2021), with settings matching acquisition parameters. The samples were analysed in DIA-NN v.1.8.1 as well using the previously generated library and identical database. DIA-NN was run with the additional command line prompts ‘–report-lib-info’ and ‘–relaxed-prot-inf’. Further output settings were: filtered at 0.01 FDR, N-terminal methionine excision enabled, maximum number of missed cleavages set to 1, minimum peptide length set to 7, maximum peptide length set to 30, minimum precursor m/z set to 400, maximum precursor m/z set to 1,000 and cysteine carbamidomethylation enabled as a fixed modification. Next, the DIA-NN output was further filtered on a library q value and global q value of ≤ 0.01 and at least two unique peptides per protein using R (v.4.1.3). Then, label-free quantification values were calculated using the DIA-NN R package. The results were analysed using Perseus (v.1.6.15)60. Proteins were filtered for data completeness in at least one replicate group and missing values imputed using sigma downshift approach with standard settings. Next, FDR-controlled two-sided t-tests were performed between the experimental groups and WormBase IDs mapped to UniProt IDs.
For samples acquired on Orbitrap Eclipse (tyrosine-treatment datasets), a directDIA approach using Spectronaut 20.5 (Biognosys) was used with the GPF runs added as supporting runs and searched against the WormBase C. elegans proteomic database (PRJNA13758.WBPS19, downloaded 4 January 2025). The Spectronaut output was imported into R (v.4.5.2) for downstream analysis. Protein groups were expanded to individual UniProt identifiers, mapped to gene symbols using the C. elegans annotation database (org.Ce.eg.db, v.3.22.0), and protein abundances were summarized at the gene level using median values. Proteins with >50% missing values across samples were excluded. Protein intensities were log2-transformed after addition of a pseudocount of 1. Differential protein abundance analysis was conducted using the limma package (v.3.66.0) with two-sided empirical Bayes-moderated t-test. Proteins were considered differentially abundant when they exhibited an absolute log2-transformed fold change of >0.58 (corresponding to a 1.5-fold change) and a nominal P value < 0.05.
ORA
ORA was performed using the enrichGO function from the clusterProfiler package in R (v.4.5.2) to identify Gene Ontology (GO) terms enriched among differentially abundant proteins. Analyses were conducted using the org.Ce.eg.db annotation database (v.3.22.0). GO Biological Process and Molecular Function ontologies were analysed using a one-sided hypergeometric test. Multiple-testing correction was performed using the Benjamini–Hochberg method, with significance thresholds of P < 0.05 and q < 0.2. For visualization, enrichment results were converted to gene ratios (GeneRatio), representing the proportion of input genes associated with each GO term. Dot plots were generated using ggplot2 (v.4.0.3), with the x axis representing the gene ratio, the y axis indicating GO terms, point size corresponding to the number of genes associated with each term (Count) and point colour representing statistical significance (−log10[P]).
Analysis of transcriptomic data
The temperature-dependent gene expression data from day 3 adult C. elegans at 15 °C and 25 °C were obtained from the NCBI Gene Expression Omnibus (GEO) database under accession number GSE62297 (ref. 12). Raw data were reanalysed using the database’s in-built GEO2R web tool with default parameters, including multiple-testing correction using the Benjamini–Hochberg method to calculate FDR-adjusted P values.
qPCR
Total RNA was isolated from synchronized day-5 adult worms using RNAbee (Tel-Test, CS501-B). We then generated cDNA from isolated RNA using the qScript Flex cDNA synthesis kit (Quantabio). Quantitative PCR (qPCR) assays were performed with SYBR Green and a 1:20 dilution of cDNA on the CFX384 Real-Time System (Bio-Rad). Gene expression levels were normalized to the geometric mean of cdc-42 and Y45F10D.4 (ref. 61). Data were analysed using the comparative \({2}^{\varDelta \varDelta {C}_{{\rm{t}}}}\) method, which provides relative changes in gene expression to the control condition after correction for housekeeping genes62. Details about the primers used for qPCR are provided in Supplementary Table 8.
Imaging and quantification of the CAT-4 reporter
For imaging of the DVG387 (cat-4p::cat-4::SL2::GFP) reporter strain or AID-strains (cat-4::3×Flag::mIAA7::GFP), day 5 adult worms were immobilized with 0.1% sodium azide in M9 buffer and mounted on glass slides under coverslips. Fluorescence images of whole worms were acquired using the Zeiss Axio Zoom.V16 microscope. For quantification of GFP intensity, the anterior region of the intestine was outlined and quantified using ImageJ (v.1.54p). For muscle regions, higher-magnification images were acquired using the Zeiss ApoTome Axio Imager Z.1 fluorescence microscope.
RNAi constructs
Hermaphrodite worms were fed HT115 E. coli carrying either an empty control vector (L4440) or vectors expressing double-stranded RNAi. The RNAi constructs targeting cat-4, ent-1, ent-6 and hsf-1 were obtained from the Ahringer library. The mdt-15, Y39G8B.1, dhs-31, dhfr-1, qdpr-1, pcbd-1, ent-4, ent-5, cco-1, agmo-1, cat-2, pah-1, tph-1, hpd-1, cct-2 and fkb-6 RNAi constructs were obtained from the Vidal library. The daf-16 and psme-3 RNAi constructs were generated in previous studies2,63. All RNAi constructs were sequence verified. A list of the RNAi sequences is provided in Supplementary Table 8.
AID
Genome editing was performed using a CRISPR protocol as previously described48. The strain PP4642, cat-4(hh131[cat-4::3×Flag::mIAA7::gfp] V, was generated by inserting a C. elegans codon-optimized 3×Flag::mIAA7 sequence in-frame immediately upstream of the GFP sequence in the strain VDL20 cat-4(syb10108[cat-4::GFP]) V. The strain PP4640, wrdSi58[eft-3p::TIR1(F79G)::F2A::mTagBFP2::AID*::NLS::tbb-2 3′UTR] II, was generated by introducing the F79G mutation into TIR1 in strain JDW313. Similarly, PP4641 (reSi11[unc-54p::TIR1(F79G)::F2A::mTagBFP2::AID*::NLS::tbb-2 3′UTR] II) was generated by mutating TIR1(F79G) using DV3825 strain. All genomic modifications were confirmed by Sanger sequencing. A list of the oligonucleotide sequences used for strain generation and sequencing is provided in Supplementary Table 8.
PP4640, PP4641 and PP4642 were each outcrossed five times to N2 wild-type worms. The strains PP4634 (cat-4(hh131[cat-4::3×Flag::mIAA7::GFP] V;wrdSi58[eft-3p::TIR1(F79G)::F2A::mTagBFP2::AID*::NLS::tbb-2 3′UTR] II) and PP4635 (cat-4(hh131[cat-4::3×Flag::mIAA7::GFP] V; reSi11[unc-54p::TIR1(F79G)::F2A::mTagBFP2::AID*::NLS::tbb-2 3′UTR] II) were generated by crossing PP4642 with PP4640 and PP4641, respectively.
AID experiments were performed as described previously64 with minor modifications. To induce CAT-4 degradation, age-synchronized animals were transferred to E. coli OP50-seeded NGM plates supplemented with 10 µM auxin (5-Ph-IAA, Biozol, T8885) at the ages indicated in the corresponding figures and maintained on auxin-containing plates until the end of the experiment.
Construction of cat-4 C. elegans expression plasmids
To construct the C. elegans plasmid for ubiquitous somatic overexpression of cat-4, pPD95.77 from the Fire Lab kit (Addgene) was digested with SphI and XmaI to insert 3.6 kb of the sur-5 promoter. The resulting vector was then digested with KpnI and EcoRI to excise GFP and insert a multicloning site. F32G8.6 (cat-4) was PCR amplified from cDNA to include 5′ XbaI and 3′ KpnI restriction sites and subsequently cloned into the vector described above. To generate the neuron-specific overexpression cat-4 plasmid, the pMS1 plasmid (rgef-1p::rpn-6.1::unc-54 3′UTR) containing an inserted multicloning site10 was digested with 5′ KpnI and 3′ApaI restriction sites. Then, cat-4 was PCR-amplified from cDNA to include 5′ KpnI and 3′ ApaI restriction sites and cloned into pMS1. Using the same strategy, cat-4 was cloned into pMS2 (gly-19p::rpn-6.1::unc-54 3′ UTR)10 to generate intestine-specific expression plasmid. For the muscle-specific expression plasmid, the pMS3 plasmid (myo-3p::rpn-6.1::unc-54 3′ UTR)10 was digested with 5′ XbaI and 3′ AscI restriction sites. All constructs were sequence-verified.
Lifespan assay
Synchronized larvae obtained by an egg laying protocol were raised on OP50 E. coli at 20 °C until day 1 of adulthood. Once hermaphrodite worms reached adulthood, they were shifted to a given temperature (15 °C, 20 °C or 25 °C) on plates seeded with HT115 E. coli carrying either empty vector or RNAi constructs. When indicated in the corresponding figure legends, RNAi treatment was initiated from hatching. For lifespan experiments with mutant and AID worms, the animals were fed OP50 E. coli throughout adulthood. Adult worms (n = 96 per condition) were scored every day or every other day49. From the initial population, worms that were lost, burrowed into the medium, or exhibited a protruding vulva or bagging phenotype were censored. We used GraphPad Prism (v.10.6.0) and OASIS (v.2)65 to determine median and mean lifespan, respectively. The P values were calculated with GraphPad Prism (v.10.6.0) using the log-rank (Mantel–Cox) method and refer to comparisons between experimental and control animals within a single lifespan experiment. Each lifespan graph represents a single, representative experiment. Supplementary Table 7 contains the number of total/censored worms and detailed statistical analyses for each replicate lifespan experiment.
Motility assay
C. elegans were synchronized on OP50 E. coli using the egg-laying method and grown to day 1 of adulthood, then randomly transferred to plates seeded with OP50 and vehicle control (DMSO) or BH2. At the ages indicated in the corresponding figures, worms were randomly picked and placed in 20 μl of M9 buffer on a microscope slide. After 30 s of adaptation, the number of body bends (that is, change in direction of the bend at the mid-body) was counted for 30 s27,66.
Brood size
Wild-type worms were maintained on standard NGM plates seeded with E. coli OP50 until the late L4 stage. Animals were then transferred to plates supplemented with 500 µM BH2 or DMSO vehicle control. Three worms were placed onto each experimental plate and transferred daily to freshly prepared treatment plates until egg laying ceased. The numbers of viable progeny and unhatched eggs were scored every 24 h. Brood size was calculated as the total number of progeny produced per worm throughout the reproductive period.
Bacterial colonization assay
Bacterial invasion assays were performed as previously described21,22. HT115 E. coli cultures were grown overnight at 37 °C, induced with 1 mM IPTG for 4 h, collected and concentrated tenfold by centrifugation. Concentrated HT115 bacteria carrying the empty vector plasmid were mixed at a 4:1 ratio with concentrated HT115 bacteria expressing mCherry from the pDP151 plasmid. NGM agar plates were seeded with the bacterial mixture and allowed to dry at room temperature for 24 h. L4 larvae synchronized by an egg-laying protocol were randomly transferred onto the seeded plates and maintained under the indicated experimental conditions. Worms were analysed by fluorescence microscopy at day 1 and day 10 of adulthood. Before imaging, worms were gently collected from plates, washed three times with M9 buffer and transferred to OP50 E. coli plates for 2 h to eliminate residual fluorescent bacteria from the intestinal lumen. Worms were then immobilized in 0.1% sodium azide in M9 buffer on 2% agarose pads. Fluorescence images were acquired using the Zeiss Axio Zoom.V16 fluorescence microscope. For quantification of fluorescence signal, worms were outlined and quantified using ImageJ software (v.1.51s).
Chemotaxis assay
After development at 20 °C, synchronized adult worms were either kept at 20 °C or transferred to 15 °C until the ages specified in the corresponding figures. Chemotaxis tests were performed on freshly poured agar plates (2% agar, 5 mM KPO4 at pH 6.0, 1 mM CaCl2, 1 mM MgSO4). The plates were sectioned into four quadrants, along with an inner circle measuring approximately 1 cm across diagonally. A benzaldehyde attractant (0.5% benzaldehyde in ethanol supplemented with 0.25 M sodium azide) was applied to one pair of diagonal quadrants, while the opposite quadrants received a control mixture (ethanol + 0.25 M sodium azide). On the specified adult days (as indicated in figure legends), worms were collected in S-Basal medium, washed three times to remove residual bacteria and deposited at the centre of the plate. After sealing with Parafilm, the plates were incubated at the indicated temperatures for 90 min. Worms were then counted in each quadrant, excluding those remaining within the central circle. The chemotaxis index was calculated using the following formula: (number of animal in attractant quadrants − number of animals in control quadrants)/total number of animals (ref. 67).
Nose-touch assay
Age-synchronized worms were assessed for nose-touch response according to established protocols28,50,68,69. In brief, the worms were placed onto a thin lawn of bacteria and allowed to move forward. A fine eyelash tool was gently positioned in the path of each moving worm. Animals that failed to reverse and instead continued crawling over or under the eyelash were scored as non-responsive. For each experimental group, 40 worms were tested, and their responses to 10 gentle eyelash touches were recorded.
BH2 and tyrosine supplementation
For BH2 supplementation, synchronized day 1 adult worms were collected and randomly distributed onto OP50 E. coli-seeded plates containing either BH2 (MedChemExpress, HY-W008646) or vehicle control (DMSO). For tyrosine supplementation, synchronized animals were placed on plates seeded with OP50 (or HT115 for RNAi experiments) and supplied with either tyrosine (Sigma-Aldrich, T8566) or the corresponding vehicle control (HCl). BH2 or tyrosine treatments were applied starting on day 1 of adulthood and continued until sample collection or maintained throughout adulthood for lifespan assays. Human cells were treated for 3 days with BH2 or tyrosine at the concentrations specified in the corresponding figures.
Human cell lines
HEK293T/17 cells (American Type Culture Collection (ATCC), CRL-11268) were plated onto 0.1% gelatin-coated plates and maintained in DMEM (Thermo Fisher Scientific, 11966025), supplemented with 10% FBS (Thermo Fisher Scientific, 10500064), 1% GlutaMAX (Life Technologies, 35050038) and 1% MEM non-essential amino acids (Thermo Fisher Scientific, 11140035) under standard conditions (37 °C, 5% CO2). Isogenic control iPS cells (FUSWT/WT) and ALS iPS cells (FUSP525L/P525L) were provided by I. Bozzoni and A. Rosa. Both iPS cell lines were established and characterized for pluripotency in ref. 70. In brief, control iPS cells were derived from a healthy donor and verified not to contain mutations in FUS. ALS iPS cells were generated from control iPS cells using transcription activator-like effector nuclease (TALEN)-directed mutagenesis and carry the homozygous FUSP525L mutation associated with severe ALS70. The identity of both iPS cell lines was authenticated in our laboratory by short-tandem-repeat profiling in a previous publication71. The iPS cell lines used in the present study were thawed directly from frozen stocks of these authenticated lines. iPS cells were cultured on Geltrex (Thermo Fisher Scientific, A1413302) in mTeSR1 medium (StemCell Technologies, 85850) at 37 °C with 5% CO2. Undifferentiated iPS cell colonies were passaged using 2 mg ml−1 dispase (StemCell Technologies, 07913), followed by mechanical dissociation with a glass pipette. All of the cell lines were routinely tested for mycoplasma contamination, and no contamination was detected.
Motor neuron differentiation
Motor neurons were derived from iPS cell lines according to a monolayer-based differentiation protocol72. iPS cells were seeded on Geltrex-coated plates and cultured in mTeSR1 medium until confluent. We then initiated the differentiation induction with neuron differentiation medium composed of DMEM/F12 and Neurobasal (1:1; Thermo Fisher Scientific, 11330057 and 21103049), supplemented with GlutaMAX (Thermo Fisher Scientific, 35050038), non-essential amino acids, B27 (Thermo Fisher Scientific, 12587010) and N2 (Thermo Fisher Scientific, 17502048). From day 0 to day 6, the medium was further supplemented with 1 μM retinoic acid (Sigma-Aldrich, R2625), 1 μM smoothened agonist (SAG; Sigma-Aldrich, 566661), 10 μM SB-431542 (Miltenyi Biotec, 130-105-336) and 0.1 μM LDN-193189 (Miltenyi Biotec, 130-103-925). From day 7 to day 14, neuron differentiation media were supplemented with 1 μM retinoic acid, 1 μM SAG, 4 μM SU-5402 (Sigma-Aldrich, SML0443) and 5 μM DAPT (Sigma-Aldrich, D5942). After day 14, differentiated motor neurons were dissociated and replated on poly-l-ornithine (Sigma-Aldrich, P3655) and laminin-coated (Thermo Fisher Scientific, 23017015) plates in Neurobasal medium, supplemented with non-essential amino acids, GlutaMAX, N2, B27 and neurotrophic factors (10 ng ml−1 BDNF (BIOZOL, 450-02) and 10 ng ml−1 GDNF (BIOZOL, 450-10)).
Transfection of HEK293 human cells
HEK293T/17 cells (ATCC, CRL-11268) were seeded onto plates coated with 0.1% gelatin. Once cultures reached approximately 40% confluence, the cells were transfected with 1 μg of one of the following plasmids using FuGENE HD (Promega), according to the manufacturer’s protocol: CMV:mRFP-Q7433,34, pLVX-Puro-TDP-43-WT, pLVX-Puro-TDP-43-A382T, pcDNA3.1-FUS-HA-WT, or pcDNA3.1-FUS-HA-P525L. The cells were then treated with 10 µM BH2 or vehicle control (DMSO) and lysed after 72 h of incubation in standard growth medium. The FUS-HA plasmids were provided by D. Dormann73, and the pLVX-Puro-TDP-43 vectors were provided by S. Ferguson (Addgene, 133753 and 133756)74.
Lentiviral infection of HEK293 human cells
Lentivirus (LV) non-targeting short hairpin RNA (shRNA) and LV CCT2 shRNA (TRCN0000029499)30 in the pLKO.1-puro backbone were obtained from Mission shRNA (Sigma-Aldrich). The target sequence of the CCT2 shRNA construct, previously validated in ref. 30, is provided in Supplementary Table 8. To generate stable shRNA-expressing HEK293 cell lines, cells were transduced with 5 µl of concentrated lentivirus and selected with 2 µg ml−1 puromycin (Thermo Fisher Scientific, A1113803).
Immunocytochemistry
Cells were fixed with 4% paraformaldehyde in PBS for 20 min, followed by permeabilization with 0.2% Triton X-100 in PBS for 10 min and blocking with 3% BSA in 0.2% Triton X-100 in PBS for 10 min. Cells were then incubated with anti-MAP2 (Sigma-Aldrich, M1406, 1:300) and rabbit anti-cleaved caspase-3 (Cell Signaling Technology, 9661S, 1:300) for 2 h at room temperature. After washing with PBS, the cells were incubated with secondary antibodies (Alexa Fluor 488 goat anti-mouse (Thermo Fisher Scientific, A-11029, 1:500) and Alexa Fluor 568 F(ab′)2 fragment of goat anti-rabbit IgG (H+L) (Thermo Fisher Scientific, A-21069, 1:500)) together with Hoechst 33342 (Life Technologies, 1656104) for 1 h at room temperature. The coverslips were then rinsed in PBS, followed by a distilled water wash, and mounted onto microscope slides using FluorSave Reagent (Merck, 345789).
Filter trap and western blotting
For filter trap and corresponding western blot assays, age-synchronized adult C. elegans were collected, washed with M9 buffer and snap-frozen in liquid nitrogen. The frozen pellets were thawed on ice and lysed in a non-denaturing buffer (50 mM HEPES (pH 7.4), 150 mM NaCl, 1 mM EDTA, 1% Triton X-100, 2 mM sodium orthovanadate, 1 mM PMSF, protease inhibitor cocktail (Roche)) using a Precellys 24 homogenizer. Lysates were cleared of worm debris by centrifugation (8,000 g, 5 min, 4 °C) and protein concentrations were measured using the BCA assay (Thermo Fisher Scientific). For western blot analysis, 30 μg of total protein was resolved by SDS–PAGE and transferred onto PVDF membranes (Millipore). For filter trap analysis, 100 μg of protein was supplemented with SDS to a final concentration of 0.5% SDS and loaded to a cellulose acetate membrane mounted in a slot-blot apparatus (Bio-Rad). After washing with 0.2% SDS, SDS-resistant aggregates were detected by immunoblotting. For immunoblotting analysis in C. elegans, including both filter trap and western blot assays, we used anti-IFB-2 (Developmental Studies Hybridoma Bank, MH33, 1:1,000) and anti-GFP (AMSBIO, TP401, 1:5,000) antibodies. Western blots were additionally probed using antibody against α-tubulin loading control (Sigma-Aldrich, T6199, 1:5,000).
For analysis of CAT-4 levels in AID strains, synchronized populations of C. elegans grown on E. coli OP50 were collected at late-L4/young adult stage after auxin treatment, washed three times with M9 buffer and snap-frozen in 1× SDS sample buffer supplemented with DTT. The samples were then thawed, heated at 90 °C for 5 min, dissociated using a Precellys homogenizer and centrifuged at 15,000 rpm for 15 min at 22 °C. The supernatants were collected and proteins were separated on 5–10% Bis-Tris gels before transfer to a nitrocellulose membrane (Amersham Protran, Cytiva). Membranes were blocked for 1 h at room temperature with 1× ROTI Block in TBS, and incubated for 1 h at room temperature with anti-Flag M2-HRP mouse (Sigma-Aldrich, A8592, 1:10,000) or anti-α-tubulin mouse (Sigma-Aldrich, T6074, 1:5,000). Membranes probed with anti-α-tubulin were incubated with goat anti-mouse IRDye 800CW secondary antibody (Li-Cor, 926-322101:10,000) for 1 h at room temperature. After three washes with TBS-T, membranes were imaged using a ChemiDoc Imaging System (Model MP, Bio-Rad).
For filter trap and western blot analyses of HEK293 cells, the cells were lysed in buffer containing 50 mM HEPES (pH 7.4), 150 mM NaCl, 1 mM EDTA, 1% Triton X-100, 2 mM sodium orthovanadate, 1 mM PMSF and protease inhibitors, followed by homogenization through a 27-gauge needle. Lysates from cells expressing mRFP-Q74 were cleared at 8,000g for 5 min at 4 °C. Lysates from cells expressing FUS-HA-WT, FUS-HA-P525L, pLVX-Puro-TDP-43-WT or pLVX-Puro-TDP-43-A382T were centrifuged at 1,000g for 5 min at 4 °C. Protein concentrations were determined by BCA assay. For western blotting, 30 μg of protein was analysed. For filter trap analyses, 100 μg of total protein was brought to 0.5% SDS and loaded onto cellulose acetate membranes as described above, followed by washing in 0.2% SDS and immunoblot detection of SDS-resistant aggregates. For immunoblotting in filter trap and western blot experiments, HEK293 lysates were probed using antibodies against mCherry (Abcam, ab167453, 1:5,000), FUS (Abcam, ab154141, CL0190, 1:1,000), TDP-43 (Abcam, ab225710, 1:1,000), anti-LC3B (Sigma-Aldrich, L7543, 1:1,000), anti-CCT2 (Abcam, ab92746, 1:1,000) and β-actin (Abcam, 8226, 1:5,000).
For necroptosis analysis, iPS-cell-derived motor neurons were lysed in RIPA buffer (50 mM Tris-HCl (pH 7.4), 150 mM NaCl, 1% Triton X-100, 0.1% SDS, 1% sodium deoxycholate, 1 mM PMSF, 1 mM EDTA and protease inhibitor cocktail). Immunoblotting was performed with anti-phospho-RIP (Ser166) (Cell Signaling Technology, 65746, D1L3S, 1:1,000), anti-RIP (Cell Signaling Technology, 3493, D94C12, 1:1,000) and β-actin (Abcam, 8226, 1:5,000) antibodies.
Densitometry of filter trap and western blot experiments was performed using ImageJ (v.1.51s). For quantification of filter trap and western blot data, we present the results as relative changes compared with the corresponding control conditions. To average and statistically analyse independent experiments for these assays, we normalized test conditions to their corresponding control groups measured concurrently in each replicate experiment. Statistical analysis was performed using GraphPad Prism (v.10.6.0). Gel source data are provided in Supplementary Fig. 1.
MitoSOX staining
HEK293 cells were incubated with 1 μM MitoSOX Red superoxide indicator (Invitrogen, M36008) and Hoechst 33342 (Life Technologies, 1656104) in HBSS containing calcium and magnesium for 30 min at 37 °C in the dark. After incubation, cells were washed three times with HBSS containing calcium and magnesium, mounted onto microscope slides and imaged for subsequent analysis.
Proteasome activity
C. elegans were lysed in proteasome activity assay buffer (50 mM Tris-HCl, pH 7.5, 10% glycerol, 0.5 mM EDTA, 5 mM MgCl2, 2 mM ATP and 1 mM dithiothreitol) using a Precellys 24 homogenizer (Bertin Technologies). Human cells were collected in the same buffer and lysed by passage through a 27-gauge needle attached to a 1 ml syringe 10 times. Lysates were centrifuged at 10,000g for 10 min at 4 °C. For each sample, 25 μg of total protein was transferred to a 96-well microplate (BD Falcon) and incubated with the fluorogenic trypsin-like proteasome substrate Ac-Arg-Leu-Arg-AMC (Enzo, BWL-AW9785-0005). Fluorescence generated by substrate cleavage (excitation, 380 nm; emission, 460 nm) was monitored using a microplate fluorometer (EnSpire, PerkinElmer) every 5 min for 2 h (worm lysates) or 1 h (human cell lysates). Proteasome activity was quantified as the slope of fluorescence accumulation over time. For comparisons across independent experiments, slope values were normalized to the corresponding control condition within each experiment before statistical analysis.
Reporting summary
Further information on research design is available in the Nature Portfolio Reporting Summary linked to this article.