
Chemicals and reagents
Fucoidan from F. vesiculosus (Sigma-Aldrich, F8190, lot no. 0000485452) was used as the primary substrate throughout this study. Additional F. vesiculosus fucoidans were obtained from Marinova (FVF2021547) and Biosynth (YF57714). Fucoidans from other species were sourced from Fucus serratus (Biosynth, YF09360), Fucus evanescens (OceanBasis and extracted as described previously60), Cladosiphon okamuranus (Biosynth, YF146834), Durvillaea potatorum (Biosynth, YF157165), Ecklonia maxima (Biosynth, YF157166) and Laminaria hyperborea (TheFucoidanStore, LowEndo Fucoidan). For derivatization, 1-phenyl-3-methyl-5-pyrazolone (PMP) was obtained from Sigma-Aldrich (M70800). Internal standards for LC–MS analysis included d-galactose-13C6 (Sigma-Aldrich, 605379), d-mannose-13C6 (Sigma-Aldrich, 592994) and PMP-[d5] (CAS 1228765-67-0), custom-synthesized by BOC Sciences (Shirley). LC–MS-grade solvents and reagents were acetonitrile (Honeywell), methanol (Honeywell), ethanol (Sigma-Aldrich), formic acid (Sigma-Aldrich) and ammonium formate (Merck). Ultrapure water was produced using a Q-POD system (Merck). Unless otherwise stated, all other chemicals were of analytical grade and sourced from Sigma-Aldrich.
Bacterial growth media
Throughout this study, three distinct media detailed in Supplementary Table 1 were used for (1) enrichment of bacteria, (2) isolation of bacteria on solid medium and (3) routine cultivation of bacterial isolates in MBL medium52. All media mimicked the ionic composition of coastal seawater and contained 340 mM NaCl, 15 mM MgCl2, 6.75 mM KCl and 1 mM CaCl2. The pH was buffered to 8.0 with either bicarbonate in the enrichment and plate media or 50 mM HEPES in the MBL medium. Nutrients were ammonium chloride, sodium phosphate, sodium sulfate, trace metal mix and vitamin mix52. Enrichment medium contained 0.02% (w/v) fucoidan from F. vesiculosus. Solid medium was prepared with 2% (w/v) carrageenan (Sigma C1013) and a mix of carbon sources (acetate, citrate, xylose, galactose, mannose, glucose, fucose, cellobiose and tryptone) at 0.002% (w/v) each. Bacterial isolates were routinely cultured in MBL medium with carbon sources specific to their metabolic requirements. Verrucomicrobiota degraders were routinely grown with 0.2% (w/v) fucoidan from F. vesiculosus. Other degraders (Flavobacteriia and Gammaproteobacteria) and exploiters were grown on a mix of 0.2% (w/v) l-fucose and 0.2% (w/v) fucoidan from F. vesiculosus. Scavengers were grown in a mix of carbon sources (acetate, citrate, xylose, galactose, mannose, glucose, fucose, cellobiose and tryptone) at 0.02% (w/v) each.
Enrichment of fucoidan-degrading communities
Surface seawater was collected on 30 March 2019 from a rocky shoreline covered with the brown algae F. vesiculosus, Ascophyllum nodosum and Saccharina latissima near the Marine Science Center of Northeastern University (Canoe Beach, Nahant, MA, USA; 42° 25′ 10.8732″ N, 70° 54′ 25.686″ W). The seawater was pre-filtered through a 10-μm PTFE membrane filter (Millipore, JCWP04700) and diluted 1:100 to inoculate three replicate enrichment cultures (25 ml each) containing 0.02% (w/v) F. vesiculosus fucoidan in 150 ml glass bottles sealed with rubber stoppers. Cultures were incubated at 20 °C in the dark and agitated at 50 rpm.
Enrichment cultures were monitored every 24–48 h for microbial growth (OD600) and fucoidan degradation, quantified via the phenol–sulfuric acid method61. For each measurement, 200 µl of culture was mixed with 1 ml of concentrated sulfuric acid and 200 µl of 5% (v/v) phenol, then incubated at 50 °C for 20 min. Absorbance was measured at 490 nm and fucoidan concentration was determined using an external standard curve of fucose. After 10 days, cultures reached 40–60% degradation of the initial fucoidan, at which point serial growth–dilution cycles were initiated by transferring 1:50 into freshly prepared medium every 2 days for a total of 12 cycles. At every second time point, 10 ml of culture was filtered onto a 0.22 μm Sterivex filter (Millipore, SVGPB1010) for DNA extraction using the DNeasy Blood & Tissue Kit (Qiagen) and subsequent metagenomic sequencing. Final enrichment communities were cryopreserved at −80 °C with 15% (v/v) glycerol.
Isolation of bacterial strains
From each enrichment culture, cells were enumerated using a counting chamber by light microscopy. Aliquots corresponding to 102, 103 and 104 cells were plated in triplicate onto solid medium in 150 mm Petri dishes (VWR 391-0616) and incubated for 14 days at ambient temperature in the dark. A total of 768 colonies were picked and re-streaked at least 3 times until only a single colony morphotype was observed. Colonies were lysed in 0.1% (v/v) Triton X-100 in TE buffer for Sanger sequencing of the 16S rRNA gene. Pure isolates were grown in MBL medium with a mix of carbon source and cryopreserved at −80 °C in 15% (v/v) glycerol. To de-replicate repeatedly isolated strains, we selected 96 isolates based on their 16S sequences for genomic DNA extraction using the DNAadvance kit (Beckman Coulter) and draft genome sequencing. To identify redundant isolates, pairwise average nucleotide identity (ANI) was computed using OrthoANIu v1.262 yielding 28 unique bacterial strains. We additionally included the characterized degrader ‘Lentimonas’ sp. CC4 as Verruco4 in the isolate collection3 resulting in a total of 29 strains in the isolate collection.
Sequencing of metagenomes and isolate genomes
All sequencing work was carried out in collaboration at the BioMicroCenter at MIT. Metagenomes of enrichment cultures were sequenced with an Illumina NovaSeq6000 S4 flow cell with 150 nt paired-end reads. Metagenomes were assembled using SPAdes v3.13.063 with the parameters –meta –only-assembler -k 21,33,55,77. MAGs were reconstructed using CONCOCT v1.0.064, MaxBin v2.2.765 and DAS Tool v1.1.266 with default settings. Draft genomes of isolates were sequenced on an Illumina NextSeq 500 platform (150 nt paired-end reads, ~200× coverage) and assembled using SPAdes v3.13.0 with the parameters –only-assembler -k 21,33,55,77 –careful. To generate closed genomes for selected degraders (Flavo12, Flavo40, Flavo56, Flavo94, Gamma88, Verruco25 and Verruco69), genomic DNA was extracted from 1 ml of culture using the DNeasy Blood & Tissue Kit (Qiagen). Long-read sequencing was performed on Nanopore PromethION FLO-PRO002 flow cells. Hybrid assemblies combining Illumina short reads and Nanopore long reads were generated using Unicycler v0.4.867 with the parameters –keep 3 –mode normal –min_fasta_length 1000 –kmers 77, yielding circularized genome assemblies. Completeness and contamination of MAGs was assessed using CheckM v1.1.268 resulting in a total of 73 medium and high-quality genomes69 summarized in Supplementary Table 2. Taxonomic classification and phylogenetic reconstruction of isolate and metagenome-assembled genomes were performed using GTDB-Tk v2.0.070 (release 202).
Annotation of bacterial genomes
Open reading frames were predicted and annotated with DRAM v1.2.471. CAZymes were identified by HMMER72 v3.3 with hidden Markov models from the dbCAN database73 (dbCAN-HMMdb-V10). HMM hits were validated via Diamond74 (v0.9.14.115; blastp mode, –more-sensitive) against the CAZy database (accessed September 2022), retaining only matches with bit scores >100. Sulfatases were identified by hmmsearch against PF00884 (sulfatase domain), using an e-value threshold of <10−4 and a minimum alignment length of 100 amino acids. Sulfatases were further classified into subfamilies based on Diamond (v0.9.14.115; blastp mode, –more-sensitive) against the SulfAtlas v1.2. database75.
Classification of genomes into metabolic roles
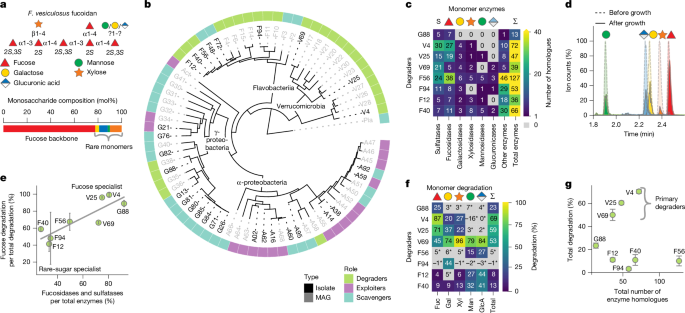
We classified genomes into three metabolic roles, degraders, exploiters and scavengers, based on the presence or absence of key enzymes involved in fucoidan and l-fucose metabolism. Degraders were defined as genomes encoding at least five enzymes from a curated set of ten families of fucoidanase families3, comprising glycoside hydrolases (GH29, GH95, GH141, GH107 and GH168) and sulfatases (S1_15, S1_16, S1_17, S1_22 and S1_25). Exploiters lacked fucoidanases but encoded one of two alternative l-fucose catabolic pathways described in MetaCyc57: l-fucose degradation I or l-fucose degradation II. For each pathway, genomes were required to encode at least 75% of the constituent enzymes. For pathway I, this included: K07248 (lactaldehyde dehydrogenase), K02431 (l-fucose mutarotase), K00879 (l-fuculokinase), K01818 (l-fucose/d-arabinose isomerase) and K01628 (l-fuculose-phosphate aldolase). For pathway II, this included: K18333 (l-fucose dehydrogenase), K18334 (l-fuconate dehydratase), K18335 (2-keto-3-deoxy-l-fuconate dehydrogenase), K07046 (l-fuconolactonase), K18336 (2,4-didehydro-3-deoxy-l-rhamnonate hydrolase) and K01685 (altronate hydrolase). Scavengers were defined as genomes lacking all enzymes associated with both fucoidan degradation and l-fucose catabolism.
Identification of fucoidan PULs
We searched closed genomes of cultured fucoidan degraders for candidate PULs using a sliding 12-gene window. Regions containing at least four CAZyme genes were flagged and those encoding two or more known fucoidanases (GH29, GH95, GH141, GH107, GH168, S1_15, S1_16, S1_17, S1_22 or S1_25) were retained as putative fucoidan PULs. To avoid misclassification, we manually curated these loci and removed those likely involved in the degradation of other polysaccharides—specifically, five loci from Flavobacteriia containing carrageenanases (GH16, GH82, GH150 and GH167). The final curated set comprised 34 fucoidan-associated PULs spanning 54 CAZyme families (Supplementary Table 3).
Definition and comparison of fucoidan enzyme repertoires
For each degrader, the fucoidanase repertoire was defined as (1) all CAZymes and sulfatases within fucoidan PULs and (2) additional chromosomal genes belonging to enzymes families that target sulfated fucose (GH29, GH95, GH141, GH107, GH168, S1_15, S1_16, S1_17, S1_22 or S1_25) or that are predicted to act on rare sugars (GH30, GH31, GH36, GH39, GH92, GH97, GH115 and GH120). For the characterized degrader3, Lentimonas sp. CC4, only enzymes that were upregulated at the protein level during growth on F. vesiculosus fucoidan were included, specifically those in co-expression clusters 2–6.
To sort the sequence diversity into homologous groups of enzymes, we clustered all fucoidan-associated CAZymes using MMseqs2 v13.45111 (easy-cluster with –min-seq-id 0.6 -c 0.5 –cov-mode 0)76. This defined enzyme homologues at a threshold of ≥ 60% amino acid identity ≥ 50% alignment coverage for both query and target sequences. These clusters formed the basis for showing counts of enzyme families and comparing enzyme repertoires across isolates and pairwise similarities were calculated using the Jaccard index.
To explore how enzymatic diversity scales with community size, we performed a rarefaction analysis. In each of 10,000 iterations, we randomly selected n degrader strains (n = 1–29), counted the number of unique enzyme clusters, and estimated the expected total richness using the Chao1 estimator.
Refined functional annotation of fucoidan-active CAZymes
The activities of fucoidan-associated enzymes found in isolated degraders were inferred by comparison to characterized CAZymes in the CAZy database (accessed March 2026) using Diamond (v0.9.14.115; blastp mode, –more-sensitive). For each domain, the top-scoring hit was used to assign putative function and EC number, where available. Proteins containing multiple catalytic domains were annotated at the domain level. Annotation confidence was defined as high (≥ 70% identity and ≥70% coverage), medium (≥ 30% identity and ≥50% coverage) and otherwise retained as family-level assignments.
Enzymes were then assigned to coarse-grained activity classes when the inferred EC number, CAZyme family or closest characterized homologue indicated an activity compatible with known fucoidan linkage chemistry. These classes included fucose-, galactose-, mannose-, xylose- and glucuronic acid-targeting activities. Specifically, GH107, GH141 and GH168 were classified as endo-acting fucoidanases; GH29 and GH95 as exo-α-l-fucosidases; GH36 and GH97 as α-galactosidases; GH2 as β-galactosidases; GH92 as α-mannosidases; GH115 as α-glucuronidases; and GH31, GH39, GH120 and GH30 as α-/β-xylosidases. Enzyme families without support for an activity on known fucoidan residues were classified as hypothetical. All inferred activities, EC numbers and annotation confidence levels are reported in Supplementary Table 3.
Phylogenetic validation of representative families was performed using MAFFT (L-INS-i; –localpair –maxiterate 100) for alignment, trimAl (-gt 0.1) for trimming and FastTree (LG + Γ model) for tree inference.
Characterization of fucoidan-degrading abilities in monoculture
Substrate utilization and fucoidan-degrading capabilities of all 29 isolates were assessed by growth assays on defined carbon sources. Strains were revived from glycerol stocks in 3 ml MBL medium for 3–6 days using carbon sources matched to their metabolic requirements. Cultures were subsequently washed in carbon-free MBL medium and inoculated into 200 μl of fresh medium supplemented with a single carbon source at 0.2% (w/v), including l-fucose, d-galactose, d-mannose, d-xylose, d-glucuronic acid, or fucoidan from F. vesiculosus. Cultivations were performed in biological triplicates (n = 3) at 20 °C with orbital shaking (200 rpm) in 96-well microtiter plates (flat-bottom, polystyrene; Corning). Growth was monitored by OD600 measurements over 5 days using a Tecan Sunrise plate reader. To quantify fucoidan degradation, cultures grown on fucoidan were sampled at the final time point in early stationary phase. Cell-free supernatants were obtained by centrifugation (2,200 rpm for 10 min), remaining fucoidan was hydrolysed and quantified as described below.
For time-resolved characterization, the eight degraders were cultivated in 4 ml MBL medium supplemented with fucoidan from F. vesiculosus in 24-deep-well plates (Eppendorf) sealed with breathable lids (Kuhner) and sampled throughout growth. At each time point, supernatants were collected and analysed to quantify both fucoidan-derived monomers following acid hydrolysis and free extracellular monosaccharides.
Acid hydrolysis of fucoidan in supernatants
To quantify the decrease of fucoidan-bound monomers after growth, acid hydrolysis was used to cleave the glycosidic linkages of fucoidan remaining in culture supernatants releasing its monomer constituents. Sampled supernatants (5 μl) were mixed with 45 μl of ddH2O and 50 μl of 2 M HCl. The HCl solution contained d-galactose-13C6 and d-mannose-13C6 at 15 μM each that were later used as ‘processing internal standards’ to correct technical variability introduced by the sample processing workflow. PCR plates with samples were sealed with plastic strips (Thermo Fisher Scientific AB0600 and AB0784). Acid hydrolysis was carried out for 24 h at 100 °C in an oven using a custom clamping device to prevent leakage from plates. After hydrolysis, samples were neutralized by addition of 4 M NaOH.
Derivatization of monosaccharides with PMP
Acid hydrolysates (10 μl sample and 15 μl ddH2O) or free monosaccharide samples (25 μl sample) were derivatized with 75 μl of 0.1 M PMP in 2:1 methanol:ddH2O with 0.4 M ammonium hydroxide for 100 min at 70 °C following a previously published protocol47. For absolute quantification, we used an external calibration curve of a standard mix containing glucuronic acid, xylose, fucose, galactose, mannose ranging from 1 mM to 200 nM prepared in a matrix identical to samples. After derivatization, samples and standards were neutralized with 2 M HCl and diluted 1:50 in 0.1% (v/v) formic acid in ddH2O containing 50 nM of injection internal standards, which was used to correct variations in ionization efficiency caused by the ion source of the mass spectrometer. These internal standards consisted of a mix of glucuronic acid, xylose, fucose, galactose, mannose derivatized with heavy labelled PMP-[d5] yielding unique masses distinct from unlabelled PMP.
Targeted acquisition of PMP derivatives with LC–MS
PMP derivatives were measured on a SCIEX qTRAP5500 and an Agilent 1290 Infinity II LC system. The system was equipped with a Waters CORTECS UPLC C18 Column, 90 Å, 1.6 μm, 2.1 mm × 50 mm reversed phase column with guard column and 0.2 μM inline filter. The mobile phase consisted of buffer A with 10 mM NH4Formate in ddH2O and 0.1% (v/v) formic acid and buffer B with 100% acetonitrile and 0.1% (v/v) formic acid. PMP derivatives were separated by an initial isocratic flow of 13% buffer B for 30 s, followed by a binary gradient from 13% to 36% Buffer B over 2 min, followed by a 30 s wash step with 100% buffer B and 30 s re-equilibration. The flow rate was constant at 0.5 ml min−1 with a constant pressure around 430 bar. A diverter valve was used to redirect the first 1.5 min of chromatography to waste. The temperature of the column compartment was maintained at 40 °C and the autosampler was cooled to 10 °C. The ESI source settings were 625 °C, with curtain gas set to 30, collision gas to medium, ion spray voltage to 5500 and ion source gas 1 and 2 to 90 (arbitrary units).
Data were acquired using multiple reaction monitoring with previously optimized transitions and collision energies in positive mode46. For example, a galactose derivative has an exact Q1 mass of 511.2 m/z and was fragmented with a collision energy of 35 V to yield the quantifier ion of 175.0 m/z and the diagnostic fragment of 217.2 m/z. All multiple reaction monitoring transitions and retention times used to identify compounds are listed in Supplementary Table 4.
Typically, each run included 150–250 samples, with randomized injection order. For quality control (QC) samples, we used the highest concentrated standard mix. QC samples and a water blank were injected every 15 samples to monitor consistency and carryover. Calibration curves were prepared in triplicate and each sample was analysed in technical duplicates. Guard columns and inline filters were replaced every 500 to 1,000 injections.
Absolute quantification of monosaccharides
Chromatographic data were analysed using Skyline77 v24.1.0.414, with peak areas integrated using default settings and exported for downstream quantification in Python. A reproducible example workflow is provided under https://github.com/EnvSysMicroLAB/Sichert2025_Fucoidan. In brief, peak areas of target compounds and 13C-labelled processing standards were first corrected using the injection internal standards. Subsequently, the corrected 13C processing standards were used to normalize the target compound signals. Absolute concentrations of monomers were determined by linear regression against external calibration curves and technical duplicates were averaged to obtain final concentrations.
Quantification of monomer degradation
To quantify fucoidan degradation at the monomer level, concentrations of the five constituent sugars—fucose, glucuronic acid, galactose, mannose and xylose—in culture supernatants were compared to an uninoculated medium control processed in parallel. Notably, the concentrations of ‘rare’ monomers are calculated from the sum of the four non-fucose sugars, while ‘total’ monomers represent the sum of all five monomers. Degradation f of a given monosaccharide i (i ∈ {Fuc, GlcA, Gal, Man, Xyl, Rare, Total}) by strain or strain combination j, was quantified as:
$${f}_{i,j}=100\times \frac{{[{\rm{S}}]}_{i,{\rm{c}}{\rm{o}}{\rm{n}}{\rm{t}}{\rm{r}}{\rm{o}}{\rm{l}}}-{[{\rm{S}}]}_{i,j}}{{[{\rm{S}}]}_{i,\text{control}}}$$
(1)
where [S]i,control is the concentration in the uninoculated control and [S]i,j is the concentration after growth of strain j and fi,j is the relative monomer degradation.
For every strain–monomer combination, we tested whether the observed decrease in concentration exceeded abiotic background using a one-sided t-test (alternative = “less”). Resulting P values were corrected for multiple comparisons using the Benjamini–Hochberg false discovery rate (FDR) procedure (α = 0.01). Degradation was considered significant when both the raw P values and the FDR-adjusted q were <0.01. Throughout this study, we generated seven distinct datasets, with monosaccharide concentrations and corresponding statistical analyses reported in Supplementary Table 4. Unless otherwise stated, all statistical analyses of degradation data involving Pearson correlation coefficients and associated P values were performed using replicate-level data from three biological replicates, without prior aggregation into means.
High-throughput community experiments
To assess the effect of biological interactions on fucoidan degradation, we performed four high-throughput growth experiments using a standardized cultivation setup. All experiments were conducted in biological triplicates (n = 3) at 20 °C with orbital shaking at 200 rpm. Glycerol stocks were revived in 3 ml of MBL medium in plastic culture tubes for 3–6 days, using carbon sources matched to the metabolic requirements described above. Revived cultures were diluted 1:5 into fresh medium in 96-deep-well plates (1.8 ml per well), each containing a 4 mm glass bead (Sigma-Aldrich, Z143936) and incubated for 18 h to reach exponential phase (OD600 = 0.15–0.3). Exponential-phase cells were washed in carbon-free MBL and used to inoculate experimental cultures at an initial OD600 of 0.01 for each strain. Experimental cultures were incubated for up to 5 days in the same deep-well plate format, sealed with breathable lids (Kuhner, 104098 and 104106). At defined time points, 100 μl of culture was sampled for OD600 measurement using a Tecan Sunrise plate reader. Samples were centrifuged at 2,200 rpm for 10 min to separate cells and supernatant; supernatants were stored at –20 °C for further analysis.
Verrucomicrobiota-centric pairwise co-cultures
To assess the influence of community members on the degradation activity of primary degraders, each of the 29 isolates was co-cultured in a 1:1 ratio (normalized by OD600) with one of the three primary degraders (V4, V25 or V69), yielding 87 distinct pairwise combinations. Cultures were incubated for 5 days and fucoidan degradation was quantified at the final time point. Growth dynamics in co-cultures were assessed using two complementary metrics: (1) total biomass, defined as the mean of the two highest OD600 values recorded during the time course and (2) apparent growth rate, calculated as the inverse of the time required to reach an OD600 threshold of 0.15 (1/tth). In co-cultures of V69 with strains F12, F40, F56 and G88, we observed aggregate formation that interfered with OD600-based biomass estimates. For these cases, we used an indirect approximation for bacterial biomass by quantifying bacterial DNA from 100 μl of culture using the DNAdvance Kit (Beckman Coulter) followed by absolute DNA quantification with the Femto Bacterial DNA Quantification Kit, according to the manufacturer’s protocol.
To identify potential synergistic or antagonistic effects in pairwise co-cultures, we compared biomass formation and fucoidan degradation to the corresponding monocultures. Differences in biomass were considered significant if both the P value and the false discovery rate (FDR, Benjamini–Hochberg correction, α = 0.01) were <0.01. Differences in degradation were considered significant if both the P value and FDR (α = 0.05) were <0.05 and the absolute log2-transformed fold change exceeded 0.1.
qPCR for strain-specific cell quantification
To determine strain-specific abundances in co-culture, 100 µl of co-cultures were sampled and subjected to two freeze–thaw cycles prior to DNA extraction using the DNAdvance Kit (Beckman Coulter, A48705). Strain-specific qPCR primers were designed against ~100-bp regions of single-copy marker genes. qPCR reactions were performed in 20 µl volumes using GoTaq qPCR Master Mix (Promega) on a QuantStudio 3 Real-Time PCR System. Primer efficiencies ranged from 95–105%, and primer specificity and quantitative recovery were assessed in defined mock communities comprising all strains at known input ratios, yielding recoveries of 90–127% (Supplementary Table 6). Absolute abundances were quantified by comparison of Ct values to strain-specific standard curves generated from serial dilutions of genomic DNA (10 ng µl−1 to 10 pg µl−1). Resulting values represent strain-specific DNA concentrations, which were used to compare relative changes between monoculture and co-culture conditions and to classify interaction outcomes48.
Synergism beyond resource partitioning
To assess synergistic interactions in pairwise co-cultures, we formulated a null model that estimates expected degradation outcomes based on monoculture performance, assuming no metabolic complementarity between strains. This model reflects a scenario in which both strains have fully overlapping substrate preferences, such that each monomer can be degraded only up to the level achieved by the better-performing monoculture. The difference between this null expectation and the observed co-culture degradation defines the synergism score σ(i,j), formally given as:
$$\sigma (i,j)={f}_{\text{total}}(i,j)-\sum _{m\in \{{\rm{F}}\text{uc},\text{Man},\text{Gal},\text{Xyl},\text{GlcA}\}}\max ({f}_{m}(i),{f}_{m}(j))$$
(2)
where f(i,j) is the total fraction of fucoidan degraded in co-culture of strains i and j, fm(i) and fm(j) are the fractions of monomer m degraded by strains i and j in monoculture. Note that all terms are expressed as stoichiometrically weighted fractions rather than raw percentages; that is, each monomer-specific contribution fm is scaled by its relative abundance in the fucoidan composition before summation. This conservative formulation avoids overestimation of expected degradation by preventing redundant contributions from metabolically similar strains. Positive values of σ(i,j) thus indicate synergism through functional complementarity, whereas negative values suggest antagonism. To determine whether observed co-culture degradation significantly deviated from the null expectation, we applied a two-sided t-test. Resulting P values were corrected for multiple comparisons using the Benjamini–Hochberg procedure, and synergism scores were considered significant if they satisfied P < 0.01, q < 0.01, and exhibited an absolute effect size greater than 5 (|σ| > 5). Notably, this framework can be extended to communities with more than two members by using the maximum monomer degradation observed in the best-performing drop-out community as the null expectation.
Cross-feeding of residual fucoidan
Partially degraded fucoidans were recovered from cultures of V4, V25 and V69 grown to late stationary phase in 1 l of MBL medium supplemented with 0.2% (w/v) fucoidan from F. vesiculosus. The sterile filtered supernatant was concentrated using an Amicon stirred ultrafiltration cell (EMD Millipore, UFSC20001) with a 1-kDa cellulose membrane (EMD Millipore, PLAC06210) on ice using nitrogen for gas pressure. Desalting was carried out by addition of ddH2O and continued concentration. Concentrated material was lyophilized.
To test how ‘secondary’ degraders could utilize the residual substrates of primary degraders, F12, F40, F56, F94, V25, V69 and V4 were grown in 1.5 ml of MBL medium containing 0.1% (w/v) of each residual fucoidan. Cultures were incubated for 4 days and degradation was quantified from supernatants collected at the final time point compared to initial concentrations.
To compare the additional degradation of residuals achieved by secondary degraders to the additional degradation observed in co-cultures, we used the relationship:
$${f}_{{\text{total},\text{residual}}_{j}}(i)={f}_{\text{total},\text{untreated}}(i,j)-{f}_{\text{total},\text{untreated}}(j)$$
(3)
Here, ftotal,residual(i) denotes the degradation of secondary degrader i on residuals of primary degrader j; ftotal,untreated(i,j) is the total degradation observed in co-culture of strains i and j on untreated fucoidan; and ftotal,untreated(j) is the degradation by strain j alone on the same substrate.
Full combinatorial degrader communities
To systematically evaluate synergistic interactions in fucoidan degradation, we constructed all 127 possible combinations of the seven degraders F12, F40, F56, F94, V25, V69 and V4, along with a no-cell negative control. Each community was assembled by mixing strains at equal optical density (OD600) at 0.01 each and inoculating into 1.8 ml of MBL medium supplemented with 0.2% (w/v) fucoidan from F. vesiculosus as the sole carbon source. Cultures were incubated for 5 days (n = 3 biological replicates), after which supernatants were collected for degradation analysis.
Modelling
To predict degradation from community composition, we developed a nonlinear trait-based model in which each bacterial strain contributes independently to the degradation of two classes of fucoidan-derived monomers: fucose and rare sugars. Each strain i was assigned two parameters (\({w}_{i}^{{\rm{Fuc}}}\) and \({w}_{i}^{{\rm{Rare}}}\)) representing its degradation capacity for these monomer types. For a given community composed of m strains, represented by a presence/absence vector xi ∈ {0,1}, the total effective capacity to degrade each monomer pool was computed as the sum of contributions from all present strains:
$${C}^{\text{Fuc}}=\mathop{\sum }\limits_{i=1}^{m}{w}_{i}^{\text{Fuc}}\times {x}_{i}$$
(4)
To capture the saturating behaviour observed in experimental data, we applied a Hill function to these summed capacities, introducing nonlinearity and a threshold-like response:
$${D}^{\text{Fuc}}=\frac{{({C}^{\text{Fuc}})}^{n}}{{K}_{{\rm{m}}}^{n}+{({C}^{\text{Fuc}})}^{n}}$$
(5)
$${D}^{\text{Rare}}=\frac{{({C}^{\text{Rare}})}^{n}}{{K}_{{\rm{m}}}^{n}+{({C}^{\text{Rare}})}^{n}}$$
(6)
Here, \({K}_{{\rm{m}}}^{n}\) is the half-saturation constant and n is the Hill coefficient, both shared across the two monomer classes. The resulting values DFuc and DRare represent the predicted fraction of each monomer pool degraded by the community.
Experimental degradation values of 127 communities were used to fit the model parameters: one degradation capacity per strain and per monomer pool (\({w}_{i}^{{\rm{Fuc}}}\) and \({w}_{i}^{{\rm{Rare}}}\)) and shared parameters \({K}_{{\rm{m}}}^{n}\) and n. Model parameters were inferred by minimizing the root mean squared deviation between predicted and observed degradation. Optimization was performed in Julia using the LsqFit.jl package. Initial and final parameter values, as well as their effect on model fit are shown in Extended Data Fig. 9a–c. Goodness-of-fit was assessed via visual comparison and R2 statistics (Extended Data Fig. 9d). All code and data used in model construction and fitting are available here https://github.com/EnvSysMicroLAB/Sichert2025_Fucoidan.
Degradation of diverse fucoidans
To evaluate the degradation capabilities of individual degraders across diverse fucoidans, we assembled a panel of eight additional brown algal fucoidans. These included fucoidans derived from six brown algal species selected for their differences in composition and structure, as well as two variants of F. vesiculosus sourced from two different vendors. The latter were included to capture subtle compositional and structural variations suspected to arise from differences in sampling time, sampling season and extraction method6,33.
For community experiments, degraders were grouped to minimize redundant combinations and maximize functional complementarity: Group A (V25, V4 and F56), Group B (F12, F40 and F94) and Group C (V69). These groups were tested individually, in all pairwise combinations and as a triplet (seven configurations total). Each community was inoculated with equal OD600 contributions from each strain into 1.8 ml of MBL medium containing 0.2% (w/v) of 1 of the 8 fucoidans and incubated for 5 days (n = 3). Degradation was quantified by full monosaccharide analysis and monosaccharide-specific depletion was calculated as described above (equation (1)). These data—63 community–substrate combinations—were used to validate the model with out-of-sample predictions. To account for variability in monosaccharide composition across polymers, the contribution of each monomer to total degradation was weighted by its relative abundance in the polysaccharide.
To account for potential co-extracted polysaccharides, we performed full monosaccharide profiling using an extended 10 min LC–MS method resolving 21 monosaccharides. Acid hydrolysis, PMP derivatization, internal controls and data processing were performed as described above. Chromatographic separation differed only in the gradient, with an initial isocratic hold at 15% buffer B for 2.0 min, followed by a linear gradient from 15% to 20% buffer B over 5.5 min, a rapid increase to 100% buffer B at 7.5 min, a 1 min wash step at 100% buffer B, and re-equilibration to initial conditions until 9.5 min at a constant flow rate of 0.5 ml min−1 and a column temperature of 50 °C. The standard mix comprised fucose, galactose, xylose, mannose, glucuronic acid, glucose, mannuronic acid, guluronic acid, rhamnose, glucosamine, galactosamine, gulose, allose, idose, galacturonic acid, lyxose, ribose, arabinose, iduronic acid, talose and altrose, prepared in matrix-matched conditions across a concentration range of 100 nM to 500 µM. Monosaccharide concentrations were converted to anhydro-corrected masses to approximate polysaccharide yields and sulfate content was inferred from literature-reported weight fractions using the fucoidan-associated monosaccharide pool. This enabled a quantitative mass balance for each fucoidan, yielding estimates of total hydrolysable carbohydrates and unaccounted fractions (Supplementary Table 9).
Heterologous enzyme expression and purification
The protein-coding sequences of 17 glycoside hydrolases, omitting their native signal peptides78, were codon-optimized, synthesized, and cloned into the pET-28a(+) expression vector harbouring an N-terminal 6×His-tag by Twist Bioscience. The resulting plasmids were transformed into BL21(DE3) competent Escherichia coli (New England Biolabs) according to the manufacturer’s instructions. Expression strains were cultured in 200 ml of Luria-Bertani (LB) medium supplemented with kanamycin at 37 °C until an OD600 of 0.8 was reached. Protein expression was induced by the addition of 0.1 mM isopropyl β-d-1-thiogalactopyranoside (IPTG), followed by incubation at 12 °C for 16 h. Cells were collected by centrifugation at 3,000g for 20 min at 4 °C. Cell pellets were lysed using B-PER Bacterial Protein Extraction Reagent (Thermo Fisher Scientific). The proteins were purified from the soluble fraction by immobilized metal affinity chromatography (IMAC) using His GraviTrap TALON columns (Cytiva 29-0005-94). Columns were equilibrated in lysis buffer prior to loading. Nonspecifically bound proteins were removed by sequential washes consisting of two 10 ml washes with IMAC 20 buffer (50 mM Tris-HCl, 500 mM NaCl, 5% glycerol, 20 mM imidazole, pH 8) and two 10 ml washes with IMAC 40 buffer (50 mM Tris-HCl, 500 mM NaCl, 5% glycerol, 40 mM imidazole, pH 8). The His-tagged enzymes were subsequently eluted using 2 ml of IMAC 200 buffer (50 mM Tris-HCl, 500 mM NaCl, 5% glycerol, 200 mM imidazole, pH 8).
Successful expression, purity, and the expected molecular weights of the 17 enzymes were assessed and confirmed by SDS-PAGE followed by Coomassie staining. In total, nine proteins were successfully expressed in the soluble fraction. These purified enzymes were dialysed overnight at 4 °C against a buffer consisting of 50 mM Tris-HCl and 500 mM NaCl (pH 8.0). Final protein concentrations were quantified using the broad-range Qubit Protein BR Assay (Thermo Fisher Scientific). Nine proteins were soluble: V25|GH97_A, V25|GH36, F56|GH39, F56|GH130, F56|GH92_C, F56|GH92_E, F56|GH115_C, V69|GH97_A and V69|GH97_B. Full construct names, accession numbers, construct sequences, molecular weights, signal peptide predictions and solubility are detailed in Supplementary Table 7.
Enzyme activity assays
All enzyme assays were performed in MBL medium supplemented with 50 mM phosphate buffer (pH 8.0) at 20 °C, using a final enzyme concentration of 5 nM. Initial functional screens were conducted on a panel of pNP-labelled substrate analogues at a concentration of 1 mM, including pNP-α-d-galactopyranoside, pNP-α-d-mannopyranoside, pNP-α-d-xylopyranoside, pNP-β-d-galactopyranoside, pNP-β-d-mannopyranoside and pNP-β-d-xylopyranoside. Enzymatic activity was quantified by monitoring the release of para-nitrophenol at 410 nm using a microplate reader.
Michaelis–Menten kinetics for F56|GH39 and V25|GH36 were determined from initial rates measured across a substrate gradient (0.1–100 mM) using pNP-labelled substrate analogues. Initial velocities were calculated from the linear phase of product formation. Kinetic parameters (Km, Vmax) were estimated by nonlinear least-squares fitting to the Michaelis–Menten equation.
To assess activity on native substrates, enzymes were incubated with 0.2% (w/v) fucoidan from F. vesiculosus and 0.1% (w/v) residual fucoidan recovered from cultures of the primary degraders V4, V25 and V69. Reactions were incubated for 24 h and released monosaccharides were quantified following PMP derivatization by LC–MS.
Distribution of fucoidan-degrading isolates
To determine the distribution of fucoidan-degrading isolates across ocean environments, we assessed their detection in global rRNA gene– and metagenome-based databases. First, 16S rRNA genes were extracted from isolate genomes using pyBarrnap v0.5.1 (evalue = 10−6, lencutoff = 0.8, reject = 0.25) and compared to the MicrobeAtlas database79, with matches defined as ≥99% sequence identity. In parallel, isolate genomes were compared to species in the mOTUs database55—a global, species-resolved collection of genomes from isolates and metagenomes—using the classify function of the mOTUs profiler, which aligns ten single-copy marker genes to representative genomes.
As the mOTUs database contains relatively few macroalgae-associated microbiome samples, we additionally compared isolates to two recent macroalgae-associated datasets. The first was an amplicon sequence variant (ASV) dataset from an annual sampling campaign of macroalgal thalli along the Roscoff coastline80; ASVs were aligned to full-length isolate 16S rRNA genes and retained if ≥99% identical. The second comprised isolate genomes and metagenome-assembled genomes from epiphytic microbiomes of macroalgae in a coastal region of China81; genomes were compared using species-level clustering with dRep v3.5.0 (−comp 50 −con 10 −sa 0.95 −nc 0.3), using a 95% ANI threshold for species-level assignment. Following the comparisons of isolates to these reference databases and recently published datasets, we extracted and combined the information on where each of the matched references has been detected from the respective resources and visualized global distributions in R v4.3.3 using ggplot2, rnaturalearth and sf packages.
Diversity and dynamics of fucoidan degrader and exploiter species across the global oceans
To investigate the distribution and dynamics of fucoidan degraders across the global ocean and assess the potential ecological relevance of synergistic degradation, we analysed species in the mOTUs database. Species-representative genomes were retrieved and restricted to those recovered from isolates or ocean metagenomes. For initial screening, representative genomes were annotated against dbCAN v1473 using HMMsearch72 (horizontal coverage >0.25; e-value < 1 × 10⁻¹⁰) and genomes encoding at least one fucoidanase GH families were retained (n = 3,692). These candidates were then subjected to a more comprehensive annotation workflow comprising Diamond74 (blastp mode) searches against CAZyDB82 and SulfAtlas75, and HMMsearch against KEGG83 and PFAM. Degrader species (mOTUs) were defined as those encoding at least five fucoidan-targeting GH and sulfatase families. For each degrader species, fucoidan degradation capacity was estimated as the number of fucoidanase genes per genome and fucoidan-degrading PULs were annotated as described in ‘Identification of fucoidan PULs’.
To provide ecological context, the distribution of degrader species was profiled across >11,000 ocean metagenomes using the profile function of the mOTUs profiler. Samples containing at least one degrader mOTUs were retained (n = 12,347). For each sample, we calculated the species diversity of detected degraders as well as their relative abundance, determined as the proportion of genomes they represented within the community.
To assess the potential prevalence of synergistic degradation across ocean environments, we analysed the per-sample heterogeneity in fucoidan degradation capacity of co-occurring degraders using two complementary approaches. First, we examined the composition of degrader-encoded fucoidan-targeting PULs in terms of enzymes repertoires targeting the sulfated fucose backbone versus targeting rare-sugar monomers. The species were subsequently grouped into quartiles based on the proportion of fucose-targeting enzymes in their PULs. In each sample, we subsequently defined potential synergistic degradation as the co-occurrence of a top and bottom quartile degrader species—that is, co-occurrence of species with fucose- and rare-sugar monomer specialized PULs. To complement this, we also assessed the median and standard deviation of the fucoidanase gene content of co-occurring degraders in each sample.
Reporting summary
Further information on research design is available in the Nature Portfolio Reporting Summary linked to this article.