
Overview
This section briefly describes the analysis plan that will be followed for this study. A statistical analysis plan (SAP) will also be developed and finalized prior to database lock. The SAP will include a detailed description of each analysis and will precede any analyses described in this section.
Analysis populations
The following analysis populations will include all randomized study sites that enrolled participants, regardless of the degree of adherence to the study interventions.
Intention-to-treat population (ITT): All enrolled participants at a study site during the study. Each participant will be analyzed according to the study intervention that the study site was assigned at the time the participant was born.
Intention-to-treat population—pharmacologically treated (ITT-PT): All participants in the ITT population who were pharmacologically treated at a study site during the study. Each participant will be analyzed according to the study intervention that the study site was assigned at the time the participant was born.
Intention-to-treat population—pharmacologically treated with symptom-based dosing approach (ITT-PT1): All participants included in the ITT-PT population who were pharmacologically treated using a symptom-based dosing approach.
Intention-to-treat population—pharmacologically treated with scheduled opioid taper approach (ITT-PT2): All participants included in the ITT-PT population who were pharmacologically treated using a scheduled opioid taper approach.
Endpoints
Table 3 provides a summary of the endpoints that will be used to address the primary and secondary objectives.
Table 3 Objectives and endpointsMeasures to minimize bias
The following measures will be taken to minimize bias in this study:
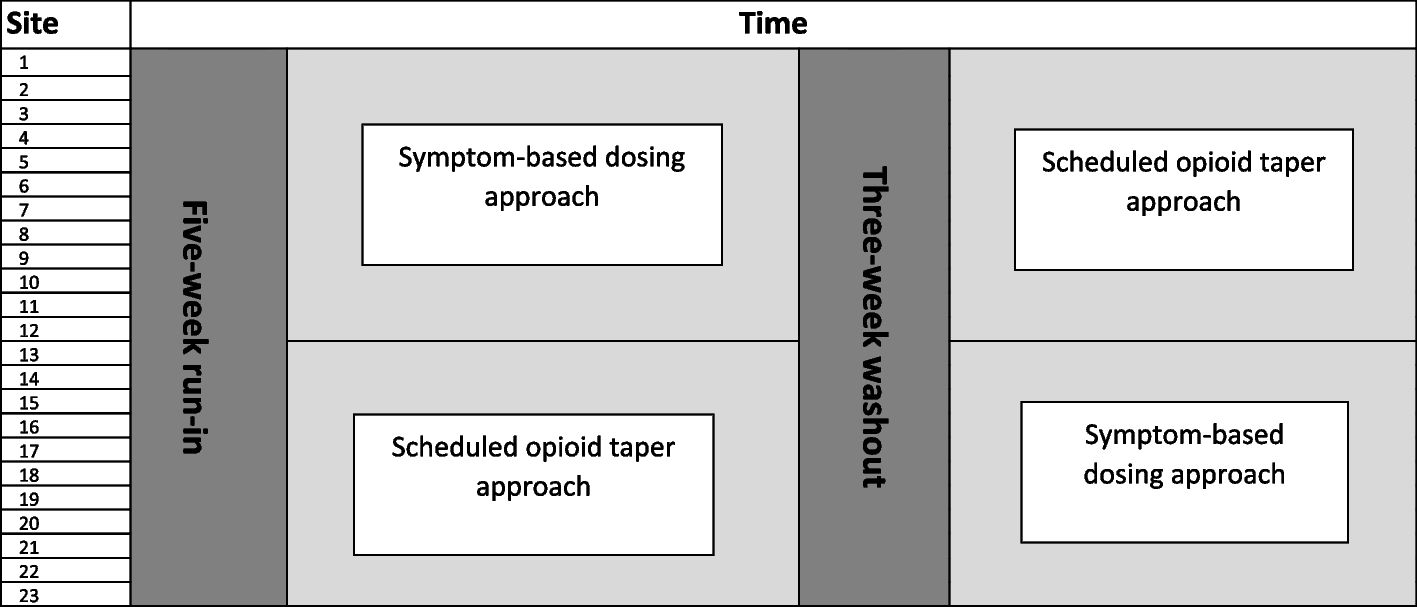
Due to the nature of the study interventions, site-specific effects may arise. Consequently, a cluster crossover study design was selected because each study site will administer both study interventions at randomly selected times, thereby allowing for within-site estimates of the intervention effect.
The assessment and management approach (FNAST or ESC) used at each study site may substantially affect the outcomes of interest. To address potential confounding, each study site will be required to use the same assessment and management approach for the duration of the study. Additionally, the randomization scheme will be stratified by the assessment and management approach to ensure that the percentage of study sites using each assessment and management approach is similar between the two sequences.
Analysis plan
All statistical analyses will be performed by DCC biostatisticians. Data will be monitored for accuracy and completeness throughout the study. Analyses will only be performed after the database has been locked.
For descriptive summaries of study data, the following will be presented:
Nominal/categorical measures will be summarized using frequencies and percentages.
Interval or ratio scale measures will be summarized using means, standard deviations, medians, 95% confidence intervals (CIs), 25th and 75th percentiles, and ranges.
Ordinal measures will be summarized depending on the number of levels. An ordinal measure with five levels or fewer will be summarized as a nominal measure. An ordinal measure with more than five levels will be summarized as an interval or ratio scale measure.
Unless otherwise specified, each objective will be addressed by fitting a generalized linear mixed-effects model (GLMM) specified with a distribution and link function appropriate to each participant-level outcome in infants with NOWS who are assessed and managed with FNAST and ESC separately. Each model will also include the following fixed effects:
Random effects for site will also be included in the model to account for within- and between-period intra-cluster correlation. The form of the random effect for site will be evaluated by comparing information criteria across the models with different forms and selecting the form that produces the best fit. Small sample corrections will also be employed to account for the small number of sites that are randomized.
Because it is of clinical interest to separately evaluate all objectives in infants with NOWS who are assessed and managed with FNAST and ESC separately, no adjustment for multiple comparisons will be made.
Primary analysis of primary objective
Using the model outlined in the Analysis plan section, the number of days from birth until the participant meets criteria for medically ready for discharge will be analyzed in all infants in the ITT population who are assessed and managed with ESC using a GLMM with a negative binomial distribution and log link function. This model will be used to estimate the following quantities (and corresponding 95% CIs):
Adjusted mean number of days until medically ready for discharge in infants managed for NOWS with a symptom-based dosing approach
Adjusted mean number of days until medically ready for discharge in infants managed for NOWS with a scheduled opioid taper approach
Difference in adjusted mean number of days until medically ready for discharge between infants managed for NOWS with a symptom-based dosing approach and infants who managed for NOWS with a scheduled opioid taper approach
Adjusted relative rate (RR) of days until medically ready for discharge comparing infants managed for NOWS with a symptom-based dosing approach to infants managed for NOWS with a scheduled opioid taper approach
Supportive analyses of the primary objective
To investigate if the intervention effect (i.e., symptom-based dosing approach versus scheduled opioid taper approach) is modified by the study period in which the participant was born (study period 1 or 2), a two-way interaction between dosing approach and study period will be added to the model described in the Primary analysis of primary objective section. Further details regarding the interpretation of the fitted model will be provided in the SAP.
Analyses of secondary objectives
Using the model outlined in the Analysis plan section, Table 4 provides a summary of the endpoint, analysis population, statistical model, and resulting estimate for each of the secondary objectives.
Table 4 Statistical approach to be used for secondary objectives
Similar to the sub-group analyses performed for the primary objective outlined in the Primary analysis of primary objective section, sub-group analyses will also be conducted for each secondary endpoint to determine if the intervention effect within each assessment and management approach is modified by the study period in which the participant was born.
Descriptive analyses
Baseline characteristics will be compared between the following groups using descriptive statistics:
Each nominal/categorical variable will be summarized within each group and overall using a frequency and a percentage. The distribution of each nominal/categorical variable will be compared between the groups using a Pearson’s chi-squared test or Fisher’s exact test (as appropriate). Interval or ratio scale variables will be summarized within each group and overall using a mean, standard deviation, median, and inter-quartile range. The distribution of each interval or ratio scale variable will be compared between the groups using a Wilcoxon rank sum test. All tests will be performed using a two-sided significance level of 0.05. No adjustment for multiple comparisons will be performed.
Interim analysesInterim analysis of efficacy data
Using the approach outlined in the Primary analysis of primary objective section, one interim analysis testing the efficacy of the study intervention on the primary endpoint will be performed when the assessment of the primary endpoint is completed in approximately 50% of enrolled infants with NOWS. To account for multiple tests conducted at the interim and final analyses, the nominal significance level that will be used at the time of the interim and final analyses will be determined using O’Brien-Fleming stopping boundaries via the Lan-DeMets approach. Further details will be provided in the SAP.
Interim analysis of safety data
Summaries of safety data will be reviewed every 3–6 months by the DSMB. Additionally, summaries of safety data will also be included with the results of the interim analysis outlined in the Interim analysis of efficacy data section.
Futility analysis
An interim analysis for futility will not be performed.
Statistical hypotheses
All objectives in this study will be addressed using two-sided hypothesis tests applied to the relevant analysis population and endpoint. For example, the null (H0) and alternative (HA) statistical hypotheses for the primary objective and secondary objective #1 are as follows:
H0: The length of time from birth until medically ready for discharge in infants managed for NOWS with a symptom-based dosing approach is equal to infants managed for NOWS with a scheduled opioid taper approach.
HA: The length of time from birth until medically ready for discharge in infants managed for NOWS with a symptom-based dosing approach is not equal to infants managed for NOWS with a scheduled opioid taper approach.
This hypothesis will be separately tested in two populations:
1.
Infants who were assessed and managed with ESC (primary objective)
2.
Infants who were assessed and managed with FNAST (secondary objective #1)
Sample size considerations
The primary objective will be addressed by separately testing the intervention effect in infants who were assessed and managed with ESC. Secondary objective #1 will be addressed by separately testing the intervention effect in infants who were assessed and managed with FNAST. Consequently, sample size calculations have been provided for both groups.
Given the population and study interventions under study, sample size was selected by defining a clinically meaningful effect size of a 15%–25% reduction in time to medically ready for discharge when comparing this endpoint in infants with NOWS who are assessed and managed with ESC and who are treated with a symptom-based dosing approach to infants with NOWS who are treated with a scheduled opioid taper approach. To ensure that the study is conducted in the same time frame across the 16 ESC and 8 FNAST sites, a similar sample size will also be used for FNAST sites, acknowledging that a clinically meaningful effect size of 15%–25% may not be detectable with sufficient statistical power due to the smaller number of FNAST sites selected for this study.
All sample size calculations were performed using the Shiny CRT Calculator: Power and Sample Size for Cluster Randomized Trials [26] with the following options:
Sampling structure: cross-sectional sample
Correlation structure: exchangeable
Allowance for varying cluster sizes: no
Outcome type: count
Normal approximation: T-distribution
Note that using data obtained from INFORM NOW during the periods of October 1, 2019–December 31, 2019, and July 1, 2021–March 31, 2022, we observed that:
349 infants met the eligibility criteria outlined in the Participant selection section and were assessed and managed with FNAST across 13 sites.
◦ The mean time to medically ready for discharge was 16.35 days (95% CI: 12.97, 20.61) such that the estimated intra-class correlation coefficient was 0.1629 and the estimated over-dispersion parameter was 8.40.
◦ 78.8% of participants received pharmacologic treatment.
133 infants met the eligibility criteria outlined in the Participant selection section and were assessed and managed with ESC across 8 sites.
◦ The mean time to medically ready for discharge was 10.46 days (95% CI: 8.02, 13.63) such that the estimated intra-class correlation coefficient was 0.1119 and the estimated over-dispersion parameter was 5.46.
◦ 39.1% of participants received pharmacologic treatment.
Assuming that the participants in OPTimize NOW are similar to those observed in INFORM NOW, sample size calculations of the primary endpoint given by time to medically ready for discharge were conducted under the following assumptions:
Under these assumptions, Table 5 shows that effect sizes that can be detected with 80% or 90% power in infants who are assessed and managed with ESC or FNAST using a total sample size of 480 participants (320 infants who are assessed and managed with ESC; 160 infants who are assessed and managed with FNAST) and assuming a two-sided significance level of 0.05. Specifically:
In infants who are assessed and managed with ESC, a sample size of 320 will allow us to detect a relative rate in time to medically ready for discharge between infants who are treated with a symptom-based dosing approach versus infants who are treated with a scheduled opioid taper approach of 0.79 with 80% power and 0.76 with 90% power.
In infants who are assessed and managed with FNAST, a sample size of 160 will allow us to detect a relative rate in time to medically ready for discharge between infants who are treated with a symptom-based dosing approach versus infants who are treated with a scheduled opioid taper approach of 0.71 with 80% power and 0.67 with 90% power.
Table 5 Sample size calculations
If 2 participants are accrued per site per month across the 24 sites, a total sample size of 480 participants would require 5 months per period. The duration of each period is expected to be 5 months; this length may need to be modified to ensure sample size is met in Finnegan and ESC groups. Additionally, due to variation in enrollment across the sites and that enrollment in each period will end at the same time across all sites, the number of infants enrolled in the study may be higher than 480.