
Study design and population
This is a post hoc analysis of the SPRINT, an open-label randomized controlled clinical trial. A detailed description of the design and rationale of SPRINT has been published previously [21]. Briefly, participants aged 50 years or older with a systolic BP of 130-180 mmHg and an increased risk of cardiovascular events were recruited from 102 clinical centers in the USA. An increased risk for cardiovascular events was defined as at least one of the following clinical conditions: (1) the presence of clinical or subclinical CVD other than stroke; (2) an estimated glomerular filtration rate (eGFR) of 20-59 ml/min 1.73m2; (3) an elevated Framingham risk score for 10-year CVD risk ≥ 15%; and (4) age ≥ 75 years old. Major exclusion criteria included history of diabetes, prior stroke, symptomatic heart failure, left ventricular ejection fraction < 35%, polycystic kidney disease or end-stage renal diseases, or significant proteinuria > 1 g/day. A total of 9361 eligible participants were randomly assigned to the intensive BP control group with a target systolic BP of < 120 mmHg or the standard BP control group with a target systolic BP of < 140 mmHg. The SPRINT study was approved by the Institutional Review Boards of all participating institutions. Informed consents were obtained from all involved participants.
Data collection
Characteristics including socio-demographics, anthropometrics, current and past medical history, concomitant medications, and quality-of-life measurements were obtained according to a standard protocol by trained staff at baseline and annually thereafter if scheduled. BP was recorded at baseline, 1, 2, 3, 6, and every 3 months thereafter using an automated device, with three consecutive measurements taken at a 1-min interval after a 5-min rest. The average of three readings was used for analysis. Standard 12-lead electrocardiographic scans and dementia screening tests using standardized questionnaires were conducted at baseline, and every 2 years thereafter. Serum creatinine and blood urea nitrogen were measured at baseline and months 1, 3, and every 6 months at the central laboratory using an enzymatic assay. eGFR was calculated using the Chronic Kidney Disease Epidemiology Collaboration equation [22]. Serum cholesterol was measured at baseline and yearly using an enzymatic assay. Serum sodium and potassium were measured at baseline and months 1, 3, and every 6 months using the ion-selective electrode method. Serum glucose was measured at baseline and every 2 years using a Hexokinase method. Urine albumin and creatinine were measured from a spot urine sample at baseline, 6 months, and yearly thereafter. Urine albumin was measured using a nephelometric method. Urine creatinine was measured using the enzymatic assay.
Assessment of frailty
Changes in frailty status were evaluated by frailty status at baseline and the 12-month visit. Frail or non-frail status (as robust status in this study) was grouped based on the SPRINT frailty index (FI) constructed by the SPRINT study research group through the accumulated health deficits approach [23, 24]. Due to the unavailability of data from the EuroQol 5-Dimensional Descriptive System questionnaire, cancer information, and the individual Montreal Cognitive Assessment (MoCA) orientation score at the 12-month visit and beyond, the FI was calculated according to a 33-item inventory (34 items for participants ≥ 75 years of age) in this study, including information on self-ratings of health and depression symptoms, cognitive performance (logical memory test, digit symbol coding test, and the total score of MoCA), BP and laboratory measurements, and self-reported comorbidities (Additional file 1: Table S1). For participants aged ≥ 75 years at randomization, gait speed measured by a 4-m walk test at baseline and annually was additionally included, using the faster gait speed from two consecutive tests within each visit.
FI was calculated by the sum of the score for each health item divided by the number of items [24]. Only participants with at least 30 items were eligible for FI calculation [2]. For items measured only at baseline and at 2-year intervals subsequently (e.g., blood glucose, electrocardiographic scans, and cognitive measurements), values from the 24-month visit were used as substitutes for those at the 12-month visit for FI calculation. FI ranged from 0 to 1, with a higher FI indicating a higher level of frailty. Participants were categorized into frail (FI > 0.21) or robust (FI ≤ 0.21) groups [15] at baseline and the 12-month visit, respectively, and changes in frailty status from baseline to 12 months were categorized into stable-robust, robust-to-frail, frail-to-robust, and stable-frail groups. Change in FI (∆FI) was calculated by FI at 12 months minus FI at baseline.
Outcome ascertainment
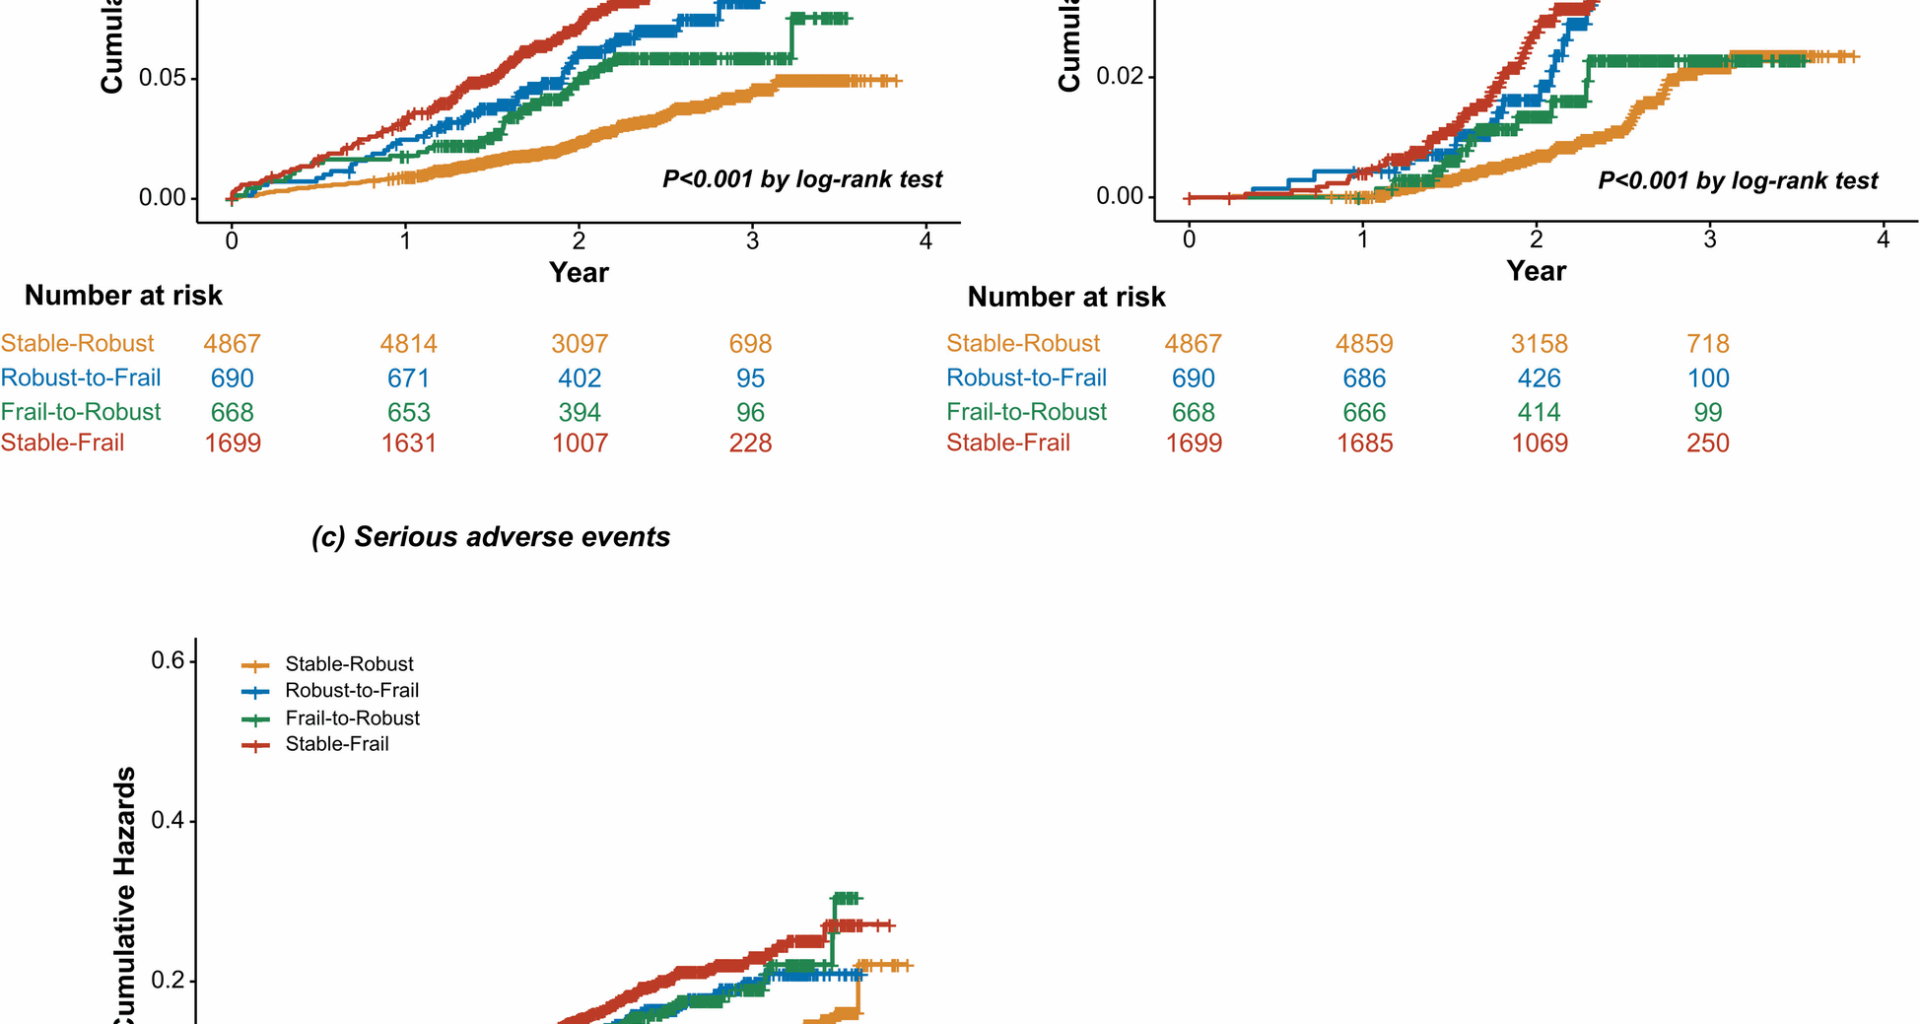
The outcomes of interest were major CVD events (a composite of myocardial infarction (MI), acute coronary syndrome not resulting in MI, stroke, heart failure, or death attributable to CVD) and all-cause mortality. Serious adverse events (SAEs) including hypotension, electrolyte abnormality, syncope, bradycardia, injurious fall, and acute kidney injury (AKI) were also evaluated. Clinical outcomes were adjudicated by experts of the adjudication committee who were blinded to study assignment. Only the first occurrence of the event for each outcome was included in the baseline frailty status analyses. For the changes in frailty status analyses, the first occurrence of the event after 12-month visit was recoded.
Statistical analysis
Characteristics of participants were described by baseline and changes in frailty status. Continuous variables were presented as means (standard deviations [SDs]) or medians (interquartile ranges [IQRs]) while categorical variables were presented as counts (percentages). The differences across categories were tested by one-way analysis of variance (ANOVA) for continuous variables and chi-square tests for categorical variables. The Hochberg method was used for multiple testing adjustments comparing the characteristics of robust-to-frail, frail-to-robust, and stable-frail groups with the stable-robust group, respectively.
The Kaplan–Meier curves were used to depict the cumulative incidence of study outcomes stratified by changes in frailty status, and the difference between groups was tested by the log-rank test. Restricted cubic splines were used to illustrate the associations of baseline FI and ∆FI with major CVD events, all-cause mortality, and SAEs. Cox proportional hazards regression was used to examine the associations between changes in frailty status and the incidence of major CVD events, all-cause mortality, and SAEs. Hazard ratios (HRs) and 95% confidence intervals (95% CIs) were calculated with the stable-robust group as the reference. ∆FI was categorized (i) into tertiles (∆FI < − 0.02182, − 0.02182 ≤ ∆FI < 0.02121, ∆FI ≥ 0.02121), or (ii) using minimal clinically important difference (MCID) threshold of 0.03 (∆FI ≤ − 0.03, − 0.03 < ∆FI < 0.03, ∆FI ≥ 0.03) [25, 26]. Cox proportional hazards regression analysis was also conducted to assess the association between different ∆FI categories and clinical outcomes. The potential confounders for adjustment in multivariable models included age (years), sex (men or women), race (non-Hispanic black, Hispanic, non-Hispanic white, or others), education (lower than high school, high school graduate, post-high school training, or college graduate or higher education), history of CVD (yes or no), smoking status (never smoked, former smoker, or current smoker), physical activity level (≤ 1, 2–4, or ≥ 5 times per week), treatment assignment (intensive BP control or standard BP control), eGFR (ml min−1 1.73 m−2), body-mass index (BMI) (kg/m2), systolic BP (mmHg), high-density lipoprotein cholesterol (mg/dL), total cholesterol (mg/dL), and number of BP-lowering medications. We further controlled for the baseline FI in the multivariable-adjusted models of ∆FI. Because missing data were relatively limited in the current study (< 1% for all variables in the analyses), they were ignored and models were built on the remaining data.
The effects of intensive BP treatment compared with standard BP treatment on major CVD events, all-cause mortality, and SAEs were assessed using Cox proportional hazards regression stratified by the baseline or changes in frailty status. The number needed to be exposed for one additional person to benefit (NNEB) or be harmed (NNEH) from intensive BP treatment was calculated in groups with statistically significant estimates. NNEB/NNEH is calculated as the inverse of the absolute risk reduction/increase between intensive and standard BP treatments stratified by baseline or changes in frailty status [27]. To test for potential interactions by baseline or changes in frailty status on the association of treatment interventions with clinical outcomes, multiplicative interaction terms were added to the model, and interactions were assessed with a likelihood-ratio test. Finally, to explore whether the baseline FI or ∆FI would attenuate the effect of intensive vs. standard BP treatment on outcomes, we compared the HRs for the treatment effect from models with and without interaction terms of BP treatment and baseline FI or ∆FI.
We conducted several sensitivity analyses. First, we used the Fine and Gray hazard model to account for competing risk from all-cause mortality for incident CVD events. Second, for health items measured only at baseline and 2 years after randomization, baseline values were used as substitutes for those at the 12-month visit for FI calculation. Third, we excluded the health items measured every 2 years for FI calculation.
All statistical analyses were performed by R software version 4.2.2 (R Foundation for Statistical Computing) and SAS version 9.4 (SAS Institute). A two-sided P value < 0.05 was considered statistically significant.