
Baseline characteristics
As shown in Table 1, we included 6447 young adults, of whom 3040 (47.2%) were female; 3407 (52.8%) were male; 3267 (50.7%) were aged between 16 and 20 years; 2016 (31.3%) were aged between 21 and 24 years; 2883 (44.7%) were majoring in science, technology, engineering, or mathematics; 3404 (52.8%) were bachelor’s degree students; 1923 (17.4%) were doctoral students; 859 (13.3%) were poverty-stricken college student; 4520 (70.1%) originated from urban areas; 3921 (60.8%) had residential experience; 3923 (60.9%) were an only child; 1941 (30.1%) had a fathers’ education attainment of bachelor’s degree and above; 1651 (25.6%) had a mothers’ education attainment of bachelor’s degree and above; 543 (8.4%) had poor relationships between their parents; 161 (2.5%) had poor relationships with their family; and 297 (4.6%) had poor relationships with their friends.
Depressive symptom status at baseline and follow-up
The median depression score of young adults at the baseline survey was 3.0 (IQR 0–8.0), and the number of participants with depressive symptoms was 687 (406 with mild depressive symptoms and 281 with moderate and severe depressive symptoms). Among 5760 participants without depressive symptoms at baseline, 559 had depressive symptoms at follow-up, with an incidence rate of 9.7% (95%CI = 8.94%−10.47%). Among the 687 participants with depressive symptoms at baseline, 406 had improved depressive symptom status at follow-up, with an incidence rate of 59.1% (95%CI = 55.42%−62.77%), whereas 86 experienced depressive symptom progression by follow-up, with an incidence rate of 12.52% (95%CI = 10.04%−14.99%).
Differences in dietary intake by depressive symptom status
The volume of nutrient intake, food components and DBI score from September 2021 to December 2023 stratified by the presence of depressive symptoms at baseline are shown in Table 2. There were statistically significant between-group differences in the intake volumes of carbohydrates, Vit A, retinol, Vit B2, Fe, Mn, grains, light-coloured vegetables, dark vegetables, fish and shrimp, whole grains, oils, salts and sauces from September 2021 to December 2023 (all P values < 0.05). Notably, the differences were more pronounced for carbohydrates, vitamin A, retinol, grains, light-coloured vegetables, dark vegetables, and whole grains (absolute differences > 1; P values < 0.05).
Association of nutrients intake trajectory and food components intake trajectory with onset of depressive symptom
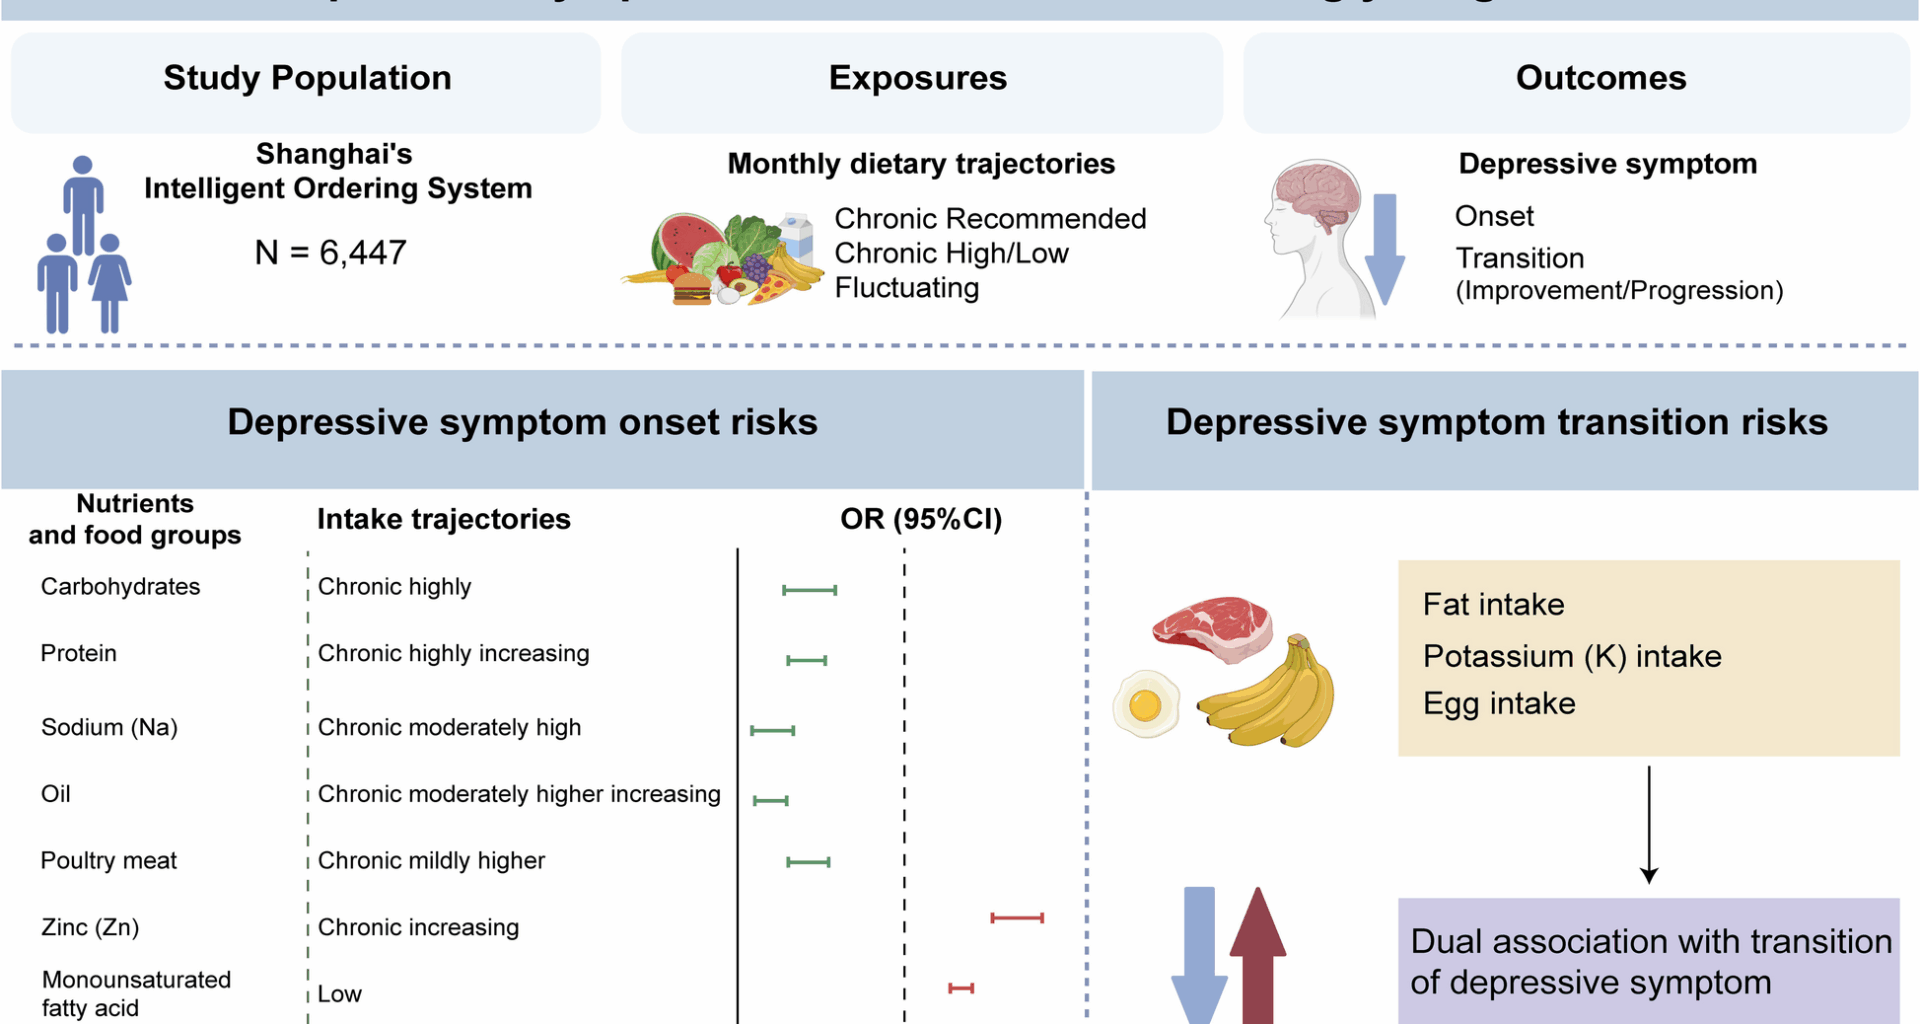
As shown in Additional file 3: Table S3.1, the prevalence of the onset of depressive symptoms differed across professions, household registrations, status of relationship with parents, and status of relationships with family and friends (P < 0.05). The results of the nutrient intake trajectory analysis by the GBMT and univariate analysis with depressive onset are shown in Additional file 3: Table S3.2. The chi-square test suggested that among the 28 types of nutrients, the intake trajectories of carbohydrates, proteins, SFAs, MUFAs, VitB3, Na, Zn, and Se were possibly associated with the onset of depressive symptom, with P values all < 0.10. The multivariate associations between nutrient intake trajectory and the onset of depressive symptoms are shown in Fig. 2 and Additional file 4: Table S4.3.1. According to the fully adjusted logistic regression model with energy, participants with chronic mildly high carbohydrate intake (7.68%) and chronic highly carbohydrate intake (7.25%) had a lower risk of depressive symptom onset than those who consumed the recommended amount of carbohydrates, with a prevalence of 10.8% (OR = 0.72, P < 0.001; OR = 0.69, P < 0.001).
Compared with participants who chronically consumed the recommended amount of protein, participants with chronic mildly high protein consumption, chronic moderately high protein consumption and chronic highly increasing protein consumption had a lower risk of depressive symptom onset (8.47%, OR = 0.75, P < 0.001; 8.76%, OR = 0.79, P < 0.001; 8.12%, OR = 0.68, P < 0.001). Compared with chronic rapidly increasing most high SFAs intake (11.8%), participants with chronic moderately increasing lower SFAs intake, initially increasing then decreasing lower SFAs intake, chronic lower SFAs intake and chronic lowest SFAs intake had lower had a lower risk of depressive symptom onset (8.0%, OR = 0.59, P < 0.001; 8.54%, OR = 0.68, P < 0.001; 11.0%, OR = 0.89, P = 0.024; 10.1%, OR = 0.78, P < 0.001). Participants with low MUFAs intake (10.3%) had a higher risk of depressive symptom onset than those with increasing high MUFAs intake (8.62%) (OR = 1.26, P < 0.001). Compared with chronic recommended VitB3 intake (10.6%), participants who are chronic slightly low VitB3 intake, chronic moderately low VitB3 intake, chronic moderately high increasing VitB3 intake suggested lower risk of depressive symptom onset (8.63%, OR = 0.80, P < 0.001; 9.29%, OR = 0.85, P < 0.001; 7.43%, OR = 0.65, P < 0.001), while chronic slightly low increasing VitB3 intake suggested higher risk of depressive symptom onset (11.6%, OR = 1.09, P = 0.008). Compared with chronic increasing Na intake (10.4%), chronic mildly high increasing Na intake, chronic moderately high Na intake and chronic highest increasing Na intake were associated with a lower risk of depressive symptom onset (9.97%, OR = 0.91, P = 0.024;6.54%, OR = 0.59, P < 0.001; 8.08%, OR = 0.75, P < 0.001). Compared with chronic recommended Zn intake (7.43%), chronic mildly lower but increasing Zn intake, chronic moderately lower Zn intake and the lowest but increasing Zn intake (11.0%, OR = 1.40, P < 0.001; 9.48%, OR = 1.18, P < 0.001; 10.9%, OR = 1.50, P < 0.001) were associated with higher risk of depressive symptom onset. Compared with chronic recommended Se intake (9.07%), chronic moderately lower increasing Se intake was associated with a lower risk of depressive symptom onset (7.13%, OR = 0.68, P < 0.001), while chronic vigorously lower increasing Se intake was associated with a higher risk of depressive symptom onset (11.2%, OR = 1.11, P = 0.018).
The multivariate associations between food component intake trajectories and depressive symptom onset are shown in Additional File 4: Table S4.5.1. Compared with chronic recommended refined grained consumption (6.96%), chronic mildly lower increasing refined grain, chronic moderately lower increasing refined grain consumption and chronic lowest increasing refined grain consumption were associated with higher depressive symptom onset risk (9.2%, OR = 1.37, P < 0.001; 11.0%, OR = 1.73; 12.0%, OR = 1.81), meanwhile chronic mildly high refined grain intake and chronic moderately high increasing refined grain intake also were associated with higher depressive symptom onset risk (9.17%, OR = 1.34; 10.3%, OR = 1.38). Compared with increasing chronic recommended light-coloured vegetable consumption, chronic mildly lower (9.20% vs 6.96%, OR = 1.44, P < 0.001), lowest increasing (11.0% vs 6.96%, OR = 1.37, P < 0.001) and chronic highest rapidly increasing (12.0% vs 6.96%, OR = 1.28, P < 0.001) light-colored vegetable intake were associated with a higher risk of depressive symptom onset. Compared with chronic recommended poultry (9.9%), chronic slightly higher poultry meat intake and chronic mildly higher increasing poultry meat intake were associated with a higher risk of depressive symptom onset (10.7%, OR = 1.07, P = 0.025; 11.3%, OR = 1.10, P = 0.009), while chronic mildly higher poultry meat intake and chronic moderately higher increasing light vegetable intake were associated a lower risk of depressive symptom onset (7.05%, OR = 0.72, P < 0.001; 9.26%, OR = 0.89, P = 0.006). Compared with chronic recommended oil consumption (10.2%), chronic moderately higher increasing oil consumption, chronic moderately higher increasing oil intake and chronic highest and rapidly oil increasing intake were associated with a lower risk of depressive symptom onset (7.48%, OR = 0.94, P = 0.020; 7.48%, OR = 0.62; 8.24%, OR = 0.63). Compared with chronic recommended sauce consumption (11.5%), chronic slightly higher sauce intake, chronic mildly higher sauce intake, chronic moderately higher increasing sauce intake, chronic vigorously higher and rapidly sauce increasing intake and highest rapidly increasing sauce consumption were associated with a lower risk of depressive symptom onset (8.87%, OR = 0.72, P < 0.001; 11.0%, OR = 0.90, P < 0.001; 8.77%, OR = 0.71, P < 0.001; 8.05%, OR = 0.60, P < 0.001; 9.02%, OR = 0.68, P < 0.001). For diet quality, a chronic slightly higher HBS (6.70%) was associated with a lower risk of depressive symptom onset than a chronic recommended HBS (10.17%) (OR = 0.67, P < 0.001). The majority of associations remained statistically significant following FDR adjustment.
Association of nutrients intake trajectory and food components intake trajectory with transition of depressive symptom
The multivariate associations between nutrient intake trajectories and depressive symptom transitions are shown in Fig. 3 and Additional file 5: Table S5.3.1. Compared with chronic recommendation fat consumption, chronic slightly higher, chronic mildly higher increasing and chronic moderately higher and highest initially decreasing then increasing fat consumption were associated with higher chance of depressive symptom improvement (65.26%, OR = 2.01, P < 0.001; 58.16%, OR = 1.26, P < 0.001; 59.0%, OR = 1.42, P < 0.001; 72.0%, OR = 3.14, P < 0.001) and higher risk of depressive symptom progression (12.68%, OR = 3.57, P < 0.001; 13.48%, OR = 2.88, P < 0.001; 16.0%, OR = 3.8, P < 0.001; 13.33%, OR = 2.21, P < 0.001; 12.0%, OR = 6.2, P < 0.001). Compared with chronic most high and decreasing MUFAs consumption, chronic moderately lower decreasing, chronic vigorously lower increasing, chronic vigorously lower and chronic lowest MUFAs consumption were associated with lower risk of depressive symptom progression (10.64%, OR = 0.96, P = 0.020; 6.38%, OR = 0.32, P < 0.001; 9.93%, OR = 0.61, P < 0.001), however, chronic some lower increasing and chronic vigorous lower MUFAs consumption were associated with lower chances of depressive symptom improvement (54.26%, OR = 0.77, P < 0.001; 51.79%, OR = 0.82, P < 0.001).
Participants who are chronic higher and increasing K consumption suggested a higher improvement chance (63.04% vs 55.06%, OR = 1.32, P < 0.001) and a lower progression risk (8.70% vs 13.29%, OR = 0.73, P < 0.001) of depressive symptom than who are chronic adequately increasing K consumption. Compared with chronic adequately increasing K consumption, chronic slightly low K consumption suggested a higher chance of depressive symptom improvement (56.12% vs 55.06%, OR = 1.12, P < 0.001) meanwhile a higher risk of depressive symptom progression (18.71% vs 13.29%, OR = 1.45, P < 0.001); chronic vigorously low K consumption suggested a lower chance of depressive symptom improvement (54.20% vs 55.06%, OR = 0.81, P < 0.001) meanwhile a lower risk of depressive symptom progression (9.92% vs 13.29%, OR = 0.63, P < 0.001). Compared with chronic recommended Zn consumption chronic low (66.67%), chronic moderately low increasing and chronic lowest decreasing Zn consumption (64.53%, OR = 0.93, P < 0.001; 56.44%, OR = 0.52, P < 0.001) as well as slightly high and initially decreasing then increasing and chronic highest decreasing Zn consumption (54.43%, OR = 0.47, P < 0.001; 58.06%, OR = 0.56, P < 0.001) were associated with lower chances of depressive symptom improvement.
The multivariate associations between food groups intake trajectories and depressive symptom transitions are shown in Fig. 3 and Additional file 5: Table S5.5.1. Compared with chronic recommended egg consumption, chronic slightly low, chronic lowest, chronic moderately high, chronic moderately high increasing, chronic vigorously high increasing, chronic highest and rapidly increasing volume of egg consumption were associated with lower chance of depressive symptom improvement (60.71%, OR = 0.73, P < 0.001; 50.0%, OR = 0.47, P < 0.001; 60.98%, OR = 0.80, P < 0.001; 47.62%, OR = 0.64, P < 0.001; 58.33%, OR = 0.6, P < 0.001; 59.38%, OR = 0.52, P < 0.001), meanwhile chronic slightly low, chronic lowest, chronic moderately high, chronic moderately high increasing, chronic vigorously high increasing, chronic highest and rapidly increasing were also associated with lower risks of depressive symptom progression (11.43%, OR = 0.44, P < 0.001; 5.0%, OR = 0.14, P < 0.001; 12.2%, OR = 0.48, P < 0.001; 13.33%, OR = 0.3, P < 0.001; 9.72%, OR = 0.26, P < 0.001; 6.25%, OR = 0.16, P < 0.001). Compared with chronic recommended bean consumption, chronic moderately high increasing bean consumption was associated with a higher chance of depressive symptom improvement (65.67% vs 60.71%, OR = 1.15, P = 0.001) and a lower risk of depressive symptom progression (8.96% vs 11.31%, OR = 0.89, P < 0.001); chronic lowest bean consumption was associated a lower chance of depressive symptom improvement (51.02% vs 60.71%, OR = 0.56, P < 0.001) but a lower risk of depressive symptom progression (10.88% vs 11.31%, OR = 0.68, P < 0.001). Compared with chronic recommended salt consumption, chronic recommended increasing salt consumption was associated with a higher chance of depressive symptom improvement (69.85% vs 57.14%, OR = 1.52, P < 0.001) and a lower risk of depressive symptom progression (8.82% vs 14.91%, OR = 0.81, P < 0.001); while chronic moderately high increasing salt consumption was associated with a lower chance of depressive symptom improvement (51.82% vs 57.14%, OR = 0.86, P < 0.001) and a higher risk of depressive symptom progression (18.18% vs 14.91%, OR = 1.27, P < 0.001); chronic slightly lower and chronic highest and rapidly increasing salt consumption was associated with lower chances of depressive symptom improvement (56.1% vs 57.14%, OR = 0.88, P < 0.001; 62.67% vs 57.14%, OR = 0.84, P < 0.001) but lower risks of depressive symptom progression (12.68% vs 14.91%, OR = 0.84, P < 0.001; 5.33% vs 14.91%, OR = 0.27, P < 0.001). Compared with chronic moderately insufficient intake, chronic mildly insufficient and increasing and chronic mildly insufficient intake were associated with higher chances of depressive symptom improvement (58.73% vs 56.94%, OR = 1.25, P < 0.001; 63.01% vs 56.94%, OR = 1.42, P < 0.001), but higher risks of depressive symptom progression (15.66% vs 9.09%, OR = 2.27, P < 0.001; 10.27% vs 9.09%, OR = 1.4, P < 0.001). Most of the associations remained significant after FDR adjustment.