
Genetic ancestry is a quantitative measure of inherited genetic variation and correlates with human migration patterns1. It contributes to tumor phenotypes both independently and through interaction with environmental exposures2,3,4,5,6. Differences in cancer-driving events between genetic ancestries, particularly in clinically actionable alterations6,7,8, can illuminate the biological underpinnings of health disparities and suggest opportunities to improve access to biomarker-driven therapies for underserved populations. Most cancer genomics discoveries to date have relied on individuals of European (EUR) ancestry, which has limited our understanding of tumors from diverse genetic backgrounds. This disparity risks misclassifying variants and misdiagnosing patients9. Increasing population diversity in cancer genomics will facilitate the discovery of new drivers and the better annotation of variants of uncertain significance, ultimately benefiting all patients. However, many current clinical sequencing panels used to guide treatment and match patients to clinical trials for new targeted therapies10,11 were designed based on genomic discoveries in cancer patients of EUR ancestry.
Here we conducted a meta-analysis of two cohorts derived from United States (US) Food and Drug Authority (FDA)-approved targeted next-generation sequencing panels—the Memorial Sloan Kettering Integrated Molecular Profiling of Actionable Cancer Targets (MSK-IMPACT) panel (up to 505 genes, tumor-normal)12 and Foundation Medicine’s FoundationOne CDx panel (324 genes, tumor-only)13, with 253 overlapping genes used for analysis. We have previously inferred genetic similarity of five superpopulations reported in the 1000 Genomes Project14—African (AFR), Admixed American (AMR), East Asian (EAS), EUR and South Asian (SAS)—using single-nucleotide polymorphism (SNP) markers from captured regions of gene panel sequencing in the Foundation Medicine cohort and the MSK-IMPACT cohort (Fig. 1a)3,6,7,15. We performed multivariate logistic regression in each cohort to associate gene alterations with genetic ancestry, adjusting for covariates including age, sex, tumor mutation burden (TMB), panel version and histology (Methods). We separately analyzed different types of genomic alterations (mutations, copy number alterations and fusions) for each gene and considered only oncogenic/likely oncogenic (MSK-IMPACT) or pathogenic/likely pathogenic (FoundationOne) somatic alterations. We then meta-analyzed results across cohorts using a fixed-effects model weighted by sample size, and prioritized associations with consistent directionality (Extended Data Fig. 2).
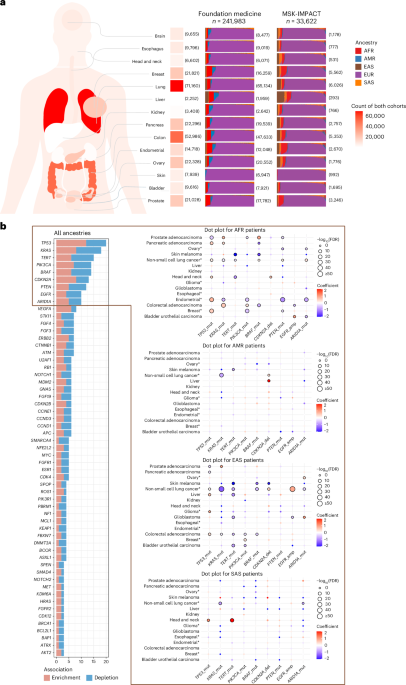
Fig. 1: Description of study cohorts and ancestry-associated, gene-level, somatic alterations derived from meta-analysis.
a, Overview of patient population distribution in the FoundationOne panel cohort from Foundation Medicine and the MSK-IMPACT cohort. For each cancer type, the total number of patients from both cohorts is annotated on the left of the stacked bar plot. Each stacked bar plot (right) shows the ancestry proportion for samples of a specific cancer type in the Foundation Medicine and MSK-IMPACT cohorts. The sample size of each cancer type within each cohort is annotated on the right side of the stacked bar plots. EUR – European, SAS – South Asian, EAS – East Asian, AMR – Admixed American and AFR – African. b, Bar plot showing frequencies of statistically significant gene associations in all ancestries (left), and dot plots for non-EUR ancestries showing cancer types and effect size for genes with at least ten statistically significant associations (right). In dot plots, effect size is shown in a color bar with blue indicating depletion and red indicating enrichment. The size of the dot represents the FDR-adjusted P value with increasing dot size as values get smaller. Dots with dark outline show significant (FDR-adjusted P < 0.1) associations. On horizontal axes, gene alterations are presented as ‘gene symbol_alteration type’, like ‘TP53_mut’ for TP53 mutations. Alteration types shown—mut, mutation; amp, copy number amplification; del, copy number deletion. To enhance the visibility of gene symbols in the all ancestries plot, only genes with at least three statistically significant associations are shown. The full list of gene associations is in Supplementary Table 1. An asterisk indicates cancer types with more than one subtype.
We identified 447 statistically significant associations involving 116 unique genes (Extended Data Fig. 3 and Supplementary Table 1). Many associations were cancer-specific, although several gene alterations, such as TP53, KRAS, TERT, PIK3CA mutations, CDKN2A deletion, EGFR, ARID1A and VEGFA amplifications were frequently associated with genetic ancestry across cancers (Fig. 1b). In line with previous reports, TP53 mutations were enriched in AFR and EAS ancestries across multiple cancers2,16, however, we also observed a depletion of TP53 mutations in prostate adenocarcinoma in both AFR and EAS, which was consistent across stages (Fig. 2). Notably, TERT promoter mutations were recurrently depleted in patients with these genetic ancestries, in contrast to their enrichment in EUR ancestry, in bladder urothelial carcinoma, glioblastoma (GBM), cutaneous melanoma and hepatocellular carcinoma that were also consistent across stages (Figs. 1b and 2). This suggests genetic ancestry-specific biological mechanisms across cancer types that warrants further investigation. For cancer-specific associations, we replicated previously reported findings and several new findings should be highlighted (Supplementary Table 2). Actionable ERBB2 mutations were enriched in lung cancer patients of AMR ancestry in both cohorts (Supplementary Table 1), and we confirmed that the enrichment of ERBB2 mutations in AMR ancestry was independent of smoking status, using the MSK-IMPACT samples with smoking data (P = 0.008, odds ratio (OR) = 5.547). CDK12 inactivating mutations were enriched in EAS ancestry in prostate cancer (Supplementary Table 1) and were marginally significant after adjusting for metastatic status available in the MSK-IMPACT cohort only (P = 0.089, OR = 2.195). Notably, these mutations can be targeted with FDA-approved drugs, underscoring the potential clinical relevance of ancestry-associated differences in somatic alterations. Furthermore, several potential biomarkers were associated with patients with AFR ancestry, such as enrichment of BAP1 mutations in head and neck squamous cell carcinoma and depletion of FGFR2 mutations in uterine endometrioid carcinoma (Supplementary Table 1).
Fig. 2: Association of AFR and EAS ancestries with TERT promoter mutations and TP53 mutations by cancer type.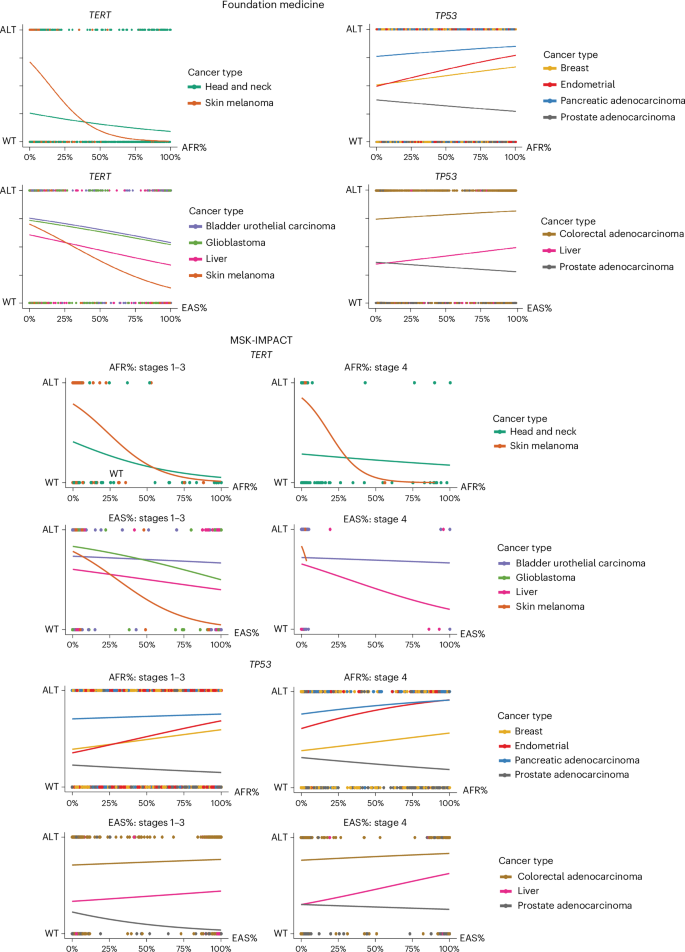
Dot plots show the relationship between ancestry percentage and gene driver mutation status (ALT or WT). Each dot represents a patient sample. Top, Foundation Medicine cohort; bottom, MSK-IMPACT cohort. Logistic regression lines are shown for each cancer type. For the MSK-IMPACT cohort, plots are categorized by stage into the following two groups: early-stage (stages 1–3) and late-stage (stage 4). Plots for early-stage patients are shown on the left, while late-stage patients are shown on the right. ALT, altered; WT, wildtype.
Next, we assessed the rate of known driver alterations identified from targeted panel sequencing by genetic ancestry. We calculated a ‘driver burden’ score defined by the total number of somatic driver mutations, copy number alterations and structural rearrangements per sample. We used multivariate linear regression (LR) to associate genetic ancestry with driver burden, controlling for age, sex, tumor purity, panel version and TMB (Methods). We found that known drivers were depleted in kidney and endometrial cancers of AFR ancestry (Fig. 3 and Supplementary Table 3). Analyzing histological subtypes separately showed no statistically significant differences with AFR ancestry in renal clear cell carcinoma (RCCC) and papillary renal cell carcinoma (PRCC) subtypes, although in endometrial cancer, there was a tendency of driver depletion in each subtype (endometrioid, papillary serous and clear cell) with AFR ancestry (Fig. 3 and Supplementary Table 3). This finding highlights a substantial limitation of the current panel sequencing design. Of the two main subtypes of renal cancer, RCCC is more frequent in patients with EUR ancestry, while the PRCC subtype is more often seen in patients of AFR ancestry17,18, possibly due to a combination of genetic and nongenetic factors19,20 (Extended Data Fig. 1). Both of our sequencing panels lacked driver alterations for PRCC. Consequently, we observed a high percentage of PRCC samples without at least one panel-defined driver alteration in known renal cell carcinoma driver genes compared to RCCC (70% versus 10%; Extended Data Fig. 4a,b) even though median tumor purity was slightly higher in PRCC (60%) than RCCC (50%; Extended Data Fig. 4c). This highlights the critical need for more studies to discover new genomic drivers for PRCC, which has a relatively poor prognosis in the metastatic setting21 and limited treatment options compared to RCCC. Despite the depletion of overall driver alterations in PRCC, we found an enrichment of MET mutations with AFR ancestry from our gene-level analysis (Supplementary Table 1 and Extended Data Fig. 3a). MET alterations are an important therapeutic target for advanced PRCC. While MET inhibitors have been investigated in clinical trials, there are few clinical trials of MET inhibitors for PRCC22,23. The challenge of fully evaluating these targeted therapies in patients of AFR ancestry is further compounded by the persistently low representation of individuals of AFR ancestry in RCC clinical trials, a concern widely recognized across oncology research24. Greater accrual of AFR ancestry patients in clinical trials is therefore crucial. Clinical trial investigators should actively engage more diverse communities and ensure inclusive participation for all eligible patients.
Fig. 3: Driver burden meta-analysis reveals statistically significant ancestry associations in cancer types/subtypes.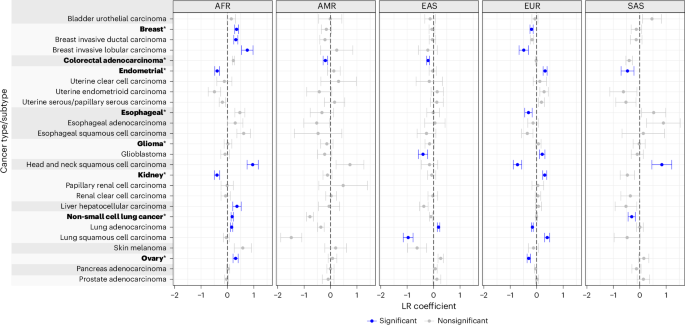
Meta-analysis results of LR to associate genetic ancestry with driver burden. The driver burden score is defined by the total number of somatic driver mutations, copy number alterations and structural rearrangements per sample. LR coefficients (points) plus or minus standard error (error bars) are shown. For each cancer type/subtype and ancestry group, negative LR coefficients represent depletion, while positive LR coefficients represent enrichment of driver alterations. Cancer type names containing more than one subtype are in bold. Rectangles outline corresponding cancer types and subtypes. Significant associations, colored blue, have FDR-adjusted P < 0.1 and consistent coefficients (both negative or both positive) in MSK-IMPACT and Foundation Medicine cohorts. The full list of driver burden association results is in Supplementary Table 3.
Ancestry-associated gene-level alterations may contribute to the overall driver burden differences in specific cancer types and subtypes. For example, the enrichment of BAP1, TP53 mutations and CDKN2A copy number deletions with AFR ancestry may explain the enrichment of driver alterations with AFR ancestry in head and neck squamous cell carcinoma compared to EUR ancestry (Fig. 3 and Supplementary Tables 1 and 3). The depletion of driver alterations in EAS and enrichment in EUR for GBM is also consistent with the depletion of TERT promoter mutations in EAS and enrichment in EUR. Along with TERT, other relevant gene-level associations, such as depletion of FGFR3 fusion and EGFR amplification with EAS ancestry, may also be associated with the driver burden differences observed in GBM with different ancestries (Fig. 3 and Supplementary Tables 1 and 3). In addition to ancestry-associated gene-level alteration differences, other factors, such as TMB, may influence the effect of ancestry on driver burden. We considered the role of TMB as a potential mediator of this relationship by performing a statistical mediation analysis (Methods). We found that the depletion of driver burden with EAS ancestry is partially explained by TMB in lung squamous cell carcinoma (LUSC; proportion mediated (PM) = 44%, 95% confidence interval (CI) = 28–92%, false discovery rate (FDR)-adjusted P < 0.1) and GBM (PM = 19%, 95% CI = 10–31%, FDR-adjusted P < 0.1). LUSC are known to have high TMB, which could be the result of mutational processes due to exposures like tobacco smoking25,26,27. However, our results also show that TMB differences in LUSC cannot fully explain driver burden differences between populations.
Our study suggests that the lack of population diversity in existing tumor sequencing datasets might have resulted in biases against patients of non-EUR ancestry for detecting cancer-driving events, even when those patients had access to genomic testing and may also have access to care in a National Cancer Institute-designated cancer center. By meta-analyzing two real-world genomic cohorts, we revealed ancestry-associated somatic alterations across multiple cancers, such as depletion of TERT promoter mutations that require further investigation on the local ancestry level4,28. We demonstrated that alterations present at low frequency in patients with EUR ancestry, such as clinically actionable ERBB2 mutations in lung adenocarcinoma and MET mutations in PRCC, were enriched in patients with other ancestries, underscoring the need to ensure access to testing and targeted therapies for all populations in the US. Our study is limited by a lack of detailed social determinants of health (SDOH) data, as recommended in the National Academies of Sciences, Engineering, and Medicine report1. SDOH may explain some of the differences observed between genetic ancestries. The scientific community should expand sequencing efforts beyond known cancer genes in underrepresented populations and integrate clinical, environmental exposure, and SDOH data. This approach could uncover new mechanisms and therapeutic targets, ultimately improving clinical panel testing by incorporating overlooked biomarkers. Focusing on underrepresented populations in the US alone may not be robust enough to uncover ancestry-associated driver alterations. Global efforts are essential to fully understand the genomic basis of cancer health disparities. Additionally, multi-omic profiling of multi-ancestry cohorts at bulk, single-cell and spatial levels can improve our understanding of both tumor-intrinsic and tumor microenvironment features. Collaborative, multi-institutional and interdisciplinary efforts would be required to build these multi-ancestry cohorts, which would be important for accelerating progress in understanding and generating translatable insights to benefit all populations.