
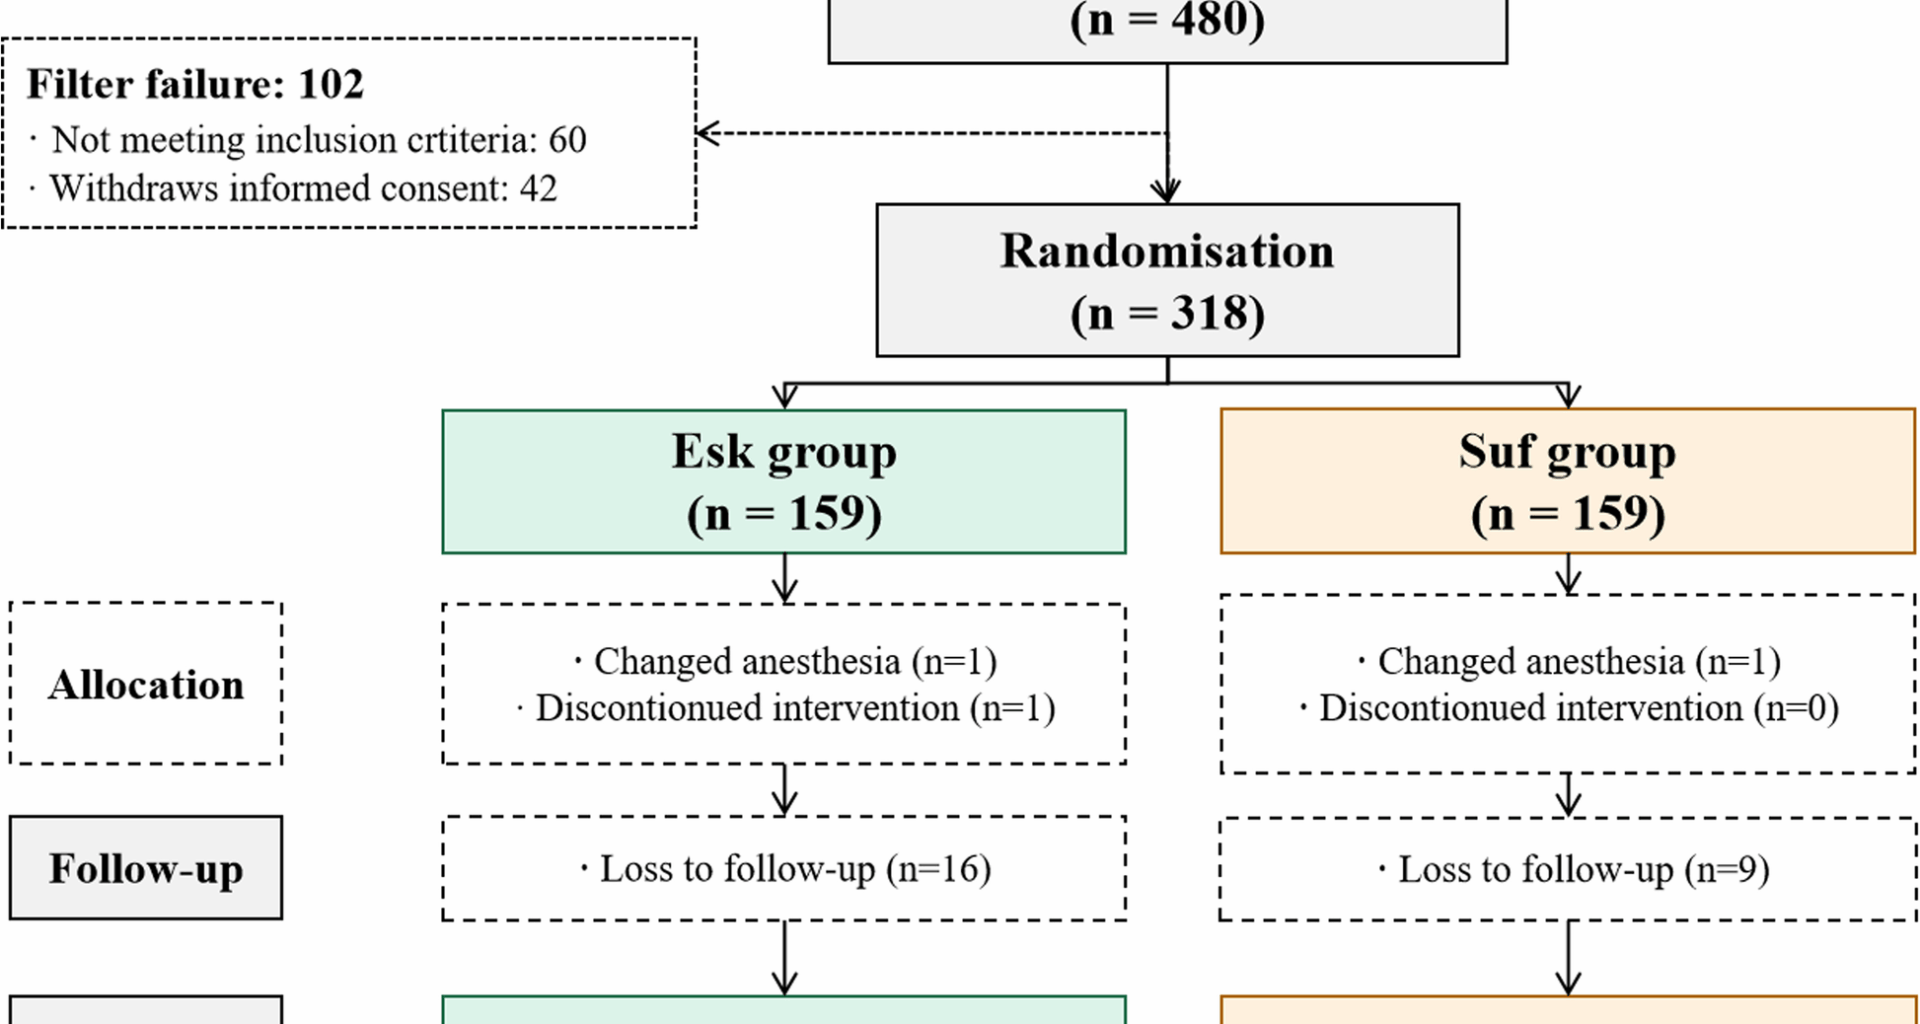
A total of 480 patients who underwent painless GI endoscopy from November 7, 2022, to April 14, 2023, were recruited. And 318 patients were screened for randomization. A total of 315 patients completed the study, and 25 patients were lost to follow-up. Finally, 290 patients were included in the analysis (Fig. 1).
Fig. 1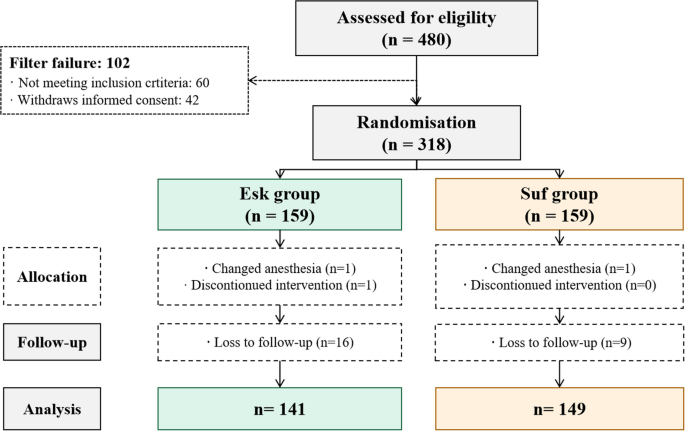
Flow chart of patient based on CONSORT 2010 Checklist. Note: n number(s)
Of the 290 patients, 43.1% were male and 56.9% were female. The age was 50.6 ± 12.8 years, and those aged above 60 years were 23.4%. The mean of the s’ body mass index (BMI) was 22.8 ± 2.9 kg/m2. Of the 290 patients, 92 (31.7%) underwent gastroscopy, 39 (13.4%) underwent colonoscopy, and 159 (54.8%) had both gastrointestinal endoscopies. (Supplementary file-Table 1).
Hypoxia and hypotension during the examination
The incidence of hypoxia in the Esk group was 7.1% (vs 16.1%, mean difference (95% CI) 9.02 (1.07, 16.92), P = 0.018, Fig. 2A), which was lower than that the Suf group. And the incidence of hypotension in the Esk group was 12.8% (vs 36.2%, mean difference (95% CI) 23.48 (13.20, 33.09), P < 0.001, Fig. 2B), that also was lower than the Suf group.
Fig. 2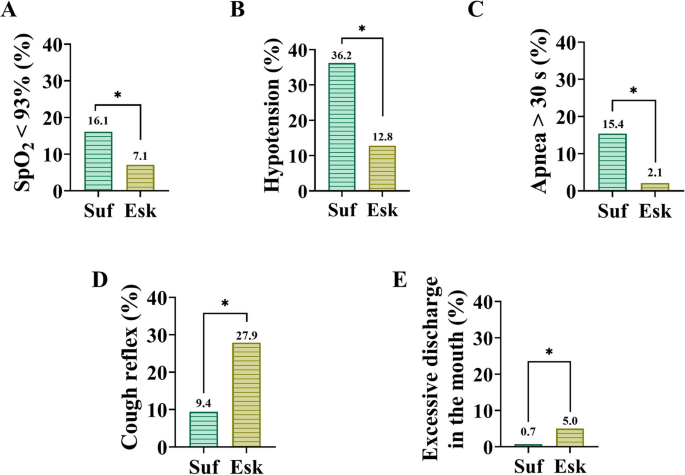
Incidence of focused adverse events during the examination (%). Note: *P < 0.05, there was statistically significant, % percentage. A Incidence of hypoxia. B Incidence of hypotension. C Percentage of apnea time over 30 seconds (s). D Incidence of coughing reaction; E: Incidence of significantly increased oral secretions (over 20 ml)
Other adverse reactions during the examination
The incidence of RD in the Esk group was lower than the Suf group (2.1% vs 15.4%, mean difference (95% CI) 13.31 (6.47, 20.52), P < 0.001, Fig. 2C). There was no significant difference in the incidence of hypertension, low HR, body movement, and hiccups (Supplementary file-Fig. 2A-–D). However, patients in the Esk group have a higher incidence of cough response (27.9% vs 9.4%, mean difference (95% CI) 18.26 (8.92, 27.44), P < 0.001,Fig. 2D) and increased secretions (5.0% vs 0.7%, mean difference (95% CI) 4.29 (0.34, 9.25), P = 0.032, Fig. 2E) than those in the Suf group.
Propofol dosage and time of endoscopy
Compared to the Suf group, the Esk group was lower at the induction dosage of propofol (58.1 ± 16.5 vs 62.5 ± 16.6 mg, mean difference (95% CI): 4.50 (0.66, 8.33), P = 0.022, Supplementary file-Fig. 3A). But the total amount dosage of propofol was more in the Esk group throughout the endoscopy period (126.3 ± 58.0 vs 112.8 ± 50.4 mg, mean difference (95% CI) −13.47 (−26.04, −0.91), P = 0.036, Supplementary file-Fig. 3B). The time to complete endoscopy was 14.2 ± 7.9 min (Suf: 13.7 ± 7.5 min vs. Esk: 14.8 ± 8.3 min, P = 0.247).
Adverse reactions during PACU
At the end of the examination, the mean of the MOAA/S was 3.1 ± 1.6 in the Suf group and about 2.7 ± 1.7 in the Esk group (95% CI 0.19 (0.05, 0.81), P = 0.029, Fig. 3A). The difference in time from the end of the examination to recovery to MOAA/S at 5 points (Fig. 3B) and Aldrete over 9 points (Fig. 3C) was not statistically significant in the two groups. A total of 12 patients had adverse reactions during the PACU; all were mild adverse reactions, and all improved after symptomatic treatment. The adverse reactions observed in the PACU were mainly SpO2 reduction, low HR, hypotension, cough, dizziness, abdominal pain, and abdominal distension (Table 1).
Fig. 3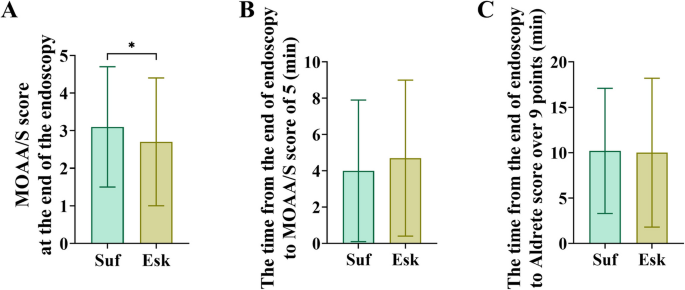
Comparison of the resuscitation state after anesthesia. Note: *P < 0.05, there was statistically significant, MOAA/S Modified Observer’s Assessment of Alertness/Sedation, min minutes. A MOAA/S score at the end of the examination. B Time from the end of examination to the patient recovery to MOAA/S at 5 (min). C Time from the end of examination to patient recovery to Aldrete over 9 points (min)
Table 1 Adverse reactions during PACUAdverse reactions that occurred within 24 h of hospital discharge
All adverse events at 24 h after leaving the hospital were mild to moderate (about 22.8%) and improved after rest or symptomatic treatment (Table 2). Among them, the most common adverse event was abdominal pain (14.1%), followed by dizziness (6.9%) and throat discomfort (2.4%). Compared with the Suf group (3.4%), patients in the Esk group had a higher incidence of dizziness (10.6%, P = 0.020).
Table 2 Adverse reactions that occurred within 24 hours of hospital dischargePatient satisfaction
Patient’s satisfaction in the two groups was 9.9 ± 0.4 (Suf) and 9.8 ± 0.6 (Esk), respectively (P = 0.136). About 33.1% of the patients experienced fatigue after examination (Suf 36.1%, Esk 30.5%, P = 0.382).