

Quantification of functional cis-variation
To focus on genetic differences affecting TF binding in cis, we quantified TF footprints (defined as the area significantly covered by MOA-seq reads) specific to each haplotype in F1 hybrids with a shared reference parent (B73) (Fig. 1a). We applied MOA-seq to nuclei of the inbred lines B73 (ref. 14) and Mo17—founders of key maize breeding populations whose hybrid has been extensively studied15,16,17—and their F1 hybrids. MOA footprints were determined by mapping sequencing reads to a concatenated hybrid genome and retaining reads that mapped uniquely (Supplementary Table 1; for some analyses we used reads mapping equally well to two locations; Methods). We detected 327,029 MOA footprints or peaks (false discovery rate (FDR) of 5%) with strong correlation across biological replicates (Pearson’s correlation coefficient > 0.95; Supplementary Fig. 1). A total of 53,220 genes in the F1, representing 67.9% of B73 and Mo17 annotated genes (5 kb upstream and 1 kb downstream; Supplementary Table 2) were flanked by at least one MOA footprint. Furthermore, the MOA footprints harbored 325,933 SNPs, which we termed MOA polymorphisms (MPs). Among all MPs, we identified 48,505 with an allelic ratio that significantly deviated from the expected 1:1 in F1s, which we termed allele-specific MPs (AMPs; binomial test with 1% FDR, validated with whole-genome sequencing (WGS) controls; Supplementary Fig. 2).
Fig. 1: Quantitative cis-element occupancy analysis in F1 hybrids.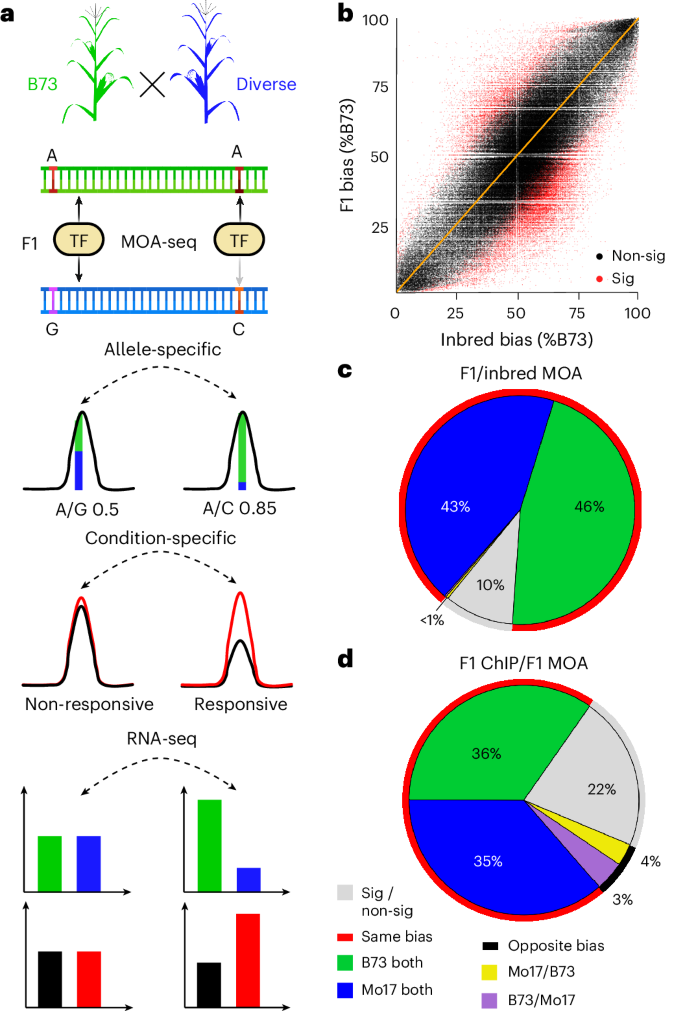
a, Haplotype-specific MOA flowchart: 1) Nuclei purified from diverse nested (B73 common mother) F1s are analyzed by MOA-seq, producing small, non-nucleosomal, protein–DNA interaction footprints. 2) SNPs in MOA peaks (MPs) allow the identification, quantification and, in a population, association of variants coupled to occupancy of putative cis-elements. Allele-specific MOA footprints can be compared between treatments; for example, well-watered versus drought. 3) Allele-specific mRNA-seq allows further characterization of functional variants associated with gene regulation. Created with Biorender.comb, Correlation of haplotype-specific MOA-seq data at all MPs in nuclei from B73 versus Mo17 inbreds (x axis) versus those from the F1 (y axis) (Pearson correlation, 0.78). MPs with significant (red, P < 0.05, expected trans) and without significant (black, expected cis) differences between F1 and parental alleles are marked. c, Genome-wide comparison of allelic bias (50–60% to one allele considered no bias, >60% considered biased) at B73 × Mo17 F1 AMP sites to inbred B73 versus Mo17 data. Only sites that displayed binding in both inbreds and hybrids were considered. d, Genome-wide directionality analysis, comparing AMPs detected by MOA-seq to ChIP–seq data of a single TF BZR1 (ref. 17) in the B73 × Mo17 hybrid. Only sites that displayed binding in both ChIP and hybrid MOA were considered. In c and d, MOA occupancy was largely consistent (red circle) between either F1 and parents or compared to ChIP–seq, respectively, in showing bias towards B73 (green) or Mo17 (blue) in both cases, with a smaller fraction of allele-specific F1 MOA sites showing no bias (gray) in inbreds or ChIP–seq, or bias to the opposite parent or allele (B73 in F1 and Mo17 in inbred or ChIP, purple or Mo17 in F1 and B73 in inbred or ChIP, yellow).
The vast majority (88% or 194,594 out of 221,187) of all MPs showed no significant difference in their allelic bias comparing F1 (B73 and Mo17 haplotypes) to B73 versus Mo17 inbred alleles (black dots in Fig. 1b), and about 90% (31,949 out of 35,638) of AMP sites in the B73 × Mo17 F1 showed bias towards the same allele as when comparing the inbred parents (red line in Fig. 1c). Fewer than 0.6% (199 out of 35,638) of AMP sites showed bias in the opposite direction. In the F1, allele-specific bias at AMPs should not be affected by trans-factors, biological or technical variation, as the relative haplotype differences originate from the same F1 cells. The high concordance between haplotype-specific bias in the F1 and inbreds at AMP loci is consistent with this expectation, further establishes the reproducibility of the assay and indicates that the majority of AMPs are coupled to genotypic differences in cis at the binding site, rather than resulting from trans-acting or cis-by-trans interaction effects. The fact that some differences are observed, however, underpins the importance of using F1 hybrids rather than inbred lines, in which trans-acting and cis-acting effects cannot be easily disentangled.
To independently validate haplotype-specific, MOA-defined, putative TF footprints in B73 × Mo17, we compared AMPs to recently published allele-specific ChIP–seq data of the major brassinosteroid TF ZmBZR1 in the same F1 (ref. 17). More than 70% of AMPs overlapping with ZmBZR1 binding sites showed allelic bias in the same direction in both studies (red line in Fig. 1d). About 22% of AMPs showed no bias in the ChIP–seq data, probably because of the lower resolution of haplotype-specific ChIP–seq (~500 bp fragments compared to ~65 bp for MOA-seq). Only 7% of AMPs showed bias for different alleles than in ChIP–seq, potentially reflecting biological differences in the tissues analyzed (meristem and leaf versus leaf) or ectopic BZR1 activity owing to exogenous brassinosteroid treatment17. Detailed comparison of MOA-seq occupancy to the ZmBZR1 ChIP–seq data demonstrates the accuracy and resolution of our approach, accurately predicting expression of downstream genes and enabling the identification of likely causal polymorphisms within the TF binding site (Extended Data Fig. 1 and Supplementary Note 1). Together, these examples illustrate the potential of MOA-seq to annotate candidate cis-regulatory elements with quantitative chromatin footprint data that connects cis-variation to biases in cis-element occupancy.
Defining functional sites in a maize pan-cistrome
To define a leaf pan-cistrome of maize, we analyzed a population of 25 F1 hybrids using haplotype-specific MOA-seq (Fig. 1a). The hybrid population, created by crossing 25 inbred lines with high-quality genome assemblies18,19,20,21 to the reference genome line B73, represents a diverse set of maize including many of the parents of an important mapping population and several important genetic stocks (Supplementary Table 3). We analyzed allele-specific TF occupancy and mRNA abundance in leaf blades of each F1 cross (Supplementary Tables 1 and 4). By aligning MOA-seq and RNA-seq reads to concatenated dual-reference genomes rather than a single reference, our approach resolves issues of reference bias that confound most allele-specific analyses22 (Fig. 2a; Methods). We identified an average of 237,000 MOA peaks (FDR, 5%) per F1, covering approximately 2% (around 80 Mbp) of each hybrid genome (Supplementary Fig. 4). On average, 19.9% (14–30%) of MPs showed a significant allelic bias (binomial test, FDR, 1%; Supplementary Table 5) with an overall even split between the parental alleles (50.2% B73 and 49.8% diverse parents; Supplementary Fig. 5 and Supplementary Table 5). It is noteworthy that the average rate of AMPs (19.9%) closely matches allele-specific TF binding sites detected by the gold standard of ChIP–seq for an individual TF (18.3%)17. In total, AMPs overlapped with 35.6% of all MOA footprint peaks in B73 (Fig. 2b), and plots of the identified MOA peaks and cumulative base pairs indicate that our diverse population is near saturation and has identified the majority of the B73 leaf cistrome (Supplementary Fig. 6).
Fig. 2: Construction of a maize leaf pan-cistrome.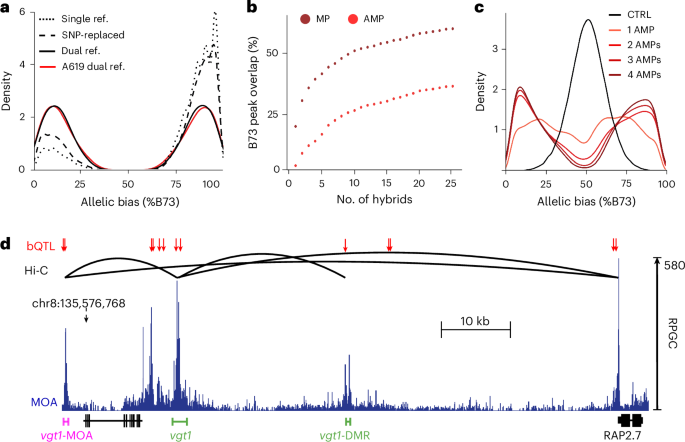
a, Mapping strategies comparison showing the density of AMPs (allele-specific occupied sites) over the percentage of binding to B73. B73 × HP301 F1 MOA data were analyzed using either only B73 as reference genome (single ref.), a pseudo-genome with B73/HP301 SNPs replaced by Ns (SNP-replaced) or our dual-parent mapping strategy using a concatenated B73 × HP301 genome (dual ref.). Without mapping bias, a symmetric distribution is expected (as observed for dual ref.), while a higher density at higher B73 allelic bias indicates biased mapping to the reference genome B73 (single ref. and SNP-replaced). For the A619 F1 (no assembled genome available), our ‘reference-guided’ strategy (see Methods for details) showed similar AMP-balanced haplotypes without reference bias (A619 dual ref.). b, Additive percent of B73 MOA peak covered by MPs (brown) and AMPs (red) relative to the number of F1s analyzed. c, Density of mean MOA binding frequencies over all F1s carrying a SNP at positions where at least one, two, three or four F1s had AMPs, compared to a control with randomized binding frequencies. d, Overview of bQTL (red arrows), MOA coverage (blue) and Hi-C interaction sites (black lines, Hi-C from a previous publication32) near the classical flowering repressor RAP2.7. bQTL overlap with both known enhancers, vgt1 and vgt1-DMR (green), associated with RAP2.7 expression. An additional bQTL, termed vgt1-MOA (magenta), also interacts with vgt1 and the RAP2-7 promoter.
We next sought to identify variants, genetic, epigenetic, or both, associated with differences in MOA-detected TF occupancy between haplotypes, or bQTL, in our population. We first verified that F1s that shared haplotypes at AMP loci also share similar patterns of allelic bias (Fig. 2c), indicating that our SNPs were in sufficient linkage disequilibrium with causal differences to perform association analysis. Differences in DNA methylation between parental alleles can affect TF binding affinity17,23. After validating that DNA methylation differences at AMPs detected between F1 haplotypes were consistent between the parental lines (Extended Data Fig. 2a,b), we added previously published methylation data for 24 of our parental lines18,19,20. We performed linear modeling to test all positions that are MPs (SNPs or INDELs in MOA peaks; Methods) in at least two lines for association of MOA signal variation with either the genotype information, DNA methylation level or both. We identified a total of 176,613 (147,942 SNP and 28,671 INDEL loci, FDR < 0.05; Supplementary Table 6) significant associations, termed bQTL, of which 93,682, 51,192 and 31,739 bQTL were a result of genotype variation alone, DNA methylation variation alone or both features, respectively (Extended Data Fig. 2c,d). As expected, the genome-wide distribution of bQTL was distinct from all SNPs and more closely matched those of previously published allele-specific TF binding sites determined by ChIP–seq17 (Supplementary Fig. 7). A notable bQTL includes an 8 bp (T/TTAGCGTGT) INDEL in the hypervariable region of the ZmBIF2 (Zm00001eb031760) promoter (Supplementary Note 1) at a site bound by multiple TF families12 (bZIP, EREB, bHLH, MYB and WRKY; Extended Data Fig. 3). Overall, we found that INDEL variants show patterns very similar to SNPs, with, for example, 63% of INDEL bQTL overlapping with a SNP bQTL within 65 bp. We thus focused our further analysis on the SNP bQTL while providing the INDEL bQTL to increase the resolution of the pan-cistrome map.
bQTL coincide with known, causative regulatory loci
Detailed analyses of regulatory variation for a number of maize genes provide an opportunity to compare bQTL to previously identified causal variation. One bQTL was directly adjacent to the YABBY TF binding site underlying the leaf architecture QTL upright plant architecture2 (ref. 24) (Zm00001eb073010) (Extended Data Fig. 3). bQTL also identified haplotype-specific footprints at flowering time loci, including the causative transposon insertions at ZmCCT9 (Zm00001eb391230) that was targeted by selection during maize adaptation to higher latitudes25,26, INDEL-2339 in the promoter of the FT-like ZmZCN8 (ref. 27) (Zm00001eb353250), a 850 bp structural variant in the promoter of ZmPHYB2 (ref. 28) (Zm00001eb396030) as well as multiple GWAS hits for flowering time (Extended Data Fig. 3). In addition to identifying bQTL in both of the known distal regulatory regions, vegetative to generative transition 1 (vgt1) and vgt1-DMR, of the key flowering time locus ZmRAP2.7 (refs. 29,30,31) (Zm00001eb355240), our bQTL analysis identified an undescribed, third putative enhancer more than 100 kb upstream, which we termed vgt1-MOA (Fig. 2d). Hi-C long-range interaction data32 confirmed that vgt1-MOA physically interacts with both vgt1 and the proximal ZmRAP2.7 promoter (Fig. 2d). However, future functional tests are needed to establish whether vgt1-MOA effects ZmRAP2.7 expression alone or in combination with vgt1 and/or vgt1-DMR.
We further observed that bQTL colocalized with the regulatory variation upstream of ZmGT1 (Zm00001eb007950), which is targeted by ZmTB1 (Zm00001eb054440), with the two forming a regulatory module involved in bud dormancy and growth repression33. bQTL coincide with the transposon-associated causal regulatory region for prolificacy (prol1.1) upstream of ZmGT1, including one bQTL directly adjacent to the TB1 binding site34 (Supplementary Fig. 8).
Our MOA-seq pan-cistrome also provides an opportunity to evaluate how variation at these sites compares to changes in cis-element occupancy. For example, an INDEL in the TREHALASE1 (ZmTRE1, Zm00001eb021270) promoter has been associated with both trehalose amounts and ZmTRE1 transcript levels in maize35. We observed haplotype-specific footprints, both at a previously reported 8 bp insertion35 and an additional SNP 29 bp upstream, which coincided with a bQTL (Supplementary Fig. 9). Notably, although the 8 bp insertion creates a potential ABI motif (TGCCACAC), the ZmTRE1-bQTL overlaps with a DOF binding motif (AAAAGGTG). Previously published ChIP–seq results confirm that the ZmTRE1-bQTL site is targeted by ZmDOF17 (ref. 12) (Supplementary Fig. 9). Furthermore, all alleles (6 out of 6) in our F1 population without the 8 bp insertion and with the non-canonical DOF motif (C instead of G) at the bQTL site showed concomitant low MOA signal (strong bias towards B73’s G allele) and ZmTRE1 mRNA levels (higher B73 mRNA level) (Fig. 3a,b). In another example, ZmSUBTILISIN11 (ZmSUB11, Zm00001eb152020) has been associated with cell wall compositions, peduncle vascular traits and abscisic acid (ABA) levels36,37. A previously identified cis-expression QTL lead SNP for ZmSUB11 transcript levels38 coincided with a bQTL in its proximal promoter, and we observed a strong correlation of haplotype-specific MOA footprints at the bQTL and ZmSUB11 transcript levels (Fig. 3a,b).
Fig. 3: bQTL correlate with haplotype-specific transcript variation.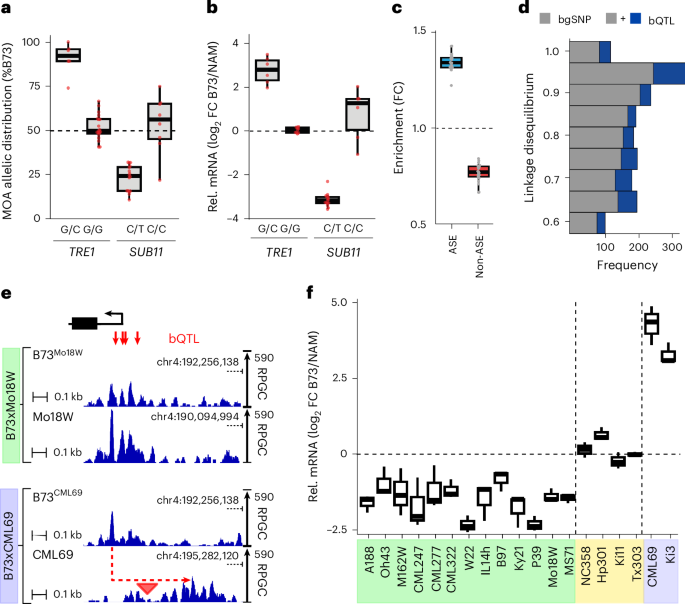
a, Allelic distribution (%B73) of MOA reads at bQTL in either the TRE1 (Zm00001eb021270, bQTL: B73-chr1:80,826,022) or SUB11 (Zm00001eb152020, bQTL B73-chr3:198,733,446) proximal promoters (TRE1: 19 F1s with G/G and six F1s with G/C alleles; SUB11: eight F1s with C/C and 16 F1s with C/T alleles). b, Haplotype-specific mRNA counts for TRE1 and SUB11 grouped by their respective bQTL alleles in a (TRE1: nine F1s with G/G and six F1s carrying G/C alleles; SUB11: six F1s with C/C and 15 F1s with C/T alleles). Only lines with polymorphic alleles were considered. FC, fold change. c, Genes with ASE and non-ASE mRNA abundance are significantly more and less enriched for AMPs in their 3 kb upstream promoter, respectively (n = 24 F1s, hypergeometric test; Supplementary Table 7a–c). d, bQTL are more often in linkage disequilibrium with cis-expression QTL, identified in roots of 340 recombinant inbred lines than matched bgSNPs. e, Average, normalized MOA coverage for B73 and NAM alleles of B73 × Mo18W and B73 × CML69 upstream of PGM1, Zm00001eb196320. The Mo18W allele showed significantly higher MOA occupancy (green panel), while the CML69 allele showed similar MOA coverage to B73, yet peaks were shifted ~300 bp because of a MITE transposon (red triangle) insertion (purple panel). f, Allele-specific mRNA counts (n = 3 biological replicates) of PGM1 in the different F1 hybrids. Colors indicate MOA ratios at bQTL: NAM > B73 (green, >60% bias to NAM, non-B73 allele for at least one bQTL), B73 = NAM (yellow, %B73 occupancy between 40% and 60%, sharing B73 genotype) and transposon insertion haplotype (purple). All F1s within the NAM > B73 and transposon category displayed significantly higher or lower mRNA levels in the NAM allele compared to B73, respectively (detected by DESeq2; Methods), while none of the B73 = NAM category were significantly different. Boxplots in a, b, c and f denote the range from the first to the third quartile, lines within boxes indicate the median and whiskers represent 1.5-fold of the interquartile range.
MOA bQTL correlate with transcript levels
If variation in MOA coverage accurately captures TF binding affinity, we would expect to see associations between haplotype-specific MOA coverage and transcript abundance in our F1s. Indeed, we find that the promoters (within 3 kb upstream of the transcription start site (TSS)) of genes with significant allele-specific expression (ASE, P < 0.05; Methods) were ~34% and ~74% enriched for the presence of AMPs compared to all expressed and non-haplotype-specific (non-ASE, P > 0.95) expressed genes, respectively (Fig. 3c, Supplementary Table 7a–c and Supplementary Fig. 10). Genotype-associated bQTL were also substantially more likely to be in high linkage disequilibrium (>0.6) with nearby cis-expression QTL in a panel of 340 maize genotypes38 than matched background SNPs (bgSNPs) (49.1% more intergenic bQTL relative to bgSNPs (456/306) and 28.2% more total bQTL versus bgSNPs (1,775/1,384), respectively) (Fig. 3d). These broad patterns are reflected at the level of individual genes as well. For example, all of the NAM parents showing greater MOA occupancy at the bQTL upstream of PHOSPHOGLYCERATE MUTASE1 (ZmPGM1, Zm00001eb196320) showed significantly increased abundance of the NAM transcript, whereas F1s with no polymorphism between B73 and NAM in their promoter or 5′ untranslated region showed no significant difference in haplotype-specific transcript levels (Fig. 3e,f). Two NAM parents, Ki3 and CML69, showed much lower PGM1 transcript levels (Fig. 3f), while no significant variation in MOA footprint was detected. Instead, Ki3 and CML69 harbored a PIF/Harbinger transposon insertion accompanied by hypermethylation between the MOA peak and PGM1 TSS, not found in any of the haplotypes (including B73) with higher PGM1 transcript levels (Fig. 3e,f and Supplementary Fig. 11).
Variation in DNA methylation can predict MOA occupancy
The vast majority of TFs in Arabidopsis have been shown, in vitro, to have higher binding affinity to hypomethylated DNA23. We explored this association in our data, focusing on variation in CG and CHG methylation (mCG/mCHG), as they accounted for >99.8% of methylation differences at MOA sites. DNA methylation differences (following a previous publication39, one allele <10% methylated and the other >70%) overlapped with 14.8% of MPs in the F1s. At AMPs, haplotype-specific mCG/mCHG overlap increased by 2.6-fold (38.1%) and reached more than half (51.5%) for AMPs with a strong haplotype-bias (≥85% to one allele) (Fig. 4a). We observed a very strong correlation between a higher footprint occupancy and the hypomethylated allele (Fig. 4b), with 98.2% of AMPs showing higher MOA coverage at the hypomethylated allele. Furthermore, nearly half of the remaining 1.8% AMPs biased towards hypermethylation alleles did not display methylation difference immediately surrounding the AMP (11 bp window), intimating that there may be no actual methylation difference at the occupied site despite hypermethylation of the surrounding region (41 bp window) (Supplementary Fig. 12). On average, the vast majority (71.2%) of F1s that shared differentially methylated alleles at a given locus also shared haplotype-specific MOA footprints at that site, compared to only 42.9% of the F1s with shared equally methylated alleles at that same site (Fig. 4c). The observed strong correlations between differential CG and CHG methylation and haplotype-specific MOA occupancy confirm an important role for DNA methylation in determining TF binding in maize.
Fig. 4: bQTL are linked to variation in DNA methylation.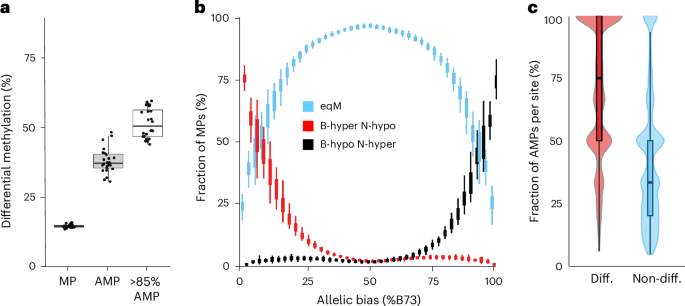
a, Genome-wide overlap of differentially methylated (CG and/or CHG) DNA regions with MPs, AMPs and AMPs with strong (≥85%) allelic bias, across the 24 F1s. b, Correlation of differentially CG-methylated DNA with allelic bias for MPs in the 24 F1 hybrids. MP methylation categories: equally methylated (eqM), B73 hypermethylated versus NAM hypomethylated (B-hyper N-hypo) or B73 hypomethylated versus NAM hypermethylated (B-hypo N-hyper). c, Correlation between MOA footprint bias and differential methylation at loci that varied both in allele-specific footprint occupancy (≥1 F1s with AMP) and CG methylation (≥2 F1s with and without allele-specific methylation difference) between the 24 F1s. At each position, F1s were partitioned into those with either differential allelic CG methylation (red) or equal CG methylation (blue). Box and violin plots were drawn for the two categories, showing the distribution of percentages of F1s with haplotype-specific binding (AMPs). n = 24 F1s in a, b and c; boxplots were generated as in Fig. 3.
MOA bQTL explain a large portion of heritable variation
Regulatory variation is thought to underlie a significant proportion of phenotypic variation in maize40. To assess the relationship between bQTL and complex trait variation, we first quantified the enrichment of genotype-associated bQTL surrounding GWAS hits (lead SNP ± 100 bp) across two curated datasets of 41 and 279 traits40,41. Given that bQTLs showed a genome-wide distribution distinct from all SNPs (Supplementary Fig. 7), with bQTL located closer to genes, we generated a background dataset to match this distribution (similar allele frequency and distance to the nearest gene, 100 permutations; Methods) to avoid any bias caused by location in the genome. For both GWAS datasets tested, bQTL were approximately twofold (1.75-fold and 2.17-fold, respectively) enriched for co-localization with GWAS hits compared to the matched bgSNPs (Supplementary Fig. 13). This enrichment remained stable as a function of distance to the nearest gene, indicating comparable efficacy of bQTL to mark functionally significant loci genome-wide (Fig. 5a). To explore the degree to which bQTL can more broadly capture the genetic variation underlying phenotypic diversity, we partitioned heritable trait variance for 143 traits in the NAM population (Methods and previous publications2,17). We modeled additive genetic variation for traits as a function of three genomic relatedness matrices. Variances estimated this way for several trait datasets simulated from matrices highly similar to our observed matrices accurately reflected the proportional contributions of each SNP set (Supplementary Fig. 14). Across a large majority of phenotypes in the NAM panel (103 of 143 or ~72%), bQTL associated with genotype alone (that is, excluding methylation, 78,398 bQTL) explained the majority of the total additive genetic variance captured by SNPs (Fig. 5b, Supplementary Fig. 15 and Supplementary Table 8). Consistent with previous findings that open chromatin and TF binding, found at a higher frequency close to genes, have a key role in trait variation2,17, our matched bgSNPs (matched allele frequency and distance to the nearest gene compared to bQTL) often accounted for more additive genetic variation than SNPs from the rest of the genome (that is non-bQTL, non-matched bgSNPs; 121 out of 143 traits), but bQTL also outperformed bgSNPs for most traits (81.1%, 116 traits; Fig. 5b). The inclusion of bQTL with additional significantly associated differential methylation (105,398 bQTL) slightly decreased the variation explained (Supplementary Fig. 16). This is consistent with theoretical arguments that epigenetic variation, which is highly labile on an evolutionary timescale, cannot explain much heritability for phenotypes42. Traits for which bQTL explained the largest portion of genetic variance included plant height, leaf size or shape and disease resistance, whereas almost all traits related to, for example, vitamin E production were best explained by the bQTL-matched bgSNPs or the remaining SNPs from the rest of the genome (Fig. 5c), probably because of the oligogenic nature of the vitamin E traits and that bQTL identified in leaf tissue may not be representative of regulatory patterns in genes specifically expressed in kernels43.
Fig. 5: A large fraction of heritability is explained by bQTL.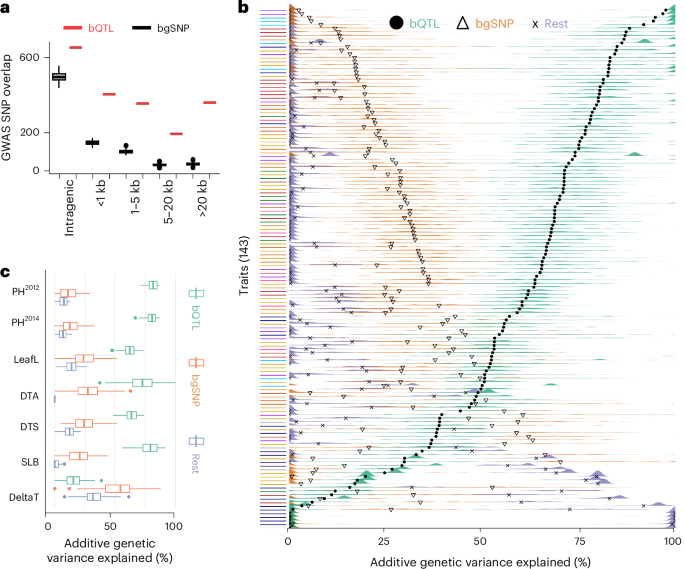
a, Association of ~42,000 curated GWAS hits41 (±100 bp) with bQTL (only those associated with genotype alone), or n = 100 bootstraps of matched bgSNPs (same bgSNP sets used as for VCAP; Methods) at distances ranging from intragenic to >20 kb to the nearest gene. b, Estimated additive genetic variance organized by 143 traits. Colored ridges show the estimated additive genetic variance across 100 permutations for either bQTL, bgSNPs or remaining genome SNPs. Black symbols represent the mean estimated value across permutations. Traits are arranged by bQTL mean variance estimates and color-coded according to general trait groupings: vitamin E metabolites, navy blue; metabolites, purple; stalk strength, light blue; flowering time, gold; plant architecture, red; disease, green; tassel architecture, pink; ear architecture, orange; miscellaneous, gray. c, A subset of traits (y axis) and their estimated percent additive genetic variance (x axis) shown as colored box plots instead of ridges. PH, plant height51,52; LeafL, leaf length51; DTA, days to anthesis51,52; DTS, days to silking51; SLB, southern leaf blight53,54; and delta-tocopherol concentration, vitamin E biosynthesis43; n = 100 permutations. Boxplots in a and c were generated as described in Fig. 3; data outside the whisker range are considered outliers.
Characterization of a drought-responsive cistrome
To evaluate differences in cis-element regulation induced by changes in environmental conditions, we compared the morphological and molecular response of our F1 population under well-watered (WW) and drought-stress (DS) conditions. We observed diverse drought responses, with reductions of relative leaf water content of 3–30% and remaining soil water contents of 6.3–25.6%, depending on the F1 (Fig. 6a,b, Supplementary Fig. 17 and Extended Data Fig. 4). Haplotype-specific MOA-seq and RNA-seq of WW and DS samples for all 25 F1s revealed on average 287,844 MPs and 56,863 AMPs under DS, slightly less than for WW conditions (Supplementary Table 5), and a similar correlation with allele-specific transcript abundance (Supplementary Fig. 10). MOA peaks showing significant (P < 0.05) drought-induced increases or decreases in occupancy varied substantially among F1s, ranging from ~9,000 to 40,000 and 16,000 to 90,000, respectively (Supplementary Table 9). Local association mapping identified 124,504 DS-bQTL for SNPs and 23,554 for small INDELs under drought conditions (Supplementary Table 10), for a combined total of 206,368 unique SNP bQTL in DS and/or WW. To identify candidate drought-response loci, we selected bQTL with drought-responsive occupancy near genes (5 kb upstream or 1 kb downstream) that displayed both haplotype-specific and drought-responsive transcript accumulation, resulting in 1,025 (655 genes) and 2,604 (1,548 genes) bQTL with increased and decreased occupancy, respectively. Further integration with drought-response GWAS and cis-expression QTL hits44,45,46 resulted in high-confidence candidates (Supplementary Table 11). Notably, the candidate list included known drought-tolerance-related genes, such as ZmNAC111 (Zm00001eb405590). Haplotype-specific MOA footprinting identified multiple DS-bQTL upstream and downstream of ZmNAC111, including adjacent to the causative 84 bp MITE transposon insertion site, which reduces both ZmNAC111 expression and drought tolerance in maize seedlings, probably through RNA-directed DNA methylation47 (Supplementary Fig. 18). Another interesting DS-bQTL was located within the previously discovered 119 bp proximal promoter fragment required for the drought-response of SULFITE OXIDASE1 (ZmSO, Zm00001eb036560), a gene linked to the ABA response and drought tolerance of maize seedlings48. Although none of our haplotypes contained the putative Myb-binding site (CAGTTG) previously linked to drought-response in the 119 bp ZmSO promoter48, we nonetheless found a strong correlation between increased MOA occupancy for the C allele at the bQTL and elevated ZmSOB73 transcript levels, both under WW and DS conditions (Fig. 6c,d). We also observed a strong correlation between MOA occupancy and drought-induced transcript levels at DS-bQTL in the proximal promoter of the maize homolog of aquaporin BETA-TONOPLAST INTRINSIC PROTEIN 3 (ZmTIP3d, Zm00001eb076690; Fig. 6e,f), which has been linked to drought-response in various plants49.
Fig. 6: Characterization of a drought-responsive cistrome.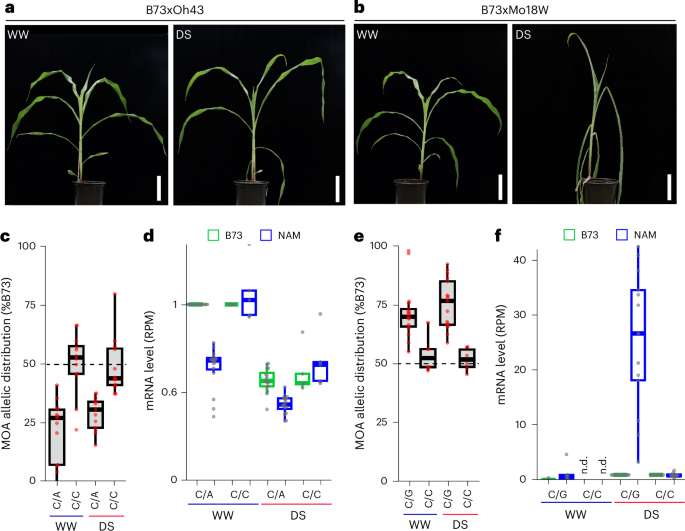
a,b, Morphological phenotypes of the more tolerant B73 × Oh43 (a) and susceptible B73 × Mo18W (b) F1s grown under WW and DS conditions. Scale bars, 10 cm. c, Allelic distribution of MOA read coverage at bQTL (B73-chr1:198,205,029) in the ZmSO promoter. The six F1s sharing the B73 allele (C/C) were compared to 17 F1s carrying C/A alleles. d, Haplotype-specific mRNA counts, normalized to the B73 WW allele, grouped by the ZmSO bQTL alleles shown in c. Haplotype-specific read counts (reads per million (RPM), also adjusted for differences in SNP counts between F1s) relative to the B73 allele WW level to allow count comparisons between F1s (n = 21 F1s with gene polymorphism to permit haplotype-specific analysis, 5 C/C and 16 C/A alleles). e, Allelic distribution of MOA reads at a bQTL (B73-chr2:28,118,442) in the ZmTIP3d promoter. The 12 F1s sharing the B73 allele (C/C) were compared to 13 F1s carrying C/G alleles. f, Haplotype-specific mRNA abundance grouped by the ZmTIP3d bQTL alleles shown in e. RPM values per haplotype are normalized to the B73 DS mRNA level (n = 23 F1s that permitted haplotype-specific MOA/RNA analysis: DS, 10 C/C, 13 C/G; WW: 5 C/C, 5 C/G). n.d., not detected. Boxplots in c, d, e and f were generated as described in Fig. 3.
To further test the correlation of DS-bQTL and drought-responsive promoter activity, we analyzed the maize homolog of the Arabidopsis drought-inducible AP2/ERF TF AtTINY independently in a transient expression assay. Over-expression of AtTINY increases drought tolerance at the cost of severely stunted growth, a limitation often observed with drought-related TFs50. The maize homolog of ZmTINY (Zm00001eb120590) is a candidate gene for drought response and leaf size variation45. We found DS-bQTL in multiple MOA footprints surrounding ZmTINY, which showed significantly higher occupancy in, for example, CML333 and Oh43 compared to B73 under drought (ranging from 1.4-fold to 5.5-fold higher; Fig. 7a and Extended Data Fig. 5). Similarly, higher MOA occupancy under DS for CML333 and Oh43 compared to B73 was also observed downstream of ZmTINY (Extended Data Fig. 5). These variations in MOA footprints were correlated with allele-specific transcript levels of ZmTINY. In F1s under DS conditions, mRNA transcripts of the CML333 and Oh43 alleles were 84-fold and 18-fold more abundant than B73 transcripts, respectively (Fig. 7b and Extended Data Fig. 5). MOA signals in the B73 and CML333 upstream promoter showed the highest correlation to ZmTINY mRNA levels (Extended Data Fig. 5). We tested these sequences in a dual-luciferase expression assay with and without ABA treatment to simulate DS. Both promoter fragments exhibited significantly higher LUC/REN ratios than the vector control. Consistent with trends observed for MOA and mRNA levels (Fig. 7b,c), prom::ZmTINYCML333 showed a higher LUC/REN ratio than prom::ZmTINYB73 under WW conditions, and exogenous application of 1 µM and 10 µM ABA further increased the LUC/REN ratio significantly for protoplasts harboring the prom::ZmTINYCML333 but not prom::ZmTINYB73 fragment by 41.4% and 60.3%, respectively. Together, the results support previous findings of ZmTINY as a drought candidate gene and indicate that bQTL can identify cis-regulatory regions that act condition-dependently. That said, the drought-responsive regulation of ZmTINY may include additional regulatory sequences, such as the drought-responsive loci downstream.
Fig. 7: MOA-seq detects drought-responsive cis-regulatory loci.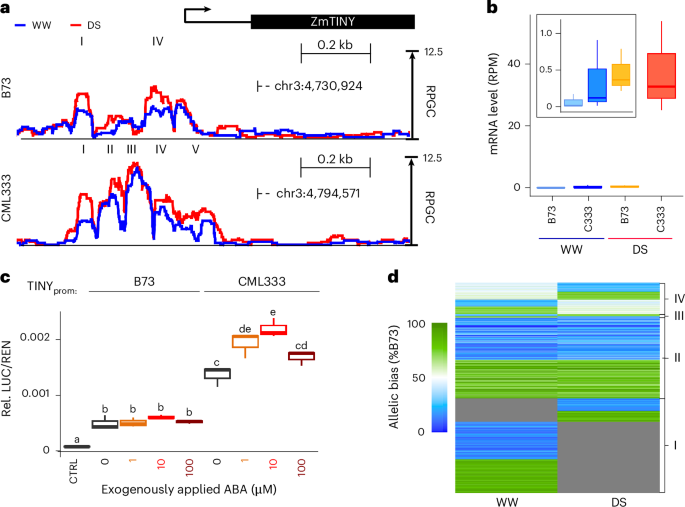
a, Average (three biological replicates), normalized MOA coverage for B73 × CML333 near ZmTINY under WW and DS conditions. Roman numerals highlight respective DS-peak regions identified (P < 0.05, MACS3) in each line. b, Haplotype-specific mRNA counts of ZmTINY for B73 × CML333 (C333) under WW and DS conditions (three biological replicates). The zoomed-in square highlights (left to right) WW-B73, WW-CML333 and DS-B73. c, Relative luciferase levels in maize leaf protoplasts harboring either ~0.5 kb of the B73 or CML333 proximal promoter allele upstream of the ZmTINY TSS, with and without 1–100 µM ABA treatment. Letters represent significant differences (P < 0.05, ANOVA with Tukey test; Source data). d, Heatmap of MOA allelic bias at AMP loci under WW and DS conditions. AMPs (under WW, DS or both) in drought-responsive MOA peaks (P < 0.05; Methods) are displayed for B73 × Oh43. Color scale ranging from green (100% bias towards B73) to blue (100% bias towards Oh43); gray represents MOA signal below the detection limit (MACS3; Methods). Clusters represent (I) allele-specific occupancy in one condition and below detection limit in the other, (II) allele-specific occupancy with consistent bias under both conditions, (III) allele-specific occupancy with bias in the opposite direction under the two conditions and (IV) occupancy with a significant allele-specific bias under only one condition. Only sites with significant allele-specific bias (binomial testing, FDR, 1%; for details see Methods) in at least one condition were considered. To avoid additional statistical cut-off effects for the second condition, 60% or more occupancy bias towards one allele was considered allele-specific. Boxplots in b and d were generated as described in Fig. 3.
Differences in MOA-seq coverage between WW and DS conditions at allele-specific sites could be caused by changes in occupancy level, the direction of allelic bias or a combination thereof. To better understand which scenario is more common, we clustered drought-responsive AMPs in the B73 × Oh43 F1 (11,970 AMPs located in drought-responsive footprints). The results showed that 83% of drought-responsive AMPs changed MOA occupancy between WW and DS conditions, either from no detectable MOA signal to haplotype-specific binding (~45%, group I), or in the amount of MOA coverage between WW and DS conditions while maintaining their allelic bias (~38%, group II) (Fig. 7d). By contrast, only about 17% of AMPs showed bias changes, either from no significant bias in one condition to a significant bias in the other (~15%, group IV) or changing the direction of the allelic bias (~2%, group III) (Fig. 7d). Although groups I and IV are somewhat dependent on statistical cut-offs (peak calling and thus AMP definition and/or calling allelic bias), groups II and III show an allele-specific bias under both conditions. Focusing on groups II and III, it becomes evident that changes in allelic bias are ~20-fold less frequent compared to the constant binding bias accompanied by overall changes in MOA signal. Similar clusters between WW and DS conditions were observed for AMPs in all 25 F1s (Supplementary Fig. 19). We therefore propose that the majority of DS-induced TF occupancy dynamics at sites of functional genetic variation results from condition-specific TF abundance changes rather than changes in allelic bias between WW and DS conditions.