
The final dataset included 145,609 products, comprising beverages and 10 food categories of processed consumer packaged goods (see Methods and Supplementary Table 2 for category definitions). All analyses refer to this sample unless otherwise noted.
Nutritional quality of food and beverages by category
Table 1 summarizes the nutritional quality of food and beverage products by category, as assessed using the NPM. It reports the number of new products, the average NP score, the share of products classified as less healthy under the NPM and component score breakdowns: A points reflect components the model aims to limit and C points reflect components the model aims to encourage.
Table 1 Nutritional quality of food and beverages by category, 2015–2024
Categories such as Snacks, Meals and Side Dishes, Condiments and Bakery account for the largest number of product launches. Processed Fruit and Vegetables has the lowest average NP score (−4.85) with only 2.18% classified as less healthy, reflecting the lowest A points among all food categories, and the highest adjusted C points. Beverages follow (mean −0.34 with 32.36% classified as less healthy), reflecting relatively low levels of components to limit. In contrast, products in the Candy, Snacks, Desserts and Ice Cream, and Bakery categories show the highest NP scores (18.39, 12.65, 11.63 and 14.06), with 93.24%, 90.38%, 83.79% and 80.76% of products classified as less healthy, respectively. Meals and Side Dishes lies near the NPM threshold, reflecting lower total sugar and higher protein alongside higher sodium content.
Trends in on-package claims and product nutritional quality
Figure 1 presents yearly trends in nutritional quality and the prevalence of the four types of on-package claim from 2015 to 2024. These claims remained pervasive throughout the decade, with over half of all new products carrying at least one claim, peaking at 61.1% in 2019 and 2020 before declining slightly to 54.5% in 2024. Natural claims were the most prevalent, followed by Minus and Plus claims, while Functional claims remained comparatively rare. Minus claims declined from 30.6% in 2015 to 19.6% in 2024.
Fig. 1: Trends in on-package claims and product nutritional quality.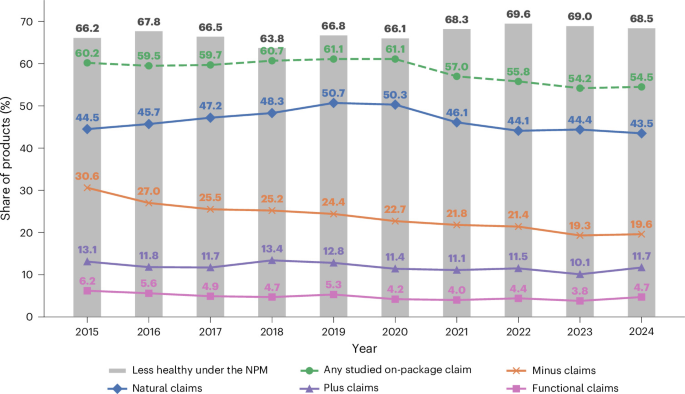
Yearly trends in nutritional quality and the prevalence of the four on-package claim groups from 2015 to 2024. Grey bars show the annual percentage of products classified as less healthy under the NPM (NP score ≥4 for foods; NP score ≥1 for beverages). Coloured lines show the annual percentage of products carrying at least one studied claim overall or at least one claim in each of the Minus, Plus, Natural and Functional groups.Source data are provided in Source Data Fig. 1.
Despite this widespread use of on-package claims, about two-thirds of products were classified as less healthy under the NPM. At the market level, the high prevalence of claims therefore coexisted with a high prevalence of products with less favourable overall nutritional quality.
Prevalence of on-package claims by product category
The heatmap in Fig. 2 shows claim prevalence by category. Claim prevalence varies systematically across categories, with Breakfast Cereals, Beverages and Snacks exhibiting higher prevalence, and Candy, Desserts and Ice Cream, and Bakery showing lower levels. Minus claims (for example, ‘Low/No/Reduced Calorie’ and ‘No Added Sugar’) are concentrated in Beverages, Plus claims (for example, ‘High/Added Fibre’ and ‘Vitamin/Mineral Fortified’) are concentrated in Breakfast Cereals and Beverages, Natural claims (for example, ‘Whole Grain’, ‘GMO Free’ (GMO, genetically modified organism) and ‘Organic’) are the most common across categories and Functional claims (for example, ‘Cardiovascular Health’ and ‘Antioxidants’) remain rare but are concentrated in Breakfast Cereals and Beverages.
Fig. 2: Prevalence of on-package claims by product category.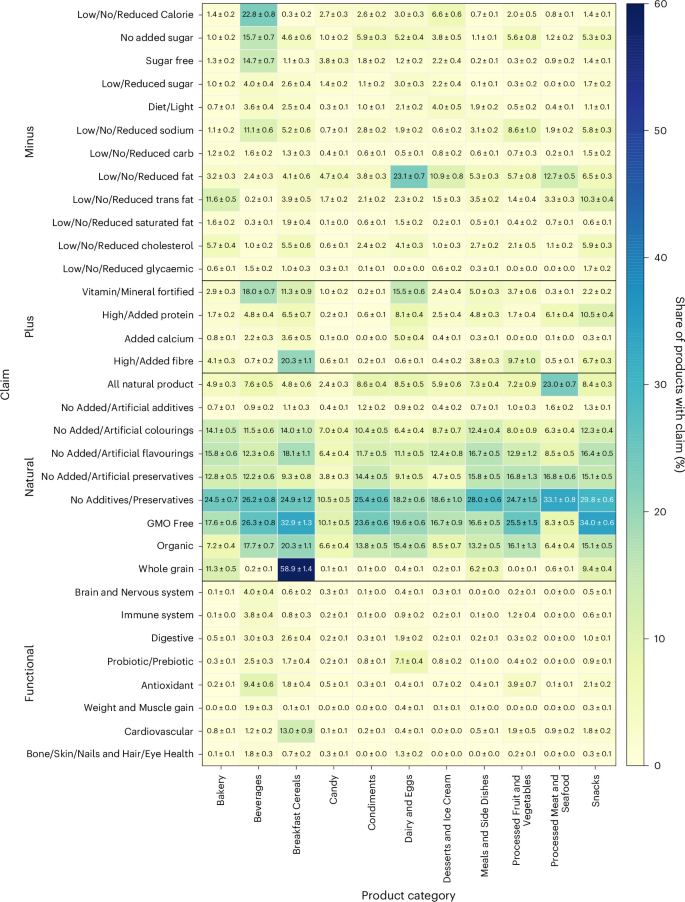
The heatmap shows the prevalence of specific claims, organized into Minus, Plus, Natural and Functional claim groups, across product categories. The colour intensity, from light yellow (lower prevalence) to dark blue (higher prevalence), represents the percentage of products carrying each claim. Each cell reports the estimated percentage and its normal-approximation 95% confidence-interval as estimate ± margin. Horizontal black lines separate the four claim groups. Source data are provided in Source Data Fig. 2.
Among products with claims, the average is 2.8 claims per product. Natural claims are most frequent, while Plus claims are less common. Breakfast Cereals (3.3), Beverages (3.1), Bakery (3.0) and Snacks (3.0) show the highest density, while Candy (2.3), Desserts and Ice Cream (2.5), and Condiments (2.5) have lower claim density. These patterns indicate substantial variation in both claim prevalence and density across categories. Supplementary Fig. 1 provides additional details on claim prevalence and density by claim type and category.
Discrepancy of on-package claims and nutritional quality of products
The alignment between claims and nutritional quality for food and beverages is examined in Figs. 3 and 4. A discrepancy is defined as a statistically significant (at the 5% level or better) difference in which products carrying a given claim have higher NP scores than those without the claim, whereas alignment is defined as a statistically significant difference in which products carrying the claim have lower NP scores than those without the claim. Differences that are not statistically significant are classified as having no significant difference.
Fig. 3: On-package claims and NP scores of food products.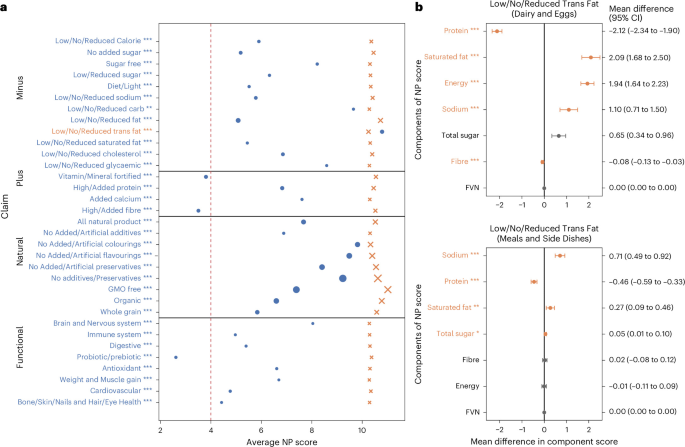
a, NP scores by claim status at the market level, comparing products with and without each claim. Blue dots and orange crosses show mean NP scores among products with and without each claim, respectively. Marker size represents claim prevalence, defined as the percentage of all food products carrying each claim. Orange claim labels with asterisks indicate discrepancy, that is, products with the claim have significantly higher, less favourable NP scores. Blue labels with asterisks indicate alignment, that is, products with the claim have significantly lower, more favourable NP scores. The red dashed line marks the NPM less healthy threshold for foods (NP score ≥4). b, Nutrient contributions to discrepancy within categories. The forest plots show the mean differences in NPM component scores (defined as with claim minus without claim); dots and whiskers show the mean differences and 95% Wald confidence intervals, respectively, with numerical estimates reported on the right. Orange indicates a statistically significant contribution towards a less favourable NP score (a higher A-point component or lower C-point component), and grey indicates a difference that is not statistically significant. Components are ordered by the absolute magnitude of their signed contribution. For Low/No/Reduced Trans Fat, the sample sizes with and without the claim are n = 339 and n = 14,200 in Dairy and Eggs and n = 749 and n = 20,469 in Meals and Side Dishes, respectively. FVN, fruit, vegetables and nuts. In a and b, the unit of analysis is a unique newly launched product. Asterisks indicate unadjusted two-sided Wilcoxon rank-sum (Mann–Whitney U) tests (*P < 0.05, **P < 0.01, ***P < 0.001). Exact P values, U statistics and group-specific sample sizes are provided in the Source Data Fig. 3.
Fig. 4: On-package claims and NP scores of beverage products.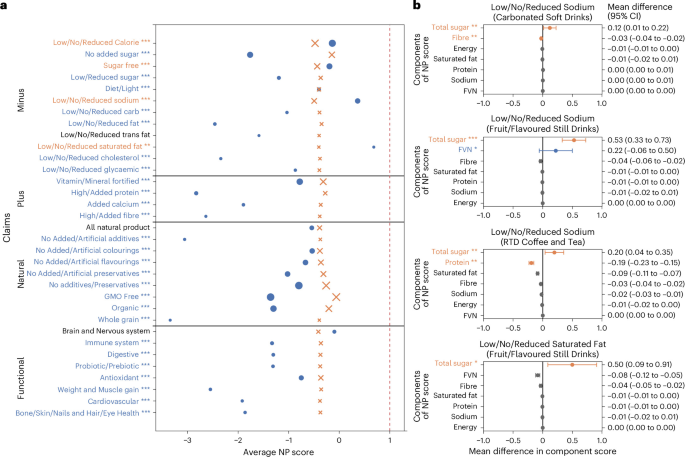
a, NP scores by claim status at the market level, comparing products with and without each claim. Blue dots and orange crosses show mean NP scores among products with and without each claim, respectively. Marker size represents claim prevalence, defined as the percentage of all beverage products carrying each claim. Orange claim labels with asterisks indicate discrepancy, that is, products with the claim have significantly higher, less favourable NP scores. Blue labels with asterisks indicate alignment, that is, products with the claim have significantly lower, more favourable NP scores. Black labels without asterisks indicate no statistically significant difference. The red dashed line marks the NPM less healthy threshold for beverages (NP score ≥1). b, Nutrient contributions to discrepancy within categories. The forest plots show the mean differences in NPM component scores (denoted as with claim minus without claim); dots and whiskers show the mean differences and 95% Wald confidence intervals, respectively, with numerical estimates reported on the right. Orange indicates a statistically significant contribution towards a less favourable NP score (a higher A-point component or lower C-point component), blue indicates a statistically significant contribution towards a more favourable score and grey indicates a difference that is not statistically significant. Components are ordered by the absolute magnitude of their signed contribution. For Low/No/Reduced Sodium, the sample sizes with and without the claim are n = 439 and n = 1,802 in Carbonated Soft Drinks, n = 69 and n = 1,082 in Fruit/Flavoured Still Drinks, and n = 56 and n = 1,627 in Ready-to-Drink (RTD) Coffee and Tea, respectively. For Low/No/Reduced Saturated Fat in Fruit/Flavoured Still Drinks, n = 13 products have the claim and n = 1,138 do not. In a and b, the unit of analysis is a unique newly launched product. Asterisks indicate unadjusted two-sided Wilcoxon rank-sum (Mann–Whitney U) tests (*P < 0.05, **P < 0.01, ***P < 0.001). Exact P values, U statistics and group-specific sample sizes are provided in Source Data Fig. 4.
Figures 3a and 4a present market-level comparisons between products with and without each claim, reflecting the overall product environment faced by consumers. For food, most claims are aligned, except for ‘Low/No/Reduced Trans Fat’. For beverages, patterns are more heterogeneous, with four claims exhibiting discrepancy: Low/No/Reduced Calorie, ‘Sugar Free’, ‘Low/No/Reduced Sodium’ and ‘Low/No/Reduced Saturated Fat’.
To disentangle these patterns, we conducted within-category analyses (Supplementary Fig. 2 for food and Supplementary Fig. 3 for beverages) and classified claims into four groups based on discrepancy status at both the market-wide and within-category levels: (1) market-wide and within-category discrepancy, (2) market-wide discrepancy only, (3) within-category discrepancy only and (4) no discrepancy. These classifications are summarized in Extended Data Tables 1 and 2.
Figures 3b and 4b present component analyses for claims exhibiting both market-wide and within-category discrepancy, focusing on the categories in which these discrepancies arise. Figure 3b focuses on Dairy and Eggs and Meals and Side Dishes for Low/No/Reduced Trans Fat. In Dairy and Eggs, higher NP scores reflect lower protein and higher saturated fat, energy and sodium, while in Meals and Side Dishes, discrepancy reflects higher sodium and saturated fat. Figure 4b shows that Low/No/Reduced Sodium discrepancy arises in Carbonated Soft Drinks, Fruit/Flavoured Still Drinks, and Ready-to-Drink (RTD) Coffee and Tea, driven mainly by higher total sugar. Low/No/Reduced Saturated Fat discrepancy arises in Fruit/Flavoured Still Drinks, where higher sugar offsets reductions in saturated fat. Overall, reductions in targeted nutrients are often offset by less favourable changes in other components.
However, alignment does not imply that products avoid classification as less healthy under the NPM. Many products with aligned claims still exceed the NPM thresholds, as indicated by the vertical cut-off lines in figures 3b and 4b, suggesting that relative improvements do not necessarily move products below the less healthy cut-off. This is particularly evident for most aligned claims in food categories, with limited exceptions for certain nutrient- and function-specific claims (for example, Vitamin/Mineral Fortified, High/Added Fibre and ‘Probiotic/Prebiotic’).
Discrepancy is observed across multiple categories, including Meals and Side Dishes, Processed Fruit and Vegetables, and Condiments, with little to no evidence in Bakery, Desserts and Ice Cream, and Candy. Natural claims exhibit consistent within-category discrepancy in both food and beverages. In food products, claims such as ‘No Added/Artificial Flavourings’, ‘No Additives/Preservatives’ and ‘No Added/Artificial Colourings’ show discrepancy in Condiments, Meals and Side Dishes, Processed Fruit and Vegetables, and Processed Meat and Seafood (Extended Data Table 1). In beverages, similar patterns are observed for No Added/Artificial Flavourings and No Additives/Preservatives in Juice and RTD Coffee and Tea, as well as for Organic in Flavoured Water and Nutritional Drinks (Extended Data Table 2).