
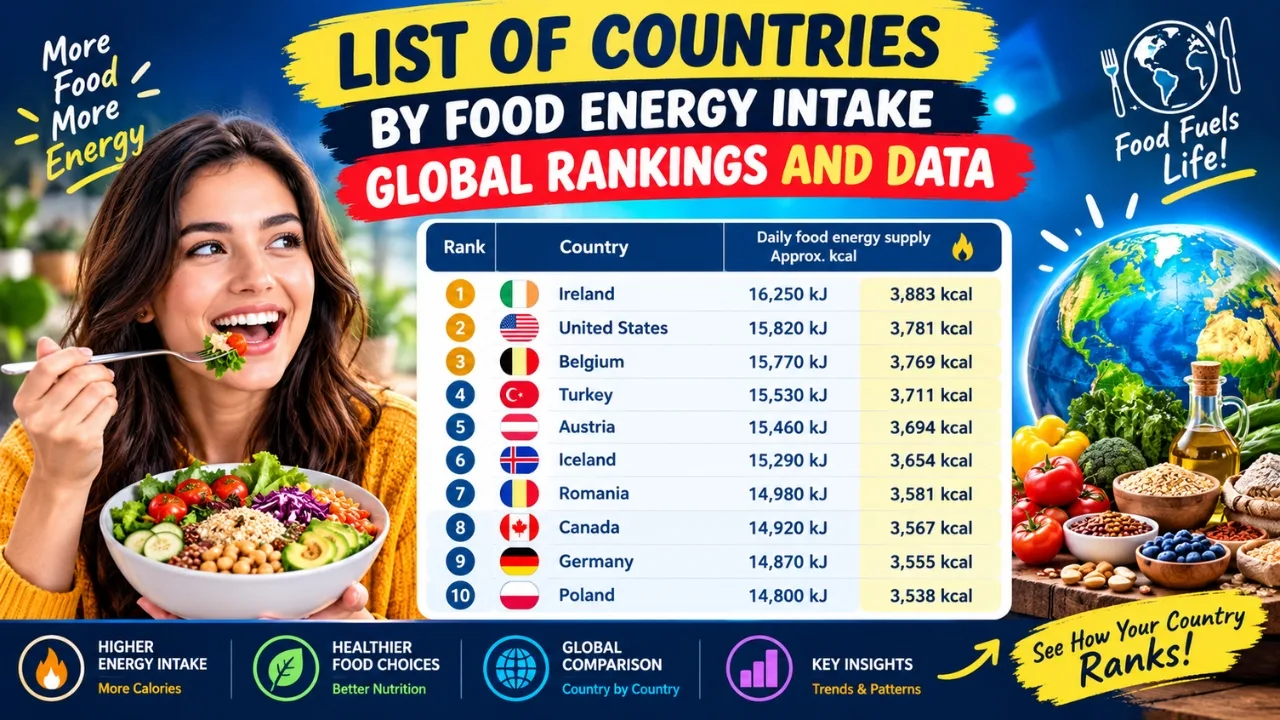
Food energy intake shows how much dietary energy is available for consumption per person in each country. The list of countries by food energy intake is usually measured in kilojoules per person per day, although some countries commonly use kilocalories.
The figures are useful for comparing national food supplies, dietary patterns, and long-term nutrition trends. However, they should not be interpreted as the exact amount every individual eats because the data reflects food availability and may include waste, losses, and food used for household animals.
 Highest Food Energy Intake
Based on the 2018 figures presented in the reference dataset, Ireland recorded the highest average daily food-energy supply at 16,250 kilojoules per person. The United States and Belgium followed closely, with 15,820 and 15,770 kilojoules respectively.
RankCountryDaily food energy supplyApprox. kcal1Ireland16,250 kJ3,883 kcal2United States15,820 kJ3,781 kcal3Belgium15,770 kJ3,769 kcal4Turkey15,530 kJ3,711 kcal5Austria15,460 kJ3,694 kcal6Iceland15,290 kJ3,654 kcal7Romania14,980 kJ3,581 kcal8Canada14,920 kJ3,567 kcal9Germany14,870 kJ3,555 kcal10Poland14,800 kJ3,538 kcal
These values are food-supply estimates, not individual dietary records. A high national figure may reflect greater food availability, food imports, consumption patterns, or waste across the supply chain and in households.
 Lowest Food Energy Intake
At the lower end of the dataset, the Central African Republic recorded an average daily food-energy supply of 7,470 kilojoules per person in 2018. Zimbabwe, Madagascar, Uganda, and Zambia were also among the countries with the lowest reported levels.
Several countries near the bottom of the list recorded daily supplies below 9,000 kilojoules:
Central African Republic: 7,470 kJ.Zimbabwe: 7,980 kJ.Madagascar: 8,110 kJ.Uganda: 8,290 kJ.Zambia: 8,380 kJ.North Korea: 8,450 kJ.Afghanistan: 8,500 kJ.
A lower average does not describe every household or region within a country. National averages can conceal major differences linked to income, geography, food prices, conflict, harvests, access to markets, and household size.
 India’s Position
India ranked 132nd in the referenced 2018 table, with an average food-energy supply of approximately 10,600 kilojoules per person per day, equivalent to about 2,533 kilocalories.
This number should be read carefully. It represents food available for human consumption at the national level rather than the precise intake of Indian households. Differences between states, rural and urban areas, income groups, and age groups can be substantial.
For readers researching food security or nutrition in India, food-energy availability is only one indicator. A complete assessment should also consider diet quality, protein intake, micronutrients, affordability, child nutrition, and access to safe and diverse foods.
Regional Food Energy Trends
The historical data shows that global average dietary energy availability increased from about 9,050 kilojoules per person per day in 1961 to 11,970 kilojoules in 2018. Asia recorded a particularly notable rise, increasing from 7,460 to 11,850 kilojoules over the same period.

Regional patterns in 2018 included:
Europe: approximately 14,290 kJ per person per day.North America: approximately 14,520 kJ.South America: approximately 12,900 kJ.Asia: approximately 11,850 kJ.Oceania: approximately 10,820 kJ.Africa: approximately 9,750 kJ.
The figures suggest a broad long-term increase in food-energy availability, but greater availability does not automatically mean better nutrition. Diets can become more energy-dense while remaining low in essential nutrients, and excess availability can coexist with undernutrition in some communities.
How to Interpret the Rankings
The list of countries by food energy intake is most useful when treated as a comparative food-supply indicator. Keep these points in mind:
Food supply is not the same as food consumed. Waste during storage, preparation, cooking, and serving can reduce actual intake.Calories do not measure diet quality. Two countries can have similar energy supplies but very different diets.National averages hide inequality. A single figure cannot show differences between households or regions.The year matters. Food availability can change because of economic conditions, weather, conflict, trade, and policy.Kilojoules and kilocalories are different units. One kilocalorie equals approximately 4.184 kilojoules.Frequently Asked QuestionsWhich country has the highest food energy intake?
Ireland had the highest average daily food-energy supply in the referenced 2018 dataset, at approximately 16,250 kilojoules per person.
Which country has the lowest food energy intake?
The Central African Republic recorded the lowest figure in the table, at approximately 7,470 kilojoules per person per day.
Is food energy intake the same as calorie consumption?
No. Food-energy intake rankings generally estimate food available for consumption. Actual consumption may be lower because of waste, spoilage, preparation losses, and food diverted to animals.
Where does India rank?
India ranked 132nd in the referenced 2018 list, with approximately 10,600 kilojoules, or about 2,533 kilocalories, available per person per day.
Understanding the list of countries by food energy intake requires more than identifying the highest and lowest values. The ranking offers a useful overview of national food availability, but it becomes more meaningful when read alongside income, food access, diet quality, inequality, and broader nutrition indicators.
Data note: Figures and rankings in this article are based on the supplied reference page and its 2018 dataset. The source page explains that the values represent food availability and may include waste and losses.
How to Use Simple Food Tips to Help You Fight Fatigue Naturally