
Data collection
We utilized data from the 10K Project, a prospective human cohort study involving over 10,000 healthy participants aged 40–70 at recruitment. The study focuses on in-depth clinical, physiological, behavioral, and multi-omic profiling. Specific exclusion criteria were applied to maintain the relevance and homogeneity of cohort31.
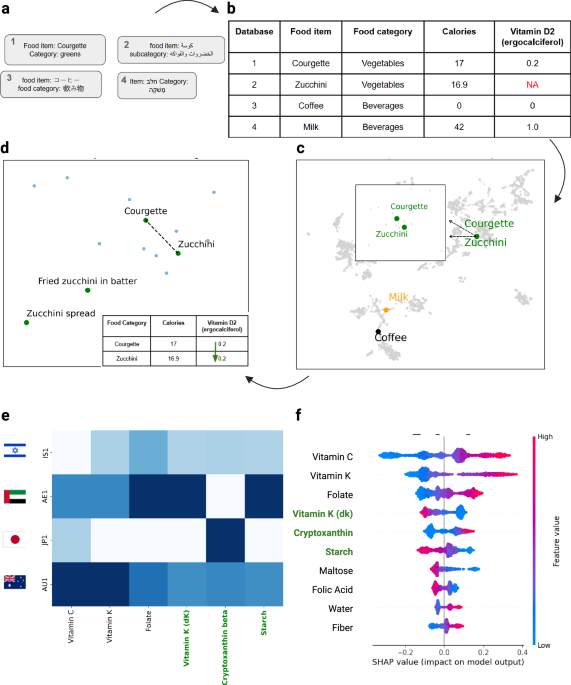
Dietary data were collected via continuous real-time diet logging. Participants recorded daily food and beverage consumption using a dedicated mobile app for a continuous 2-week period. The HPP FCDB linked to this app contains 7765 unique food items, categorized into 33 distinct food categories and associated with 718 short food names for high-level grouping.
As part of our external validation, we utilized data from the Australian PREDICT cohort27. It is a randomized controlled trial of personalized diet interventions in individuals with prediabetes or early-stage T2DM on metformin (N = 138). Detailed dietary logging and clinical measurements were collected using a dedicated mobile app, as previously described27.
Ethical approval
All participants signed an informed consent form upon arrival at the research site. All identifying details of the participants were removed prior to the computational analysis. The 10K cohort study is conducted according to the principles of the Declaration of Helsinki and was approved by the Institutional Review Board of the Weizmann Institute of Science.
External databases
Our alignment process involved matching the HPP FCDB with several key external FCDB. These databases were selected to provide comprehensive coverage of regional and global dietary habits:
USDA SR Legacy, a comprehensive source of nutritional data for U.S. foods, providing detailed profiles of macronutrients, vitamins, minerals, and bioactive compounds. Widely used in diet-related research21;
USDA FNDDS, primarily used for dietary intake surveys in the U.S., offers nutrient content, serving sizes, and food descriptions, frequently updated for public health research21;
Tzameret, an Israeli FCDB focused on nutrient data for locally consumed foods, essential for studying Israeli dietary patterns23;
MEXT (Japan) provides nutrient profiles of Japanese foods, reflecting regional dietary habits, and commonly used in studies of Japanese diets24;
Bahrain Food Database, developed by Bahrain’s Ministry of Health, provides essential nutritional data on local foods to support public health and dietary research25;
AUSNUT, the Australian food composition database, was developed for the 2011–2013 Australian Health Survey (AHS), providing detailed nutrient profiles for foods and dietary supplements consumed in Australia26.
Alignment methodology
Our alignment methodology follows four stages:
Dataset Standardization: We used structured outputs from LLMs to classify food item names and categories consistently across all datasets. This ensured uniformity in food classifications.
Embedding Projections: We converted food items into semantic embeddings using a model from Open AI (https://platform.openai.com/docs/guides/embeddings). We have used the “text-embedding-3-large” model to represent each food item as a vector of 3072 dimensions.
Matching: We employed cosine similarity as the distance metric to compare and match food items from different databases.
Validation with LLM: Finally, we used a prompt-based approach with an LLM to validate that the matched food items were indeed equivalent. The validation focused on ensuring that nutrients from one food item could be accurately imputed to the matched item.
Imputation methodology
To address missing nutrient data in FCDBs, NutriMatch employs a structured imputation strategy that integrates embedding-based matching and LLM-assisted validation. This approach ensures that missing nutrients are inferred based on the most robust and validated sources while maintaining transparency in decision-making.
Embedding-Based Candidate Selection: for each food item requiring nutrient imputation, we first identify the top 5 closest matches based on their embeddings. These embeddings, derived from a deep-learning model trained on food descriptions and nutrient compositions, enable semantic comparisons beyond simple keyword matching.
LLM Validation of Food Equivalence: the match between the original food item and the closest matches is then evaluated using an LLM. The LLM is prompted with structured queries to determine whether the candidate foods are nutritionally equivalent to the target food item (In our case, our standardized food item structure is that of the SR Legacy containing description and category). If the LLM confirms equivalence, these matches are flagged as valid references for nutrient imputation.
While this automated validation reduces the need for manual expert review and enables greater scalability, occasional mismatches may still arise in edge cases where domain expertise could offer added value.
Hierarchical Dataset Ranking for Selection: we prioritize FCDBs based on their validation rigor and data robustness. Databases with stringent quality control measures—such as USDA Standard Reference (SR Legacy) and USDA FNDDS—are given higher priority over sources with less validation, such as Tzameret. This ranking ensures that imputed values are derived from the most reliable sources whenever possible.
Selecting the Closest Match for Nutrient Imputation: once the top LLM-validated match is identified, nutrient values are imputed sequentially, starting from the highest-ranked database. If a match is found within a highly validated FCDB, its nutrient composition is directly transferred. Otherwise, the best available match in the embedding space is selected to provide the missing values.
Post-Imputation Matching for Unresolved Cases: for food items without an exact LLM-confirmed match, we leverage the embedding space to identify the most similar food and assign its nutrient values. This ensures that all food items receive a complete nutrient profile, even when exact database matches are unavailable.
This systematic imputation methodology makes NutriMatch fully explainable, as every imputed nutrient can be traced back to a specific food item in a known FCDB. By combining semantic embeddings, LLM validation, and dataset prioritization, we enhance the completeness and reliability of dietary data while maintaining methodological transparency.
Quantifying intra‑ and inter‑FCDB nutrient variability
We accessed the inter-database correlations using the shared nutrients. The three study databases AUSNUT (PREDICT cohort), Tzameret, and SR Legacy, share 37 nutrients (non-imputed). After NutriMatch alignment, we retained every nutrient represented by at least 50 food items in each comparison (all 37 met this criterion). Match counts were 1964 foods for AUSNUT ↔ SR Legacy, 4132 for AUSNUT ↔ Tzameret, and 3409 for Tzameret ↔ SR Legacy. Log Pearson (minimum clipping of 1e-5) correlations were computed nutrients‑wise for each two‑way combination and are displayed in Extended Data Fig. S2 due to the large zero tail of some of the nutrients in question.
To estimate the upper bound of reproducibility expected under ideal conditions, we used the Foundation Foods subset of USDA FoodData Central21, which includes repeated analytical measurements for the same food items, within the same country, while measured by the same laboratory methods. Even in this best-case scenario—where all external sources of variability are minimized—nutrient values still show variation due to intrinsic measurement noise. Within the 37 nutrients analyzed in our inter-database comparison, 25 were represented in Foundation Foods with ≥4 replicate determinations, yielding 10,076 food–nutrient pairs. Since only summary statistics (minimum, maximum, etc.) were available, we approximated the within-food standard deviation as σ ≈ (max–min)/4. This value corresponds to the theoretical σ of a uniform (rectangular) distribution, a widely used range-based estimator when an empirical variance is unavailable. We drew 100 pseudo‑observations from N(mean, σ²) for each pair and calculated log Spearman correlations across all non-identical food pairs. The 0.05/0.95 percentiles of this distribution (ρ ≈ 0.81–0.99) define an empirical “best-case” reproducibility band against which inter-database correlations were compared.
Machine learning models
For regression and classification tasks, we utilized the LightGBM library, implementing a fivefold cross-validation approach to evaluate model performance. Dietary log data was preprocessed by including only days with a recorded intake of at least 800 kcal.
We compared three hierarchical feature subsets in our predictive models: (1) age and sex only, (2) basic nutrients (macronutrients and sodium) along with age and sex, and (3) all nutrients, including the basic set, expanded by NutriMatch imputation. Each subsequent subset fully contains the previous one, allowing clear assessment of incremental predictive value from additional nutrient features.
To compare macronutrient and micronutrient consumption between the Australian and Israeli cohorts, participants were matched based on age, gender, and BMI using propensity score matching.
Propensity score matching
Propensity score matching balances baseline covariates by pairing participants with similar estimated probabilities of group assignment based on age, gender, and BMI. Matching was carried out via nearest-neighbor selection without replacement to create comparable groups. The matched cohort, with aligned distributions of age, gender, and BMI, was then used for downstream effect estimation.
SHAP
For model interpretability, SHAP (SHapley Additive exPlanations) decomposes individual predictions into per-feature contributions, quantifying the extent to which each variable shifts the prediction from its baseline. Positive and negative SHAP values indicate upward or downward effects on the model output, respectively. Contribution distributions are summarized with a beeswarm plot: features are ordered by mean absolute SHAP value, each point represents a sample’s SHAP value for that feature, horizontal position denotes effect size and direction, and color encodes the raw feature value. This visualization simultaneously conveys feature importance and inter-sample variability in effect magnitude and direction.