
Study population
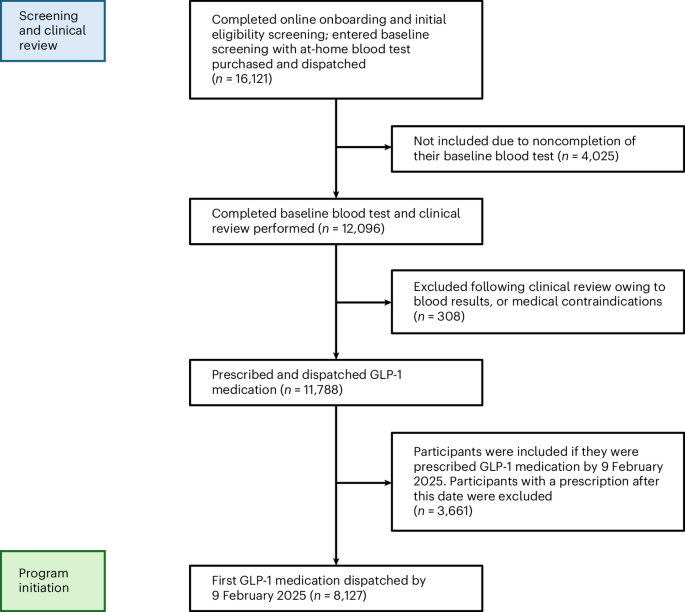
Between 27 November 2024 and 31 January 2025, adult women (female sex at birth) were recruited through digital outreach and screened via a structured online onboarding platform incorporating demographic characteristics, anthropometry, medical history, medication use and contraindications to GLP-1RA therapy (Fig. 1).
Fig. 1: Participant flow through screening, eligibility and inclusion.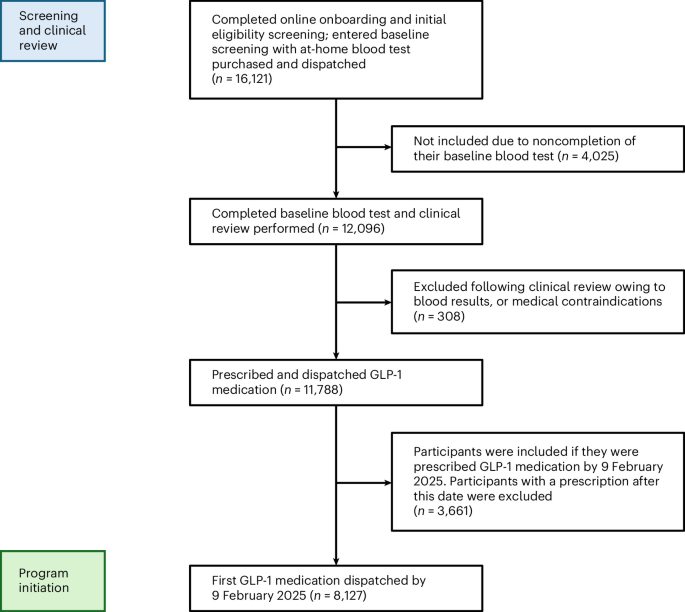
A flow diagram illustrating participant recruitment, eligibility screening, baseline assessment and inclusion in the analytic cohort. Individuals were screened via a structured digital onboarding platform. Individuals were only included if they had completed baseline biochemical testing, and were excluded if clinical review identified abnormalities in blood test results or contraindications to therapy. The final analytic cohort comprised participants prescribed and dispatched GLP-1RA therapy before the administrative cutoff.
Of 16,121 individuals meeting initial screening criteria, 4,025 were not included solely owing to noncompletion of baseline blood testing, and a further 308 were excluded following clinical review, owing to abnormal laboratory findings or medical exclusion criteria. GLP-1RA therapy was prescribed and dispatched to a total of 8,127 participants before an administrative cutoff date, and they were then included in the analytic cohort (Fig. 1, Table 1 and Extended Data Table 1). This represents consecutive selection across eligibility confirmation, laboratory completion and clinical review stages within a fully remote care pathway.
Table 1 Baseline characteristics of the study population stratified by baseline body weightBaseline characteristics
The program was designed exclusively for adult women (female sex at birth), and sex at birth was determined through structured self-reporting during onboarding, confirmed via supervised identity verification. Table 1 and Extended Data Table 1 outline baseline participant characteristics according to weight and age groups, respectively. Mean baseline weight was 104.2 kg (s.d. of 19.8) and mean body mass index (BMI) 38.2 kg m−2 (s.d. of 6.7), with 95.5% of participants meeting criteria for class I–III obesity. Weight distribution was broad, with 19.3% of participants weighing ≥120 kg and 25.9% <90 kg. The cohort spanned a wide adult age range (18–79 years), with 82.1% aged 30 to <60 years. Mean baseline total cholesterol was 5.7 mmol l−1 (s.d. of 1.2), low-density lipoprotein (LDL) cholesterol 3.8 mmol l−1 (s.d. of 1.1) and glycated hemoglobin (HbA1c) 36.2 mmol mol−1 (s.d. of 6.1), values consistent with cardiometabolic profiles reported in community populations with obesity without established cardiovascular disease. Age-stratified analyses demonstrated modest increases in metabolic risk with advancing age, with 21.3% of participants aged ≥60 years meeting criteria for type 2 diabetes or prediabetes compared to 4.1% of those aged 18 to <30 years. Participants were predominantly white (88.0%), although representation across other ethnic groups enabled subgroup analyses of treatment response. Socioeconomic distribution was heterogeneous, with 37.6% residing within the two most deprived Index of Multiple Deprivation (IMD) quintiles. Of the 8,127 participants initiating therapy, 7,297 (89.8%) provided weight measurements at 6 months and 6,466 (79.6%) completed repeat biochemical assessment.
Baseline sociodemographic and anthropometric characteristics were broadly similar between the analytic cohort and the wider group of online registrants with valid baseline data, with no major differences in age, baseline BMI or postcode-derived IMD (Extended Data Table 2). Among participants initiating GLP-1RA therapy, baseline sociodemographic and clinical characteristics were also broadly comparable between those with and without complete paired follow-up weight or biochemical measurements, with no systematic differences between participants included in and excluded from the complete-case analytical samples (Supplementary Tables 1 and 2).
Medication dosing and titration
Treatment initiation occurred predominantly with tirzepatide 2.5 mg weekly (99.6%), with 13 initiating at higher doses (5–15 mg). A total of 19 participants initiated with semaglutide, 17 at 0.25 mg and 2 at higher doses (0.5 or 2.4 mg). Subsequent dose escalation was guided by licensing recommendations but individualized according to weight trajectory and tolerability13 (Fig. 2). Clinicians were advised to defer escalation in participants demonstrating adequate weight loss (≥2 kg month−1) or reporting of clinically meaningful side effects. Mean tirzepatide exposure increased to 9.5 mg weekly at 6 months. Stratified analyses demonstrated largely parallel dose trajectories across baseline weight, age and socioeconomic strata (Extended Data Fig. 1).
Fig. 2: Dose exposure, side effects and treatment retention.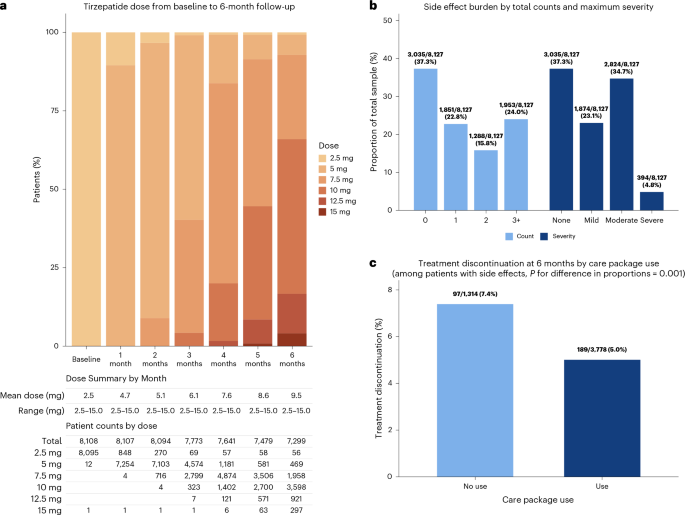
a, Distribution of weekly tirzepatide dose exposure from treatment initiation to 6 months, with each monthly time point reflecting the most recent prescribed dose recorded before or during that month of follow-up. Mean dose and patient counts contributing to each time point are shown below the plot. b, Participant-reported side effect burden during follow-up, summarized as total count of recorded side effects per participant and maximum reported severity (none, mild, moderate or severe). Side effects were captured at medication refill intervals using structured reporting instruments. c, Treatment discontinuation at 6 months among participants reporting any side effects, stratified according to use of a structured symptom-mitigation package provided at treatment initiation. Semaglutide dosing trajectories are not shown owing to limited exposure (<2% of the cohort). Treatment discontinuation was defined as cessation of pharmacotherapy during the 6-month observation period.
Weight outcomes
Among participants with available 6-month weight measurements (n = 7,297), 99.3% experienced weight reduction. Mean weight decreased from 104.6 kg (s.d. of 19.8) at baseline to 88.6 kg (s.d. of 19.0) at 6 months, corresponding to a mean absolute reduction of 16.1 kg (95% confidence interval (CI) 15.9 to 16.2; P < 0.001) or 15.5% of baseline (95% CI 15.4 to 15.7) (Fig. 3). Clinically meaningful weight loss thresholds were broadly achieved at 6 months, with 96.1% attaining ≥5% weight loss, 83.1% ≥10%, 53.5% ≥15% and 22.4% ≥20%. Within the complete-case sample, mean BMI decreased from 38.4 kg m−2 (s.d. of 6.7) to 32.5 kg m−2 (s.d. of 6.5) during the study period. At 6 months, 63.6% of participants with baseline class III obesity had transitioned to class II or lower, and 92.1% of participants with baseline class II were class I or below the obesity threshold (BMI <30 kg m−2). Temporal analyses indicated that 58.0% of total 6-month weight reduction occurred within the first 3 months.
Fig. 3: Weight trajectories during 6 months of GLP-1RA therapy.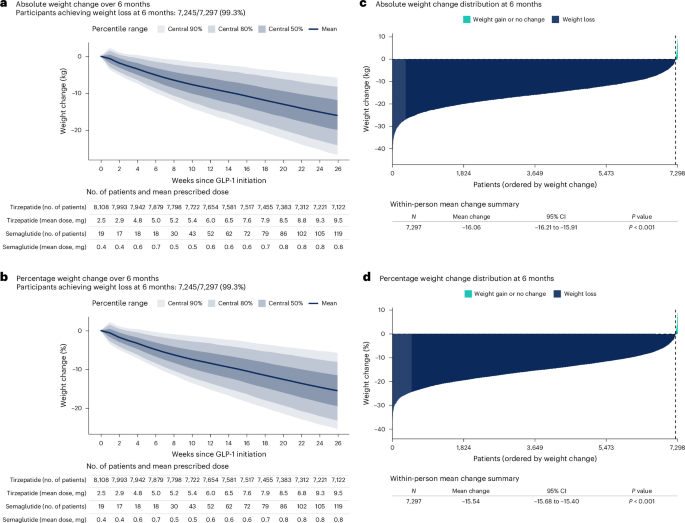
a,b, Mean absolute body weight change in kg (a) and percentage change (b) from baseline over 6 months among participants with available longitudinal weight measurements (n = 7,297). Values represent mean weight change at each follow-up time point following treatment initiation. Percentage weight change was calculated relative to baseline body weight for each participant. Corresponding mean medication exposure displayed within the figure was derived from each participant’s most recent prescription recorded before or during the respective follow-up time point. c,d, Absolute (c) and percentage (d) body weight change for individual participants from baseline to 6-month follow-up. Each participant’s body weight change is plotted as a single bar. P values were derived using paired two-sided t-tests comparing baseline and 6-month measurements. No adjustment for multiple comparisons was applied as these were the primary outcomes.
Weight loss heterogeneity across baseline characteristics
Weight loss was observed across all baseline weight strata, with greater absolute reductions among participants with higher starting weight, but comparable percentage reductions across categories (Fig. 4). Percentage weight loss was modestly lower in older age groups (16.1% for 18 to <30 years to 14.8% for 60 to <80 years), and was modestly greater in white participants (15.8%) than in nonwhite participants (13.5%), although clinically meaningful reductions were observed in all ethnic groups (Fig. 4d). In analyses of absolute weight change, reductions did not differ significantly across IMD quintiles (P = 0.364; Fig. 4c). Integrated subgroup analyses, visualized as a heat map, demonstrated consistently negative weight-change estimates across combinations of baseline weight, age and deprivation strata, without evidence of subgroup nonresponse (Extended Data Fig. 2).
Fig. 4: Weight-change trajectories stratified by baseline characteristics.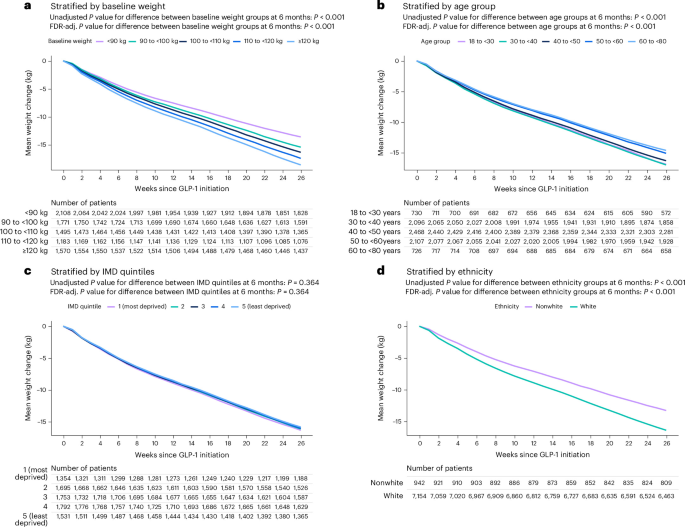
a–d, Mean absolute weight change from baseline to 6 months following GLP-1RA initiation stratified by baseline characteristics. The graphs show trajectories according to baseline body weight category (a), age group (b), IMD quintile (c) and self-reported ethnicity (d). Values represent mean within-participant weight change at each follow-up time point. Numbers of patients at each time point for each subgroup are shown below the graphs. Between-group differences in weight change at 6 months were assessed using linear regression models, with partial F-tests comparing models with and without the subgroup variable. Benjamini–Hochberg FDR-adjusted (FDR-adj.) P values are presented alongside unadjusted P values to account for multiple testing, with FDR adjustment applied across the four subgroup tests shown in a–d. For a, baseline weight categories were defined as <90 kg, 90 to <100 kg, 100 to <110 kg, 110 to <120 kg, and ≥120 kg. For b, age groups were defined as 18 to <30, 30 to <40, 40 to <50, 50 to <60, and 60 to <80 years. For c, socioeconomic status was determined using IMD quintiles derived from participant postcode, with quintile 1 representing most deprived and quintile 5 least deprived. Analyses for each graph were restricted to participants with nonmissing data for the relevant subgroup variable.
Glycemic outcomes
Among participants with paired HbA1c measurements (n = 6,245), mean HbA1c decreased from 36.3 to 33.0 mmol mol−1, equivalent to a decrease from approximately 5.5% to 5.2% on the National Glycohemoglobin Standardization Program (NGSP) scale (mean change −3.3 mmol mol−1; P < 0.001) (Fig. 5). At baseline, 155 participants (2.5%) exhibited HbA1c values within the diabetic range (≥48 mmol mol−1) and 567 (9.1%) within the prediabetic range (42 to <48 mmol mol−1). Following 6 months of therapy, HbA1c normalized in 84.5% (131/155) of participants with baseline diabetic-range values and 96.3% (546/567) of those with prediabetes, while progression from normoglycemia to dysglycemia occurred in only 0.3% of participants (19/5,523) (Extended Data Fig. 3). Adjusted linear regression modeling indicated that each 10-kg greater weight reduction was associated with a 1.3 mmol mol−1 greater decrease in HbA1c (Extended Data Fig. 4).
Fig. 5: Changes in glycemic and lipid parameters during follow-up.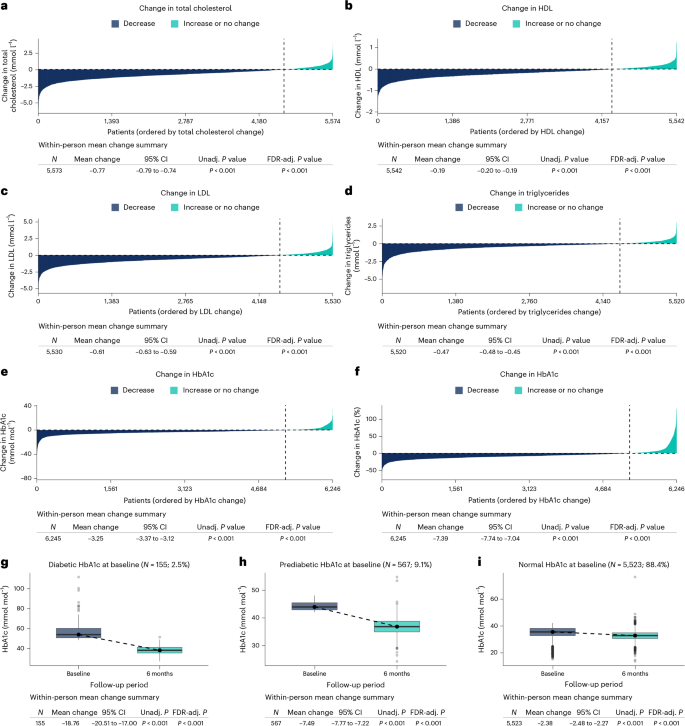
a–f, Within-participant change in cardiometabolic biomarkers between baseline and 6 months among participants with paired measurements, with waterfall plots showing individual changes in total cholesterol (a), HDL cholesterol (b), LDL cholesterol (c), triglycerides (d) and HbA1c (expressed in mmol mol−1 (e) and relative percentage change from baseline (f)), with participants ordered according to magnitude of change. Negative values indicate reductions from baseline. g–i, Paired HbA1c distributions at baseline and 6 months stratified by baseline glycemic categories: diabetic (g), prediabetic (h) and normoglycemic (i). Within each box plot, the center line indicates the median, and the lower and upper bounds of the box indicate the 25th and 75th percentiles, respectively. Whiskers extend to the most extreme values within 1.5× the IQR. Values beyond the whiskers are shown as individual points, with the minimum and maximum represented by the lowest and highest points, respectively. Mean within-participant changes, 95% CIs and P values were derived using paired two-sided t-tests comparing baseline and 6-month measurements. Benjamini–Hochberg FDR-adjusted (FDR-adj.) P values are presented alongside unadjusted (unadj.) P values to account for multiple testing, with FDR adjustment applied separately within two groups of secondary outcomes: the six main blood-test outcomes are shown in a–f and the three baseline HbA1c category-specific analyses are shown in g–i. HbA1c categories were defined as normoglycemia (<42 mmol mol−1), prediabetes (42 to <48 mmol mol−1) and diabetes (≥48 mmol mol−1).
Lipid outcomes
Among participants with paired lipid measurements, significant improvements were observed across lipid parameters (Fig. 5). Mean total cholesterol decreased by 0.77 mmol l−1 (95% CI 0.74 to 0.79; P < 0.001), LDL cholesterol by 0.61 mmol l−1 (95% CI 0.59 to 0.63; P < 0.001) and triglycerides by 0.47 mmol l−1 (95% CI 0.45 to 0.48; P < 0.001). High-density lipoprotein (HDL) cholesterol demonstrated a modest reduction of 0.19 mmol l−1(95% CI 0.19 to 0.20; P < 0.001). Multivariable regression analyses demonstrated graded associations between weight reduction and lipid improvement, with each 10 kg of weight loss associated with reductions in total cholesterol of 0.23 mmol l−1 (95% CI 0.19 to 0.27; P < 0.001) and LDL cholesterol of 0.14 mmol l−1 (95% CI 0.10 to 0.17; P < 0.001) (Extended Data Fig. 4).
Concomitant medication use
Data on baseline medication history and newly started concomitant medication during study follow-up were available for 8,091 of 8,127 participants. Overall, 165 participants (2.0%) reported any diabetic agent at baseline or during follow-up, predominantly metformin, and 436 participants (5.4%) reported any cholesterol-lowering medication, predominantly statins. Newly started diabetic and cholesterol-lowering medications were infrequently reported during follow-up. Although medication data were self-reported, these findings suggest that changes in glucose or lipid-lowering therapies were unlikely to explain fully the observed HbA1c and lipid changes.
Engagement, safety and adherence
Engagement with the digital program remained high throughout follow-up. The 6-month biochemical reassessment was completed by 6,466 of 8,127 participants (79.6%), and 7,429 (91.4%) remained on treatment at 6 months, with 698 (8.6%) discontinuing therapy (Extended Data Fig. 5). In multivariable Cox regression analyses, older age groups demonstrated lower hazards of discontinuation compared to those aged 18 to <30 years (hazard ratio (HR) range 0.34–0.57; all P < 0.001). Relative to participants in the most deprived IMD quintile, those in quintiles 3 and 4 exhibited lower hazards (HR range 0.71–0.75; all P ≤ 0.05), while no significant difference was observed for quintiles 2 and 5, suggesting a nonmonotonic association rather than a clear socioeconomic gradient. Participants with baseline weight <90 kg had higher hazards of discontinuation compared to those weighing ≥120 kg (HR 1.64, 95% CI 1.30 to 2.06; P < 0.001), while other weight categories did not differ significantly. Nonwhite participants had higher hazards of discontinuation compared to white participants (HR 1.27, 95% CI 1.04 to 1.56; P < 0.05) (Extended Data Fig. 5).
Overall, 5,092 of 8,127 participants (62.7%) reported at least one side effect during follow-up. Among these 5,092 participants, the maximum reported side effect severity was mild in 36.8%, moderate in 55.4% and severe in 7.7% (Fig. 2b), and little variation was present across baseline weight categories or age groups (Extended Data Fig. 6). Among participants who discontinued treatment, 286 of 698 (41.0%) reported at least one side effect, and 39 (5.6%) reported those as severe. Use of the recommended symptom-mitigation strategy was associated with lower discontinuation compared to nonuse (189 of 3,778 (5.0%) versus 97 of 1,314 (7.4%); P = 0.001) (Fig. 2c). During follow-up, 11 of 8,127 participants reported pregnancy, all of whom discontinued GLP-1RA therapy immediately. No serious treatment-related adverse events were identified.
Determinants of treatment response
Exploratory subgroup analyses demonstrated consistent weight reduction across combinations of baseline weight, age and socioeconomic status, without evidence of subgroup nonresponse (Extended Data Fig. 2). There were no patterns associated with both reduced effectiveness and increased discontinuation. Participants discontinuing treatment before 6 months achieved smaller overall weight reduction than those completing follow-up. Among participants with paired data, completers were substantially more likely to achieve ≥5% weight loss than those who discontinued before 6 months (6,980 of 7,241 (96.4%) versus 312 of 698 (44.7%)). At final available follow-up, mean weight loss was 16.1 kg (15.6%) among completers compared to 5.4 kg (5.4%) among discontinuers. However, nearly half of discontinuers (44.7%) had achieved ≥5% weight loss at their last recorded measurement, indicating that many had derived clinically meaningful benefit before cessation (Extended Data Fig. 7). Analyses of early weight trajectories showed no evidence that discontinuation was preceded by greater initial weight loss. Comparative analyses between tirzepatide and semaglutide exposure did not demonstrate significant differences in weight loss, although interpretation is limited by the small number of semaglutide-treated participants.
Sensitivity analyses
Sensitivity analyses supported the robustness of the overall findings. Inverse-probability-weighted analyses of primary and secondary weight and biochemical outcomes produced estimates similar to those from the complete-case analyses. Models predicting outcome completeness had c-statistics ranging from 0.600 to 0.684, and there was no evidence of extreme values or instability in the stabilized weights. For secondary and exploratory analyses involving multiple related comparisons, Benjamini–Hochberg false discovery rate (FDR) adjustment did not alter the overall interpretation of the findings (Extended Data Table 3).