
Highly multiplex imaging of human T1D samples
Studies of early T1D progression have been limited by sample availability3. For this study, we obtained pancreatic tissue sections from 88 cadaveric organ donors across the entire spectrum of T1D risk and progression from the Network for Pancreatic Organ donors with Diabetes (nPOD) biorepository (Fig. 1a and Supplementary Table 1). Included were samples from sAAb+ (N = 28) and mAAb+ (N = 10) donors, recent-onset (≤2 years) (Onset) T1D donors (N = 21) and long-duration (≥3 years) (LD) T1D donors (N = 14), as well as controls (N = 15), with disease stages matched in terms of multiple covariates, including age, sex and BMI (Extended Data Fig. 1a). Cause of death and organ transit time were the only measured covariates that were not balanced across disease stages (Extended Data Fig. 1b), and we ensured that these did not affect our results (see below). Other differences between disease stages (higher genetic risk and insulin treatment in diabetic donors) reflect population-level and clinical reality (Extended Data Fig. 1a,c) and the challenges inherent to studies of human samples (Discussion). Enabling the study of potential age-associated endotypes23, 11 donors were less than 7 years of age, and 9 were between 7 and 12 years of age. For a more robust statistical analysis, we pooled donors into groups of <13 years of age (N = 20) and ≥13 years of age (N = 68).
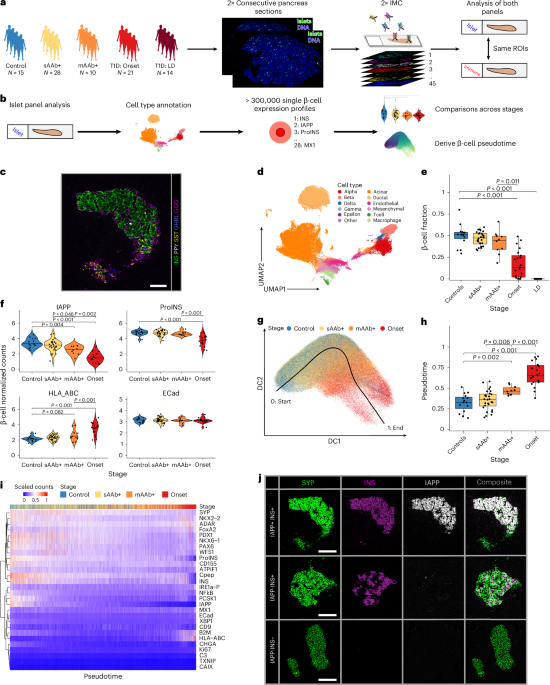
Fig. 1: IAPP is downregulated and MHC-I is upregulated along the β-cell pseudotime.
a, A schematic showing the experimental design of our study. Pancreatic samples from 88 cadaveric organ donors were analysed. b, Data analysis using the islet antibody panel. c, Representative pancreatic islet image from a non-diabetic control donor. INS, GCG, SST, PPY and GHRL mark β-, α-, δ-, γ-, ε-cells, respectively. Scale bar, 75 µm. d, Uniform manifold approximation and projection of a subset of 190,000 cells coloured by cell type. e, Fraction of β-cells per islet across disease stage groups (each dot shows mean per sample). f, Expression of indicated β-cell markers across disease stages (each dot shows mean per donor across ROIs). The centre line indicates the median. g, Trajectory inferred using slingshot from expression profiles of single β-cells projected onto a diffusion map; coloured by donor stage. h, Average β-cell pseudotime across disease stages (each dot shows mean per donor). i, A heat map of mean β-cell marker expression values across ROIs (min–max scaled, shown in columns). ROIs are ordered by pseudotime averages. j, Representative images of samples from control and disease stages stained for SYP (islets), IAPP and INS. Scale bar, 100 µm. Tests: non-significant tests are not shown. Differential expression was calculated using linear mixed-effects models (two-sided Wald t-test with Satterthwaite approximation) and differential abundances using edgeR (two-sided empirical Bayes quasi-likelihood F-tests). For boxplots in e and h, the centre line indicates the median, box bounds the interquartile range (IQR) and whiskers 1.5× IQR. P values are FDR adjusted. For e, f and h: controls: N = 15; sAAb+: N = 28; mAAb+: N = 10; Onset: N = 21 for e or N = 18 for f and h; LD: N = 15 for e.
To extensively analyse the endocrine and autoimmune compartments as well as the islet–immune interface, we designed two IMC antibody panels targeting a total of 79 unique protein markers (Supplementary Table 2 and 3). Specificity and association to T1D progression were tested in a pilot IMC study (N = 130 antibodies) applied to control (N = 4), sAAb+ (N = 4), mAAb+ (N = 4) and Onset T1D donors (N = 4) (Supplementary Table 4–8). We provide this 130-plex dataset. Using these two optimized panels, we imaged two 4-µm-thick consecutive sections from each donor. Because the speed of IMC data acquisition limits whole-slide imaging, we selected regions of interest (ROIs) based on immunofluorescence imaging of islet (CD99) and immune markers (CD45RO/CD45RA; CD3e). We chose ROIs to comprise islets with proximal exocrine tissue, with the goal of capturing both the endocrine state and the immune compartment. We then stained the sections with metal-labelled primary antibodies and acquired 75 selected ROIs per section by IMC. The same locations were imaged in consecutive sections using the second antibody panel. We segmented cells and islets in each image (Extended Data Fig. 2), with islets defined as SYPhigh objects of more than 50 µm2 (~8 µm diameter) (Methods). Our ROI and islet segmentation strategy results in an under-sampling of small islets, but this effect was small (Supplementary Fig. 1a–d; Discussion). After stringent quality control and signal spillover correction (Extended Data Fig. 2d), our dataset comprised 7,025 ROIs for each antibody panel, 10,413 islets and >16 million cells. To our knowledge, this represents, by far, the largest multiplexed imaging effort of T1D samples so far. Full data are available via Zenodo27 and annotated image data (for example, ‘insulitic’) is available in an easily browsable format at Pancreatlas (https://www.pancreatlas.org/)28.
β-cells and functional β-cell markers are lost during disease progression
Our islet antibody panel was designed to study dysregulation in the endocrine compartment (Fig. 1b) and included antibodies to lineage markers of islet cells, as well as to functional markers of ER stress (WFS-1, IRE1α-P and XBP1), the interferon (IFN) response (MX1 and ADAR), islet inflammation (B2M and HLA-ABC) and redox and inflammatory signalling (TXNIP, NF-κB and CD155) (Supplementary Table 3). We annotated cells by clustering single-cell lineage marker expression profiles, annotating the resulting clusters as abundant (α, β and δ) and rare (ε and γ) endocrine cell types (Fig. 1c) and subsequently labelling all non-endocrine cells as acinar, ductal, endothelial, mesenchymal, macrophage, T cell or ‘other’ (Fig. 1d and Extended Data Fig. 3a). The last category probably encompasses immune cells such as neutrophils. In total, we annotated over 6.2 million cells with the islet panel. Of the 975,313 classified islet cells, 328,225 were β-cells.
Using these cell annotations, we analysed β-cells along T1D disease stages. As expected, there was a gradual loss of β-cells from pancreatic islets with advancing disease stage1 (Fig. 1e). In non-diabetic donors, β-cells constituted on average 50% of islet cells, whereas donors with long-standing T1D had almost none (Fig. 1e). We found considerable inter-donor variation in β-cell loss within the mAAb+ and Onset T1D groups. Loss of β-cells was accompanied by an expected increase in the α-cell fractions (Extended Data Fig. 3b) and a potential loss in ε-cells in Onset donors. γ- and δ-cells did not show major changes in abundance across disease stages (Extended Data Fig. 3b).
Analysis of key β-cell lineage and functional markers in disease stages before LD T1D (due to the near-total loss of these cells in LD donors) revealed lower levels of several β-cell and islet-lineage markers in later disease stages (Fig. 1f and Extended Data Fig. 3c). This trend was most pronounced in β-cell hormones, with significantly lower levels (P < 0.03) of IAPP, ProINS and C-peptide in Onset T1D cases compared with controls (Extended Data Fig. 3c and Fig. 1f; we note that ProINS and C-peptide were measured with separate antibodies). We also detected significantly lower IAPP expression at the mAAb+ stage compared with controls (P = 4 × 10⁻³) and sAAb+ donors (P = 4.6 × 10⁻²), implicating IAPP as a major marker of early disease progression. HLA-ABC trended higher at the mAAb+ stage compared with the controls (P = 0.08), and we observed significant hyperexpression of HLA-ABC in Onset T1D donors compared with control and mAAb+ donors (P < 10−4) (Fig. 1f). Contrary to expectations20,21,22, we did not observe significantly higher levels of ER-stress markers (IRE1α-P, WFS-1 or XBP1), inflammation or redox markers (NF-κB, CD155 or TXNIP) or IFN-responsive markers (MX1 or ADAR) across disease stages (Extended Data Fig. 3d) and the TIGIT/CD226 receptor CD155 as well as the lowly expressed redox signalling marker TXNIP were instead expressed at significantly lower levels in Onset donors29,30 (Extended Data Fig. 3d). Only ADAR tended towards higher levels in Onset donors, indicating an IFN-response in clinical disease (Extended Data Fig. 3d). Indeed, reanalysis of a public scRNA sequencing dataset31 showed higher IFN-responses but no heightened ER-stress marker levels (GO_BP: 0030968) or ER-stress-associated TF activity in β-cells from T1D donors compared with controls (Supplementary Fig. 2); of the five stress-associated TFs we could probe in this analysis, XBP1 showed reduced activity in T1D. In total, 24 out of 28 markers had lower protein levels in Onset than in control donors. These data suggest that the functions of remaining β-cells degrade as T1D progresses, including in clinically targeted pathways such as TXNIP.
Most covariates were not associated with β-cell marker expression (Supplementary Fig. 3a,b); this included cause of death and organ transit time, which were unbalanced across disease stages, indicating that these covariates did not influence stage-specific results. β-cell marker expression was associated only with age, with complement component (C3) being higher in younger versus older subjects; however, C3 was not associated with disease stages (Supplementary Fig. 3c,d). Association of β-cell marker expression to age was also limited to Onset donors (Extended Data Fig. 3e). Finally, we tested whether our measured β-cell expression patterns were linked to clinically measured GAD autoantibody (GADA) titres, focusing this analysis on sAAb+ GADA+ donors (N = 25). We detected mild inverse associations for stress or ER-stress markers TXNIP (P = 2 × 10⁻³), NF-κB (P = 0.12) and XBP1 (P = 0.12) but not for HLA-ABC (P = 0.92) or β-cell lineage markers (P > 0.41) (Supplementary Fig. 4). We did not include later disease stages in this analysis as their autoantibody profiles were diverse (Extended Data Fig. 1a).
Different islets from an individual may progress through T1D at different rates, potentially obscuring patterns of disease progression. Therefore, we inferred the temporal sequence of changes in β-cells during disease progression using slingshot pseudotime analysis32. Slingshot detected a single lineage (Fig. 1g), which started at control donors, progressed with sAAb+ and mAAb+ as mixed samples between the two endpoints and ended with Onset T1D donors (Extended Data Fig. 3f,g). More specifically, it ended in β-cells in insulitic islets, that is immune infiltrated islets with at least six T cells immediately adjacent to or within the islets33 (Extended Data Fig. 3h). The average β-cell pseudotime per donor thus increased significantly over consecutive disease stages (Fig. 1h) and was well correlated to known features of T1D progression such as donor HbA1c status (r = 0.64, P = 10−7), β-cell fraction (r = −0.74, P = 5 × 10⁻¹⁴) and disease stage (r = 0.75, P = 2 × 10⁻¹⁴), confirming the biological relevance of the inferred trajectory.
As in our cross-sectional analysis, analysis of β-cell marker levels along pseudotime showed trends towards lower expression levels in lineage β-cell markers such as PDX1 and NKX6.1 but no significant changes in ER stress, inflammation or IFN-responsive markers (Fig. 1i). We observed lower levels of IAPP and higher levels of HLA-ABC with increasing pseudotime (Fig. 1i and Extended Data Fig. 3i, both P < 10−16). Lower levels of ProINS and INS were on average observed only in Onset cases, whereas IAPP was significantly less expressed in some mAAb+ islets, which apparently were IAPP-INS+ (Fig. 1f,i,j and Extended Data Fig. 3i). Our data therefore suggest that ProINS and INS loss is preceded by loss of IAPP, despite their known co-secretion34.
In summary, starting in the mAAb+ stage, we observed gradually lower expression levels of β-cell lineage markers in comparison with prior disease stages. Levels of IAPP were strongly lower and levels of HLA-ABC were progressively higher across pseudotime, with loss of β-cell hormones before β-cell death. We observed lower levels of 24 out of 28 measured β-cell markers in Onset donors compared with controls, including mildly lower levels of ER-stress and other functional markers, suggesting degradation of β-cell function along disease progression.
MHC-I, MHC-II and other IFN-response markers are upregulated in islet cells alongside immune cell infiltration
Islet immune infiltration as well as β-cell MHC-I hyperexpression are main hallmarks of T1D3. A controversial question has been whether MHC-II is hyper-expressed on β-cells during T1D development18,35, given the potential implications for direct antigen presentation from β-cells to CD4+ T cells and that initial MHC-II observations on β-cells could not be reproduced. MHC-II hyperexpression was recently reported in pancreatic ductal cells24 and β-cells36,37 of patients with T1D. Highly multiplexed imaging techniques are needed to establish HLA-DR (MHC-II) expression not only in β-cells but also other islet cells and further to exclude spillover or false annotation. Using our extensive immune panel, we therefore probed for MHC-II hyperexpression in our cohort and tested for co-expression with MHC-I.
We observed higher single-cell expression of both HLA-ABC (MHC-I) and HLA-DR (MHC-II) in multiple endocrine and exocrine cell types across T1D stages with significantly higher expression in Onset T1D relative to control donors and with stronger differences in HLA-ABC than HLA-DR (Fig. 2a–c). Notably, there was also significantly higher MHC-I expression in α-cells in mAAb+ donors, demonstrating that islet-cell perturbations extend to non β-cells before clinical onset (Fig. 2a). There was significant co-expression of HLA-ABC in various islet cell types (for α- and β-cells, Spearman r = 0.78–0.97, P < 10−16; for β-cells and acinar cells, r = 0.49-0.75, P < 10−16), and co-expression increased with disease stage (Extended Data Fig. 4a). This suggests that a pro-inflammatory microenvironment, probably IFN-driven7, upregulates islet and islet-proximal HLA-ABC protein levels. In islets, antigen-presenting cells (APCs) and inflamed endothelium expressed HLA-DR at high levels, but we also clearly detected HLA-DR+ β-cells without potential spillover from major APC, phagocyte or endothelial markers in inflamed islets (for example, VIM, CD204, CD20, CD11c and CAV1) (Fig. 2c). Further, we observed other HLA-DR+ endocrine and exocrine cells, at lower HLA-DR intensity than in β-cells (Fig. 2b,c). To determine the (pseudo)temporal sequence of changing HLA-DR and HLA-ABC levels, we aligned expression of these markers in β-cells along pseudotime. This predicted that HLA-ABC upregulation in these cells occurs before upregulation of HLA-DR (Fig. 2d).
Fig. 2: IFN-dependent MHC-II upregulation in β-cells and other pancreatic cells.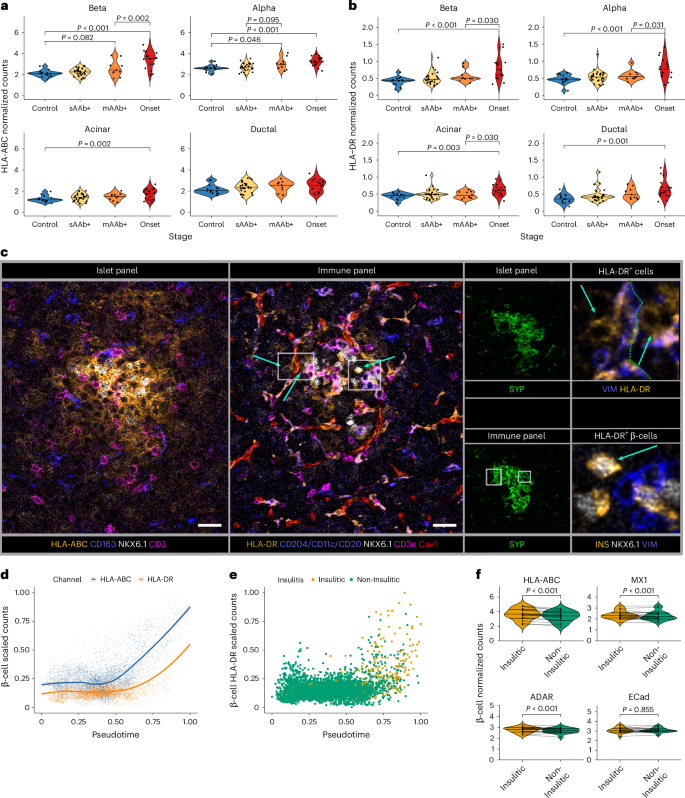
a,b, Violin plots of HLA-ABC (a) and HLA-DR (b) expression across cell types and disease stages (each dot shows mean per donor across ROIs). HLA-ABC and HLA-DR were measured using the islet and immune panel, respectively. The centre line indicates the median. c, Representative images of two consecutive sections showing HLA-ABC+ cells (left; islet panel) and HLA-DR+ cells (centre; immune panel). The arrows indicate HLA-DR+ β-cells (NKX6.1+, APC marker−; orange and white) or other HLA-DR+ endocrine and exocrine cells (orange). Right: magnified insets correspond to white boxes. The arrow in the magnified upper right panel indicates HLA-DR+ endocrine and exocrine cells (orange), both negative for VIM (blue; mesenchymal marker). The green line is the islet edge. Centre-right: low-magnification SYP+ islets are shown for comparisons. The arrow in the lower right inset indicates INS+/NKX6.1+/VIM- β-cells. Scale bar, 75 µm. d, HLA-ABC and HLA-DR expression in β-cells plotted over pseudotime (each dot shows mean per ROI). Lines indicate locally weighted scatterplot smoothing (LOWESS) fits with 95% confidence intervals (CIs). e, HLA-DR expression in β-cells along pseudotime (each dot shows mean per ROI; colour indicates insulitic and non-insulitic ROIs). f, Violin plots comparing β-cell expression in ROIs with (i = 172) or without (i = 533) insulitic islets from the same Onset donors (N = 17). The dots represent donor means; lines connect insulitic and non-insulitic ROIs from the same donor. The violin lines indicate the 25th, 50th and 75th percentiles. Tests: non-significant tests are not shown. Statistical comparisons were performed using linear mixed-effects models (two-sided Wald t-tests with Satterthwaite approximation). Significances are FDR adjusted. For a and b: controls: N = 15; sAAb+: N = 28; mAAb+: N = 10; Onset: N = 18.
More specifically, higher HLA-DR expression in β-cells was correlated with abundance of myeloid and especially T cells (Extended Data Fig. 4b and Supplementary Fig. 5) and was mostly confined to insulitic islets (Fig. 2e). By contrast, higher HLA-ABC levels were not confined to insulitic islets (Extended Data Fig. 4c). β-cells (and other islet cells) in insulitic islets had higher levels not only of HLA-DR and HLA-ABC relative to paired non-insulitic islets of the same donor but also of IFN-responsive markers MX1, ADAR and CD54 (Fig. 2f and Extended Data Fig. 4d,e). In sum, this suggests an IFN-driven β-cell and islet cell state specifically associated with T cell infiltration and marked by HLA-DR expression.
We detected no significant differences in ER stress markers of β-cells between paired insulitic and non-insulitic islets of the same donor (Extended Data Fig. 4f). Furthermore, comparison of α-cells of islets with β-cells (ICIs) to those without β-cells (IDIs) of the same Onset donors showed that α-cells in ICIs showed higher HLA-ABC levels, as expected under more inflammatory conditions, but lower ER-stress marker levels (IREα-P and WFS-1) (Extended Data Fig. 4g). In both these analyses, we thus, surprisingly, did not detect higher activity of our measured ER-stress markers under conditions of islet inflammation.
In sum, these data suggest that in islets, MHC-I is upregulated first, coinciding with protein downregulation in most lineage and functional β-cell markers, followed by upregulation of MHC-II and other IFN-responsive markers during T cell infiltration. Importantly, these changes were observed not only in β-cells but also in other islet and islet-proximal endocrine and exocrine cells.
Immune cell types change in density during disease progression
To study the evolution of the immune compartment within and proximal to islets during T1D progression, we used the immune panel data (Fig. 3a). We first separated cells into immune and non-immune cell types and classified non-immune cell types as acinar, ductal, mesenchymal, nerves, endothelial, smooth-muscle or ‘other’. Next, immune cells were annotated as myeloid cells, neutrophils, natural killer (NK) cells, B cells, CD4+ helper T (TCD4) cells, CD8+ cytotoxic T (TCD8) cells, double-negative T (TDN) cells (CD3e+CD4−CD8−, which probably include NK T cells and γδ T cells) and CD303+/VIM+ cells (Fig. 3b and Extended Data Fig. 5a). CD303+/VIM+ cells are probably a fibroblast subset involved in the fibrotic process after β-cell destruction or potentially an atypical plasmacytoid DC (CD303+HLA-DR−) (Extended Data Fig. 5a). In total, about 10.5 million cells were annotated, and approximately 1.2 million were immune cells (Fig. 3b).
Fig. 3: Immune cell type dynamics across T1D disease stages.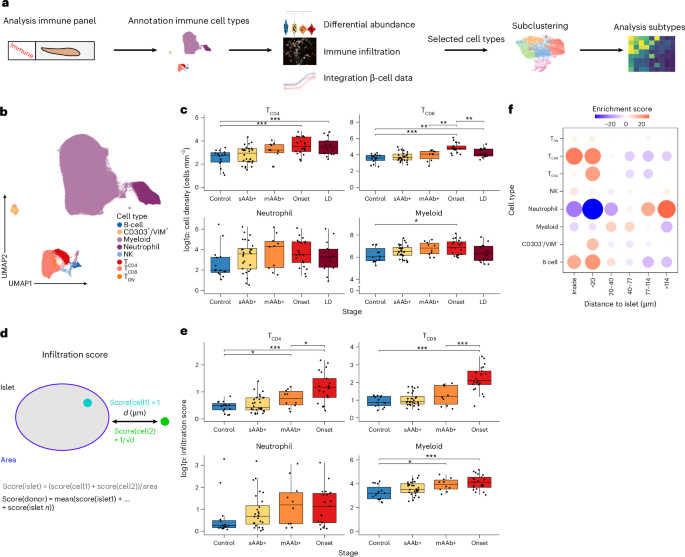
a, Data analysis with the immune panel. b, Uniform manifold approximation and projection of immune cell expression profiles, coloured by cell type. c, Mean densities of indicated cell types across disease stages (each dot shows mean per donor across ROIs). The centre line indicates the median, box bounds the interquartile range (IQR) and whiskers extend to 1.5× IQR. The Myeloid cell facet contains a y-axis break. d, Sketch of the developed infiltration score, normalized by islet size. e, Mean infiltration scores of the indicated cell types across disease stages (each dot, shows mean per donor across ROIs containing β-cells (ICIs)). Boxplots are as in c. f, Enrichment of immune cell types by distance to the islet edge (score: χ2 residuals; red, enrichment; blue, depletion). Tests: *P < 0.05; **P < 0.01; ***P < 0.001 for all comparisons. Non-significant tests are not shown. Differential abundance was determined using edgeR (two-sided empirical Bayes quasi-likelihood F-tests) and differential infiltration scores using a linear mixed-effects model (two-sided Wald t-test with Satterthwaite approximation). Significances are FDR adjusted. For c and e: controls: N = 15; sAAb+: N = 28; mAAb+: N = 10; Onset: N = 21. For c: LD: N = 14. The transformation log1p is short for loge(1 + x), with x being the cell density or infiltration score, depending on the subpanel.
We quantified immune cell density along T1D progression to identify disease-relevant immune cell types. Donor age and time in ICU but no other covariates were associated with immune cell type densities, and we thus adjusted for these covariates in all immune cell analyses (Methods; Supplementary Fig. 6). Myeloid, B, NK and T cells displayed gradually higher densities with stage, beginning in early disease stages, with significantly higher densities over control samples in Onset donors for all these immune cell types (Fig. 3c and Extended Data Fig. 5b). B cell density was variable between donors, with significantly higher fractions in younger T1D donors than in those ≥13 years of age (Extended Data Fig. 5c), as expected38. Neutrophil densities were variable, with outlier cases within each group showing considerable neutrophil presence (Fig. 3c).
Both increase in abundance of immune cells within the pancreas and attraction to islets are probably relevant for T1D progression. Therefore, we developed an ‘infiltration score’ that combines distance to islet edge and cell abundance in the measured ROIs and normalizes for islet size (Fig. 3d). We observed a significant increase in infiltration score for T cells, B, NK and myeloid cells in Onset T1D and some mAAb+ donors, compared with controls (Fig. 3e and Extended Data Fig. 5d). Both TCD4 and TCD8 cells also showed increased infiltration along pseudotime (r = 0.78, P < 10−16), suggesting co-infiltration of these cell types (Extended Data Fig. 5e). Further, infiltration score changes over pseudotime suggest that myeloid cells potentially precede T cells (P = 0.18) (Extended Data Fig. 5e). Other cell types showed no changes in infiltration score along T1D disease stages, with neutrophils displaying specific islet avoidance (Fig. 3e,f, Extended Data Fig. 5d and Supplementary Fig. 7a). Based on these results, we focused on the major islet-infiltrating immune cells, that is TCD4, TCD8 and myeloid cells.
PD1+CD4+ T cells and exhausted-like CD8+ T cells are enriched in early T1D islet inflammation
T cell-targeting therapies have shown partial therapeutic success before and after clinical onset of T1D7. However, while T cell states have been comprehensively evaluated in peripheral blood, they remain incompletely characterized in human pancreata, especially from patients who are AAb+. We thus analysed potential TCD4 and TCD8 states in our cohort.
We assigned around 27,000 TCD4 cells to eleven TCD4 subtypes (Fig. 4a). These included activated and minimally activated CD45RO+CD45RA−CD27− effector memory-like cells (TEM-like activated (act.), TEM-like low act.), CD45RO+CD45RA−CD27+ central memory-like cells (TCM-like act.), PD1+TCD4 memory cells (PD1+ act., PD1+ low act.) and PD1low cells (PD1low act., PD1low low act.), as well as two regulatory phenotypes, CD73+ TCD4 cells and regulatory T cells (Treg). We also labelled TCD4 cells with ambiguous expression profiles and an undefined TCD4 cluster (TCD4 other). Next, we assigned around 72,000 TCD8 cells to eight TCD8 cell subtypes (Fig. 4b): CD45RA+CD27+CD57− naive TCD8 cells, CD45RA+CD27lowCD57+ effector memory cells re-expressing CD45RA T cells (TEMRA), activated and marginally activated CD45RO+CD103+ tissue-resident memory cells (TRM act., TRM low act.), CD45RO+CD27mid effector memory/central memory-like cells (TEM/TCM-like), GranB+ cytotoxic TCD8 cells, an undefined set of TCD8 cells (TCD8 other) and a TCD8 memory cell subtype that expressed high levels of markers of exhaustion (PD1 and TIM-3), cytotoxicity (GranB), survival (CD27) and metabolism (for example, citrate synthase (CS)). This suggested an exhausted-like phenotype with some cytotoxic effector functions (T-exeff), although we note that TOX and TCF1 were not measured in our panels.
Fig. 4: Exhausted-like T cells dominate islet infiltration in mAAb+ and T1D donors.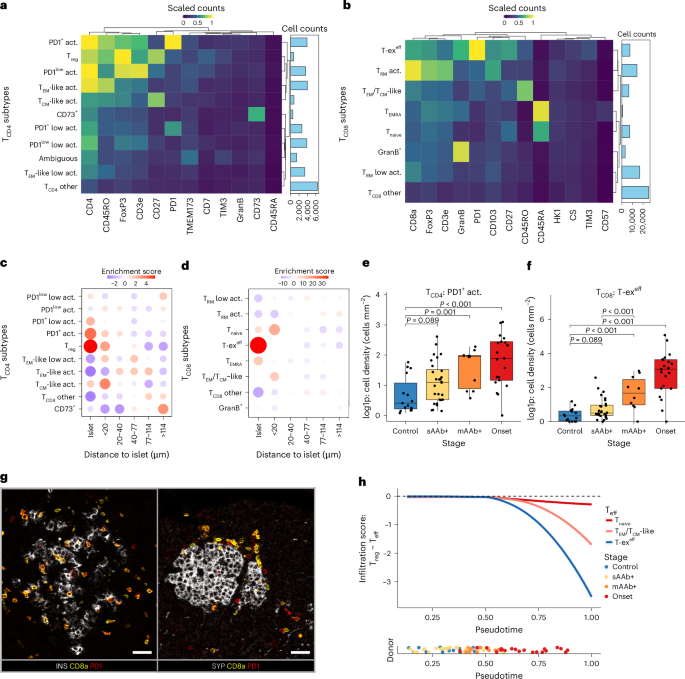
a,b, Lineage marker expression across annotated TCD4 (a) and TCD8 (b) subtypes. Right: barplots indicate total cell counts. c,d, Enrichment scores of TCD4 (c) and TCD8 (d) cell subtypes by distance to the islet edge (score: χ2 residuals; red, enrichment; blue, depletion). e,f, Mean densities of PD1+ act. cells (e) and T-exeff cells (f) across disease stages (each dot shows mean per donor across ROIs containing β-cells (ICIs)). The centre line indicates the median, box bounds the interquartile range (IQR) and whiskers extend to 1.5× IQR. The transformation log1p is short for loge(1 + x), with x being the cell density. g, Representative images of islet (left) and peri-islet enrichment (right) of exhausted-like T cells from an Onset donor and mAAb+ donor, respectively. Scale bar, 75 µm. h, Infiltration scores of TCD8 effector cells (Teff) relative to Treg along pseudotime per ROI. Negative values indicate higher presence of Teff than Treg cells in islets. Lines indicate LOWESS fits. Bottom: donor-average pseudotime is shown. Tests: non-significant tests are not shown. Differential abundance was tested using edgeR (two-sided empirical Bayes quasi-likelihood F-tests). Significances are FDR adjusted. For e and f: controls: N = 15; sAAb+: N = 28; mAAb+: N = 10; Onset: N = 21.
Next, we analysed islet-enrichment and abundance of T cell subtypes across progression. For TCD4 cells, we observed islet-enrichment of Treg (P = 5 × 10⁻⁷) and PD1+ act. cells (P = 4 × 10⁻⁴) (Fig. 4c)—and for TCD8 cells—of T-exeff cells (P < 10−16) (Fig. 4d), especially in Onset donors (Supplementary Fig. 7b,c). The islet-enriched PD1+ subtypes (that is, T-exeff and PD1+ act. cells) and Treg demonstrated significantly greater abundance in mAAb+ and Onset donors compared with controls (all P < 2 × 10⁻³) (Fig. 4e,f and Extended Data Fig. 6a) and a tendency towards higher abundance in sAAb+ donors (all P < 0.1). Also enriched in mAAb+ samples were PD1low act., and PD1low low act. cells (Extended Data Fig. 6a,b), but these were not enriched in islets (Fig. 4c), suggesting limited cytotoxic effects at this stage of disease.
Using our infiltration score, we found that PD1+ act. and T-exeff cells significantly infiltrated islets in Onset donors and a subset of mAAb+ donors but not in sAAb+ donors compared with controls (Extended Data Fig. 6c). In sAAb+ donors, PD1+ act. cells were mostly confined to the islet-proximal pancreas (Extended Data Fig. 6d). Notably, infiltration scores of PD1+ act. and T-exeff cells subtypes displayed the highest association to β-cell MHC-I and MHC-II expression of all T cell subtypes along pseudotime (all r > 0.72, P < 10−14), with infiltration following MHC-I expression and coinciding with MHC-II expression on β-cells (Extended Data Fig. 6e). With disease progression, exhaustion-markers PD1 and TIM-3 were more strongly expressed for both cell subtypes, as was the tissue-residency marker CD103 for T-exeff cells, which might also signal exhaustion39; the cytotoxicity marker GranB did not change (Extended Data Fig. 6f,g). Together these data suggest exhaustion of these cell subtypes within the islet microenvironment.
Next, we analysed the spatial niches of T cell subtypes to determine if these were reflective of diabetogenic processes. We identified the ten nearest neighbours of all cells, clustered the resulting cell populations into 70 cellular neighbourhoods (CNs)40 and then manually annotated them by their enriched cell types, localization and disease stage association (Extended Data Fig. 7a). Similar CNs were aggregated to yield 28 CNs. This analysis showed stronger enrichment of PD1+ act. cells and T-exeff cells in β-cell enriched CNs (‘beta’) than in other islet-cell CNs (Extended Data Fig. 7b,c), with especially T-exeff cells often in direct contact with β-cells (Fig. 4g). We also observed enrichment of both subtypes at the islet edge in mAAb+ and Onset donors (‘islet-edge mAAb+’, ‘islet-edge Onset’), which probably captures peri-islet accumulation at these stages before overt islet infiltration (Fig. 4g and Extended Data Fig. 7b,c).
In Onset donors, most non-exhausted T cell subtypes were enriched in comparison with controls (Extended Data Fig. 6a,b). Both infiltration scores and enrichment in T cell-rich CNs (‘TCD4 > TCD8’, ‘TCD8 > TCD4’) suggested key roles for TCD4 PD1low act. cells, which are probably early effector cells (Extended Data Fig. 7b), as well as for Tnaive and TEM/TCM-like cells (Extended Data Fig. 7c). These non-exhausted T cell subtypes appeared to follow accumulation of exhausted-like T cells into islets along pseudotime, apparently outcompeting Treg in islets of Onset donors (Fig. 4h and Extended Data Fig. 7d).
In sum, this indicates PD1+ T cell subtypes as critical indicators of early disease, with progressive shifts from islet-proximal tissue sites in AAb+ donors, to overt islet infiltration in Onset donors. Their β-cell directed infiltration is strongly linked to islet inflammation, especially MHC-II expression levels. Although the islet microenvironment appears to limit cytotoxicity of these cells by further exhaustion upon infiltration, with potentially also Treg playing a role, expression profiles of T-exeff cells suggest remaining cytotoxicity and thus contribution to β-cell demise.
Peri-islet macrophages are M1 polarized
Other than T cells, myeloid cells are the main immune cells that infiltrate islets during T1D progression (Fig. 3). Pancreatic myeloid cells were shown to be important for T1D pathogenesis in mouse models13, but their role has been scarcely studied in humans16. We therefore analysed myeloid cells over disease progression.
We used a combination of lineage marker expression, activation states and spatial location within the pancreas to annotate nine myeloid subtypes among the roughly 800,000 myeloid cells in our dataset (Fig. 5a). These included activated and minimally activated exocrine macrophages (exocrine act., exocrine low act.) and (peri)-islet-enriched M1/M2-like macrophages (M1/M2-like act., M1/M2-like low act.) with expression of both classical M1 and M2 markers (HLA-DR, CD163 and CD206) (Fig. 5a,b). Further, we annotated conventional DCs (cDCs), characterized by high levels of TIM-3, HLA-DR and CD11c and low levels of macrophage markers CD163 and CD206. These cells were rare (~1,100 cells) and have, to our knowledge, not been defined in human multiplexed T1D imaging studies so far. We annotated further clusters as CD54+ macrophages, exocrine MPO+ macrophages, CD11c+ macrophages and cells with non-myeloid-specific expression profiles as ‘ambiguous’.
Fig. 5: Activated M1/M2-like macrophages and cDCs interact with lymphocytes within and near islets.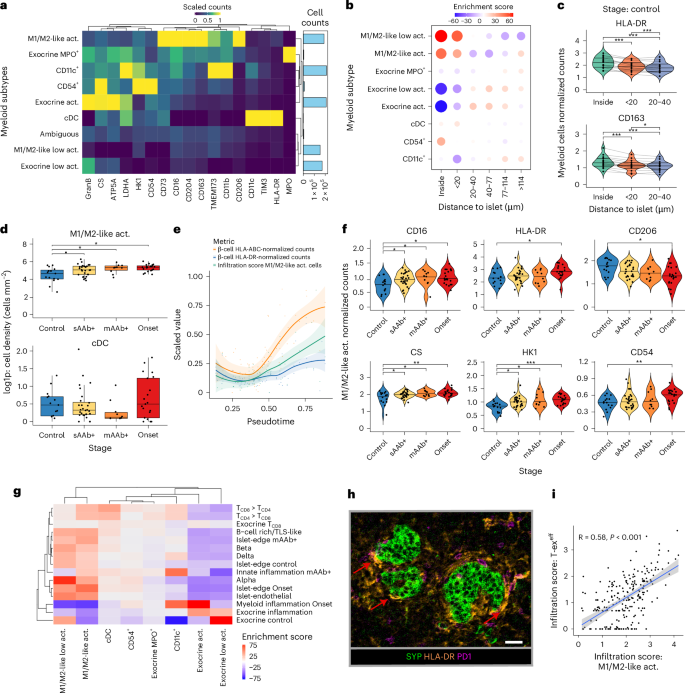
a, Lineage marker expression across annotated myeloid cell subtypes; barplots (right) indicate total cell counts. b, Enrichment of myeloid cell subtypes by distance to the islet edge (score: χ2 residuals; red, enrichment; blue, depletion). c, Expression of indicated markers in islet and peri-islet myeloid cells from 15 non-diabetic donors (each dot shows mean per donor across ROIs). Lines connect paired data by donor. Violin plot lines indicate the 25th, 50th and 75th percentile. d, Densities of indicated myeloid cell subtypes across disease stages (each dot shows mean per donor across ROIs). The centre line indicates the median, box bounds the interquartile range (IQR) and the whiskers extend to 1.5× the IQR. The transformation log1p is short for loge(1 + x), with x being the cell density. e, Scaled HLA-ABC and HLA-DR β-cell expression and infiltration scores of M1/M2-like act. macrophages along β-cell pseudotime (each dot shows mean per donor); lines indicate LOWESS fits with 95% CIs. f, Levels of indicated markers in activated M1/M2 macrophages across disease stages (each dot, mean per donor across ROIs containing β-cells). The centre line is the median. g, Enrichment of myeloid subtypes in CNs (scores: χ2 residuals; red, enrichment; blue, depletion). h, Representative ROI from a mAAb+ donor with substantial peri-islet immune infiltration. Red arrows indicate HLA-DRhigh cDCs (orange) at the SYP+ islet edge (green) in close contact with PD1+ T cells (magenta). Scale bar, 75 µm. i, Unnormalized infiltration scores of T-exeff cells and M1/M2-like act. cells in insulitic islets (containing β-cells) (i = 221). Line indicates a linear fit with 95% CIs. Two-sided Spearman’s rank correlation was used to test association. Tests: *P < 0.05; **P < 0.01; ***P < 0.001 for all comparisons. Non-significant tests are not shown; significances are FDR adjusted. Differential abundance was tested using edgeR (two-sided empirical Bayes quasi-likelihood F-test) and differential expression using a linear mixed-effects model (two-sided Wald t-test with Satterthwaite approximation). For d and f: controls: N = 15; sAAb+: N = 28; mAAb+: N = 10; Onset: N = 21.
Almost all subtypes showed a higher abundance with increasing disease stage (Extended Data Fig. 8a) for example, exocrine MPO+, exocrine act. and CD54+ macrophages were more abundant in Onset donors than at earlier stages (Extended Data Fig. 8a). Several key myeloid markers (CD163, CD206, CD16, HLA-DR, CD54 and CD11b) were more strongly expressed in islet-resident myeloid cells than in myeloid cells outside islets in all disease stages (Extended Data Fig. 8b), including non-diabetic controls (Fig. 5c). This highlights the importance of immune cell composition and activation within the peri-islet exocrine niche in both homeostasis and T1D progression.
Given their roles in peripheral immunity/tolerance, M1/M2-like act. macrophages and cDCs are probably critical in T1D41. M1/M2-like act. macrophages tended to be more frequent in the sAAb+ stage compared with controls (P < 0.1), with some inter-patient variability (Fig. 5d). By contrast, cDCs did not change frequency over disease progression (Fig. 5d). We observed a shift of both cDCs and M1/M2-like act. macrophages to the islet edge in mAAb+ and Onset (and partly in sAAb+) donors relative to controls (Extended Data Fig. 8c,d and Supplementary Fig. 7d). The M1/M2-like act. macrophage infiltration score followed the same trajectory over pseudotime as HLA-ABC expression in β-cells, especially during initial HLA-ABC upregulation, and showed cross-correlation to HLA-DR in later pseudotime (Fig. 5e). This suggests that infiltration of these macrophages is associated with both early and late islet inflammation. Marker expression in M1/M2-like act. macrophages differed over disease progression, with higher expression of metabolism markers (for example, CS and HK1), IFN-dependent pro-inflammatory markers (CD54 and HLA-DR) and monocyte markers (CD16) with progressing disease course (Fig. 5f). Interestingly, some of these expression changes were observed early in the disease (that is, CS, CD16 and HK1 differed from control donor levels in the sAAb+ stage). We also observed lower expression of classical M2 markers, such as CD206, over the disease course (Fig. 5f and Extended Data Fig. 8e). Differences in levels of other major myeloid markers, besides CD11c, were not significant (Extended Data Fig. 8f). We investigated whether the phenotypes of these M1/M2-like act. macrophages change after the loss of β-cells by comparing islets with (ICI) and without (IDI) β-cells from the same Onset donors. We observed upregulation of classical M2 markers (that is, CD163 and CD206) and downregulation of activation and pro-inflammatory markers (for example, CD54 and HLA-DR) in M1/M2-like act. macrophages from IDIs compared with ICIs (Extended Data Fig. 9a–c). Overall, these data suggest that islet inflammation that occurs early in the disease results in attraction, activation and M1-polarization of islet-resident M1/M2-like act. macrophages. This probably also includes attraction of monocytes. After loss of β-cells, macrophages return to an M2-like phenotype.
Next, we analysed enrichment of myeloid subtypes in CNs. Importantly, both M1/M2-like act. macrophages and cDCs were enriched in T cell-rich CNs (‘TCD8 > TCD4’ or ‘TCD4 > TCD8’), suggesting myeloid cell interactions with both T-CD4 and T-CD8 cells (Fig. 5g). M1/M2-like act. macrophages were enriched around islet-endothelial cells and the islet edge, spatially positioning them as key regulators of invading lymphocytes. Interestingly, they were especially enriched at the islet edge in mAAb+ donors, as were exhausted-like T cells (Extended Data Fig. 7b,c), suggesting interactions between these cell types near islets before overt islet infiltration (Fig. 5g). Indeed, we observed cDCs and M1/M2-like act. macrophages in direct contact with T cells, including exhausted-like T cells, at the islet periphery (Fig. 5h). Further, M1/M2-like act. macrophages and cDCs were enriched in insulitic islets versus paired non-insulitic islets of the same donor (Extended Data Fig. 9d). Both subtypes displayed significant upregulation of IFN-linked markers CD54 and HLA-DR in insulitic islets (Extended Data Fig. 9e), which M1/M2-like act. macrophages co-infiltrated with T-exeff cells (Fig. 5i). This indicates IFN-dependent footprints linked to T-exeff cells in myeloid cells and enhanced capacity for activation of TCD4 cells. By contrast, high TIM-3 levels on cDCs (Fig. 5b), also suggests a regulatory programme that limits autoimmunity in the pancreas42. In sum, these data suggest that specific interactions between M1-polarized macrophages and cDCs with T cells, especially exhausted-like T cells, at the islet periphery and within islets can modulate autoimmunity.
Identification of spatial, progression and age-associated immune cell motifs
T1D severity varies across age, and the disease is known to be more precipitous in young patients43. To understand the potential basis of this effect, we sought to define potential age-associated immune cell motifs. We first compared the abundance of immune cell subtypes across disease stages between younger and older donors (Fig. 6a,b). This enabled us to identify immune cell subtypes that were (i) age associated, (ii) stage associated, (iii) age and stage associated or (iv) non-associated (Fig. 6a).
Fig. 6: Age-associated immune cell phenotypes form insulitic clusters.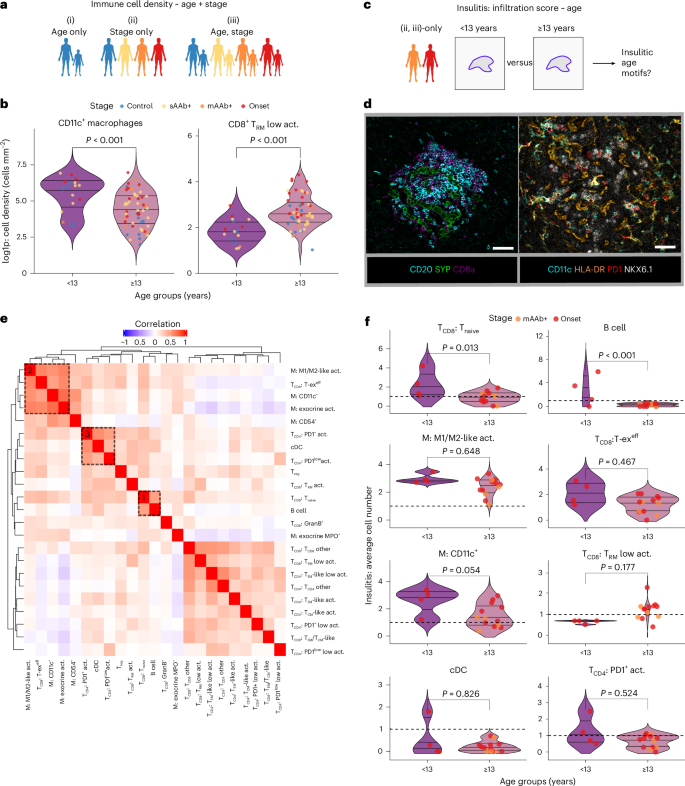
a, A schematic showing that immune cell subtypes may be (i) age associated, (ii) stage associated or (iii) both age and stage associated. The single tilde (~) denotes a model formula relating cell density to age and stage. b, Violin plots of mean density of the indicated cell types in younger (<13 years) versus older (≥13 years) donors (each dot shows mean per donor across ROIs). Additional subtypes are shown in Extended Data Fig. 10a. Lines are the 25th, 50th and 75th percentiles. The transformation log1p is short for loge(1 + x), with x being the cell density. c, A comparison of (ii) stage-associated and (iii) age- and stage-associated subtypes between insulitic islets of younger and older donors. d, Micrographs showing insulitic immune motifs in Onset donors (<13 years). Left: strong islet infiltration (SYP+) of both CD8a+ T cells and CD20+ B cells (cluster 1 in e). Right: insulitic infiltrate comprising CD11c+/HLA-DR+ macrophages in contact with PD1+ T cells (T-exeff, PD1+ act.) (cluster 2 in e). NKX6.1 marks β-cells. e, Pearson correlation coefficients of infiltration scores of the indicated stage-associated immune cell types from insulitic ROIs (≤20 µm to the islet edge). Numbers and brackets highlight immune cell motifs. Motifs contain myeloid subtypes (M). f, Mean immune cell numbers between insulitic infiltrates of < 13 year and ≥13 year donors (each dot shows mean per donor across insulitic islets). Violin lines are as in b. Tests: differential abundances were computed across age using edgeR (two-sided empirical Bayes quasi-likelihood F-tests). Significances are FDR adjusted. For b: controls: N = 15; sAAb+: N = 28; mAAb+: N = 10; Onset: N = 21. For e and f, mAAb+: N = 3; Onset: N = 14.
We identified multiple immune cell types as age-associated (i, iii) with CD11c+ macrophages being strongly enriched in younger donors (Fig. 6a,b and Extended Data Fig. 10a). CD11c+ macrophages expressed the highest level of TMEM173 (STING) of all myeloid cells, suggesting that they are type 1 IFN producing cells44 (Fig. 5b) and often expressed HLA-DR (Figs. 5b and 6d), indicating increased capacity for antigen presentation. These cells were enriched in spatial neighbourhoods with high innate immune cell content (‘innate inflammation mAAb+’) (Fig. 5g), which were more abundant in younger donors, as expected (Extended Data Fig. 10b), as well as in T cell enriched CNs (‘TCD4 > TCD8’, ‘TCD4 < TCD8’) (Fig. 5g). In combination with their potential APC capacity and enrichment in insulitic infiltrates (Extended Data Fig. 10c), this also suggests interactions with T cells. Older donors had higher abundances of marginally activated tissue-resident memory TCD8 cells (TRM low. act.) than did younger donors, at all disease stages (Fig. 6b). In comparison with other TCD8 subtypes, TRM low act. cells were enriched in exocrine tissue CNs (‘exocrine control’) found more frequently in control donors and older donors (Extended Data Figs. 7c and 10b,d). This suggests a less diabetogenic profile of TRM low act. cells compared with other TCD8 cell subtypes. Of note, while both TRM low act. cells and CD11c+ macrophages were associated with both age and disease stages (iii), trends in their abundance were apparent also in controls (both P = 0.08), suggesting that these cell types contribute both to disease and to age-associated variations in the pancreas.
Next, focusing only on TCD4, TCD8 and myeloid cell subtypes that we identified as relevant for disease progression (ii, iii), we correlated infiltration scores in insulitic islets to identify infiltration motifs (that is, combinations of cell types infiltrating these islets) (Fig. 6c). We then compared abundance of the corresponding immune subtypes within these islets between younger (<13 years) and (≥13 years) donors.
We observed two major insulitic motifs (Fig. 6d,e). First, we observed that TCD8 naive and B cells formed a cluster (Fig. 6d,e, cluster 1), suggesting the presence of B cell-rich infiltrates or tertiary lymphoid structure (TLS)-like structures (Fig. 6d). B cells and TCD8 naive cells were at higher abundance in insulitic infiltrates of younger donors in our cohort (Fig. 6f), consistent with previous results38,45. This segregation across age was not complete, however, as examples of infiltrates with high B cell content in older donors could also be found (Extended Data Fig. 10e).
A second motif in insulitic islets comprised multiple myeloid subtypes that clustered with exhausted-like effector TCD8 (T-exeff) cells, probably indicative of myeloid and T cell co-infiltration (Fig. 6d,e, cluster 2). This included not only M1/M2-like act. macrophages, as described above (Fig. 5i) but also CD11c+ macrophages. Comparison of insulitic infiltrates between younger and older donors showed no strong differences for T-exeff cells and M1/M2-like act. macrophages (P > 0.47), suggesting that this immune motif is present across age (Fig. 6f). This also applied to other key immune cell types (PD1+ act. cells and cDCs) that co-infiltrated insulitic islets (Fig. 6e,f, cluster 3). CD11c+ macrophage abundance, however, trended higher in insulitic islets of younger donors (P = 0.05), again suggesting additional age-associated effects.
In summary, analysis of immune cell type abundance across disease stages and age showed that CD11c+ macrophages and marginally activated TRM were the main immune cells that varied by age, with potential implications for homeostasis and T1D disease. Insulitic infiltrates comprising M1-polarized macrophages and T-exeff cell motifs were observed across all ages, whereas B cell-rich/TLS-like structures were enriched in younger donors, which might be associated with differential disease severity between younger and older donors.