
Single-cell atlas describes human neutrophil heterogeneity
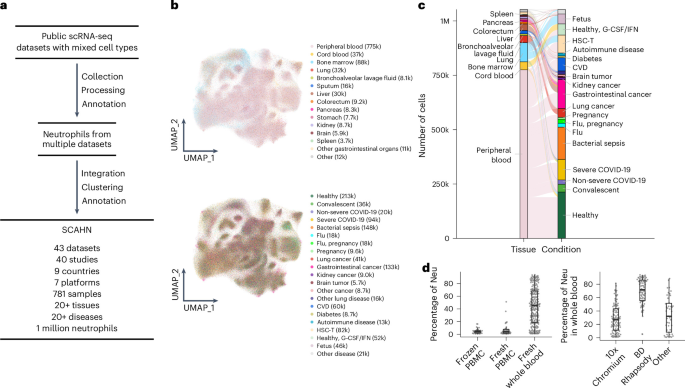
To characterize the neutrophil transcriptomic landscape in health and disease, we searched public repositories for human scRNA-seq datasets with neutrophils profiled. We integrated 1 million human neutrophils from 781 samples (43 datasets) to create SCAHN, encompassing 7 sequencing platforms, 9 countries and over 20 tissues and diseases (Fig. 1a and Supplementary Table 1). The most profiled tissues included peripheral blood, cord blood, bone marrow, lung, liver, colorectum, pancreas and spleen (Fig. 1b,c). The neutrophils came from healthy individuals or those with infection, lung cancer, cardiovascular disease (CVD), autoimmune diseases or other conditions (Fig. 1b,c). The median proportion of neutrophils was 45% in whole blood and 4% in peripheral blood mononuclear cell (PBMC) samples (Fig. 1d). In whole blood, the median neutrophil proportion was 27% for 10x Chromium and 72% for BD Rhapsody (Fig. 1d). Genes and reads detected per neutrophil did not differ consistently across technical variables such as sequencing platform, sample preservation or sample type (Supplementary Fig. 1a–c).
Fig. 1: SCAHN curates and integrates a comprehensive single-cell atlas of human neutrophils.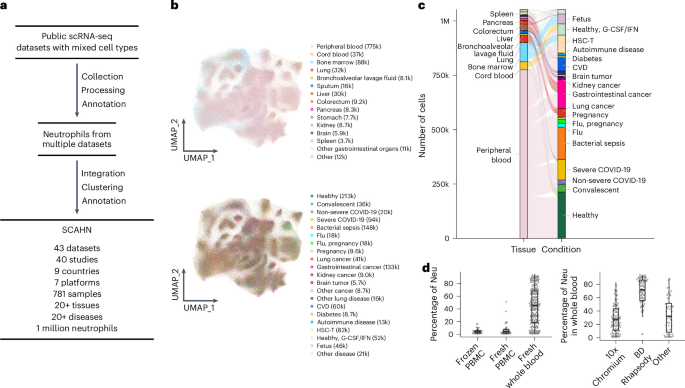
a, Schematic showing the collection and processing of human scRNA-seq datasets (Supplementary Table 1), and the generation of SCAHN by integrating and clustering neutrophils from each dataset. b, Uniform manifold approximation and projections (UMAPs) showing the tissue (top) and condition (bottom) composition of SCAHN neutrophils. Tissues represented in SCAHN are peripheral blood (samples n = 385); cord blood (13); bone marrow (31); lung (100); bronchoalveolar lavage fluid (11); sputum (30); liver (71); colorectum (10); pancreas (6); stomach (9); kidney (10); brain (13); spleen (10); and other gastrointestinal organs (33). Conditions represented in SCAHN are healthy (samples n = 103); convalescent (12); non-severe COVID-19 (19); severe COVID-19 (112); bacterial sepsis (56); influenza (4); influenza with pregnancy (3); pregnancy (2); lung cancer (87); gastrointestinal cancer (125); kidney cancer (7); brain tumor (11); other cancer (27); other lung disease (32); CVD (38); diabetes (9); and autoimmune diseases (32). c, Alluvial diagram showing the distribution of neutrophils across tissues and conditions. d, Box plots showing the proportion of neutrophils in peripheral blood according to preparation type (frozen PBMC, n = 34; fresh PBMC, n = 41; fresh whole blood, n = 225; left) and among the whole-blood samples according to sequencing platforms (10x Chromium, n = 102; BD Rhapsody, n = 80; other platform, n = 43; right). All PBMC and whole-blood samples included at least 30 neutrophils. All box plots represent the median (center line), interquartile range (IQR) (box) and 1.5 times the IQR (whiskers). G-CSF, granulocyte colony-stimulating factor; HSC-T, hematopoietic stem cell transplantation. Neu, neutrophil(s).
Our analysis identified multiple distinct neutrophil subsets (Fig. 2a–e and Supplementary Table 2). Neutrophils could be broadly classified into mature (high FCGR3B, CXCR1/CXCR2 and MME) and immature (CEACAM8 and other granule genes) subsets (Fig. 2a,b). CEACAM8 (encodes CD66b) was only expressed in immature neutrophils (Fig. 2a,b,d), despite its wide use as a general neutrophil marker. A bulk-transcriptome dataset of purified neutrophil subsets (GSE153263)10 confirmed that CEACAM8 was highly expressed in immature but not mature neutrophils (Extended Data Fig. 1). We further divided immature neutrophils according to granule type into an AZU1 subset (primary granule genes AZU1, MPO, PRTN3, DEFA3/DEFA4) and an LTF subset (secondary granule genes LTF, LCN2, MMP8, CAMP)11 (Fig. 2b–e). The AZU1 and LTF subsets made up a significantly higher proportion of neutrophils in PBMC (median 15%) than whole-blood (4%) samples (Fig. 2f,g), probably because they isolate with PBMCs during gradient centrifugation because of their lower density. Immature subsets were also more prevalent in bone marrow, spleen and cord blood than whole blood (Fig. 2f,g), which is consistent with these tissues being reservoirs of immature neutrophils and with reported extramedullary granulopoiesis in the spleen12. The AZU1 subset expressed proliferation genes (MKI67, STMN1; Fig. 2d,e), had the highest number of genes and reads detected, and the highest mitochondrial and ribosomal protein gene expression across all neutrophil subsets (Extended Data Fig. 2a–d), which is consistent with increased proliferation in neutrophil precursors3.
Fig. 2: Neutrophil subsets exhibit significant heterogeneity across mature states and tissues.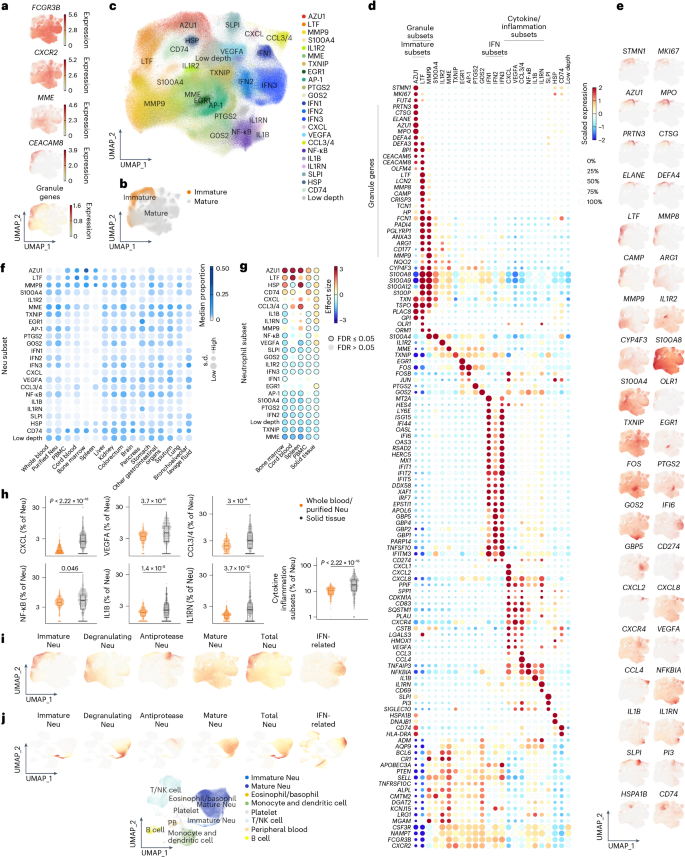
a, UMAPs showing the expression of FCGR3B, CXCR2, MME and CEACAM8, and granule genes in SCAHN as in Fig. 1b. b, UMAPs of immature and mature neutrophils in SCAHN. c, UMAP of neutrophil subsets in SCAHN. d, Heatmap of scaled geometric mean expression of top marker genes for each neutrophil subset and selected genes of interest in SCAHN. e, UMAPs showing expression of representative marker genes for each subset in SCAHN. f, Heatmap of median neutrophil subset proportions across samples within each tissue in SCAHN. g, Heatmap of Hedges’ g effect sizes comparing neutrophil subset proportions in the corresponding tissue (bone marrow, n = 31; cord blood, n = 13; spleen, n = 10; PBMCs, n = 75; solid tissue, n = 266) to whole blood/purified neutrophils (n = 263), using two-sided Wilcoxon rank-sum tests. P values were corrected together using the Benjamini–Hochberg false discovery rate (FDR) procedure. h, Box plots showing the proportion of total cytokine/inflammatory subsets (CXCL, CCL3/4, NF-κB, IL1B, IL1RN and VEGFA) among total neutrophils in solid tissues or whole blood/purified neutrophils, as in g. A two-sided Wilcoxon rank-sum test was used. All box plots represent the median (center line), IQR (box) and 1.5 times the IQR (whiskers). i, UMAPs showing neutrophil-specific and IFN signature scores in SCAHN. j, UMAPs showing neutrophil-specific and IFN signature scores across all immune cells from peripheral blood samples (5 datasets, 200 samples).
A subset that expressed both mature neutrophil markers and the tertiary granule gene MMP9 was defined as the MMP9 subset (Fig. 2c–e). LTF and MMP9 subsets had the highest expression of ARG1 and CD177 among all subsets (Fig. 2d,e). We collectively refer to the AZU1, LTF and MMP9 subsets as ‘granule subsets’. Three mature neutrophil subsets that highly expressed interferon (IFN)-related genes included a type I IFN subset (ISG15, RSAD2, IFI6; IFN1), a type II subset (GBP1/GBP2/GBP4/GBP5, APOL6; IFN2) and one expressing both (IFN3), referred to as ‘IFN subsets’13 (Fig. 2c–e). Six subsets expressed cytokine/inflammation genes and were named CXCL, CCL3/4, NF-κB, IL1B, IL1RN and VEGFA, based on their highest expressed gene (Fig. 2c–e). These six, collectively referred to as ‘cytokine/inflammation subsets’, were significantly enriched in tissues relative to whole-blood samples (Fig. 2g,h). Additional subsets were defined by top marker genes: MME subset (MME); S100A4 (S100A4/S100A6); IL1R2 (IL1R2); AP-1 (JUN, FOS); EGR1 (EGR1); PTGS2 (PTGS2); G0S2 (G0S2); SLPI (SLPI, PI3, antiproteases that neutralize neutrophil-derived serine proteases); HSP (genes for heat shock proteins); CD74 (CD74, HLA-DRA); and TXNIP (TXNIP) (Fig. 2c–e). Trajectory analysis recapitulated development from immature neutrophils through mature neutrophils enriched in whole blood to cytokine/inflammation neutrophils enriched in solid tissues (Extended Data Fig. 2e,f).
Next, we examined neutrophil subset signature gene expression in other peripheral blood immune cell types. We included 721,502 cells across 200 samples from 5 studies5,6,14,15,16, including healthy controls (n = 41) and patients with infections (n = 134) (Extended Data Fig. 3a–c). S100A8/S100A9 were among the most highly expressed genes in neutrophils, particularly in the LTF and MMP9 subsets; neutrophil reads for these genes accounted for over 78% of total reads across all cell types (Extended Data Fig. 3d–f). Genes with more than 80% of reads from neutrophils included those in immune suppression (ARG1, OLR1, CD274), systemic metabolism (CYP4F3), pro-inflammation (CXCL1, IL1R2, OLR1, ORM1, IL1B) and anti-inflammation (SLPI, PI3) (Extended Data Fig. 3d–f). Neutrophils also accounted for over 50% of the reads for most IFN-related genes (Extended Data Fig. 3d–f).
Next, we compared neutrophils with other peripheral blood immune cells to define neutrophil-specific gene signatures. Genes included in these signatures had to be expressed in at least 10% of immature or total neutrophils, had log2(fold change) of at least 1.6 versus other immune cells and had to be expressed in less than 10% of other immune cell types. We defined five neutrophil-specific signatures: immature (AZU1, BPI, CAMP, CEACAM6, CEACAM8, CRISP3, DEFA3, DEFA4, LCN2, LTF, MMP8, MPO, OLFM4), mature (ALPL, CMTM2, DGAT2, KCNJ15, LRG1, MGAM, MME, TNFRSF10C), degranulating (ARG1, ANXA3, CD177, MMP9, PGLYRP1), antiprotease (SLPI, PI3) and total (all the above genes and CYP4F3) (Fig. 2d). Signature scores, defined as the geometric mean of the expression of genes in each signature, served as markers for the corresponding compartment in bulk-transcriptome samples (Fig. 2i,j). We also defined an IFN-related signature from the top gene markers of the IFN subsets (Methods). Collectively, we compiled the SCAHN and identified multiple neutrophil subsets with diverse transcriptional programs, spanning differentiation and maturation across tissues.
Neutrophils share core programs but diverge according to species
To assess whether SCAHN enabled cross-species comparison, we first tested whether published mouse neutrophil signatures were recovered using four independent mouse datasets17,18,19,20 (Supplementary Table 3). We identified several subpopulations consistently across studies and corresponded to SCAHN subsets (Fig. 3a and Extended Data Fig. 4a–e). In NeuMap20, the most comprehensive mouse neutrophil atlas to date, each hub defined by an active transcriptional program was recapitulated in SCAHN (Fig. 3a,b). The preNeu, immature (Cebpe+Mmp8+), IFN response (Ifit1+Cd274+) and antigen presentation (H2+Cd74+) hubs corresponded to AZU1, LTF, IFN and CD74 subsets, respectively (Fig. 3a,b). The top signature genes of the NeuMap20 immunosuppression-I hub (Fosb, Egr1, G0s2 and Ptgs2) were homologs of those defining the AP-1, EGR1, G0S2 and PTGS2 subsets, respectively. The immunosuppression-II hub was characterized by Cxcl2, Vegfa, Ccl3/Ccl4 and Hspa1a, which corresponded to the CXCL, VEGFA, CCL3/4 and HSP subsets. Both hubs highly expressed Nfkbiz, Nfkbia and Tnfaip3, the overlapping signature genes of the NF-κB, IL1B and IL1RN subsets.
Fig. 3: Neutrophils share core programs but diverge according to species.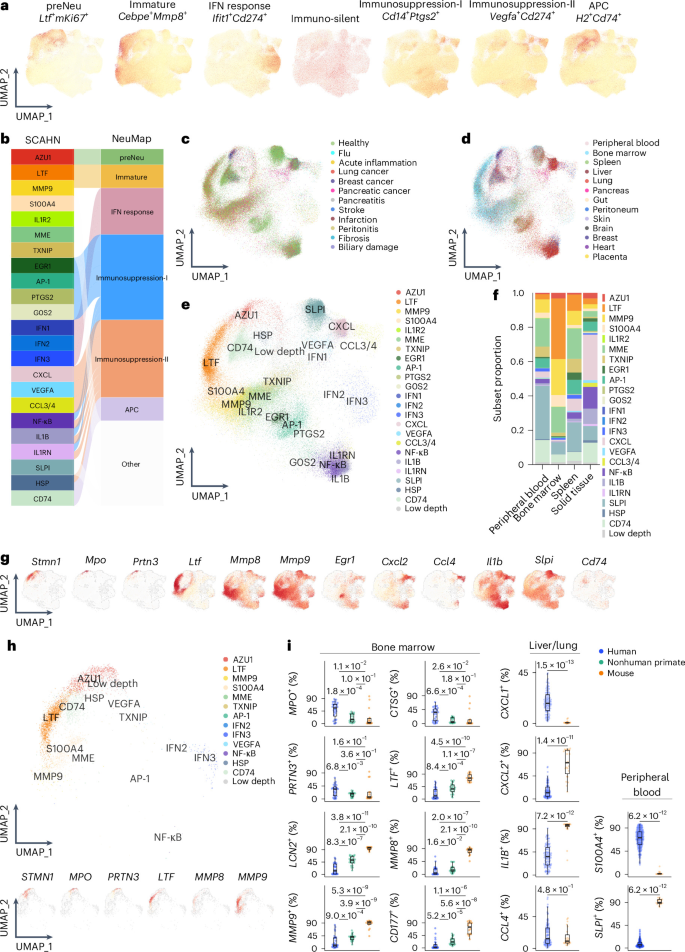
a, UMAPs showing the expression of human orthologs of top marker genes from NeuMap20 (mouse, 65 samples) hubs in SCAHN (Supplementary Table 3). b, Correspondence between SCAHN subsets and NeuMap hubs. c–e, UMAPs showing projection of mouse NeuMap cells from 13 tissues onto SCAHN using Symphony according to condition (c), tissue (d) and SCAHN neutrophil subsets (e). f, Stacked bar plot of mean neutrophil subset proportions across peripheral blood, bone marrow, spleen and solid tissues in NeuMap. g, UMAPs showing expression of selected neutrophil subset marker genes in mouse NeuMap. h, UMAPs showing projection of neutrophils from nonhuman primate bone marrow (21 samples)21 (Supplementary Table 3) onto SCAHN using Symphony (top) and UMAPs showing expression of selected neutrophil subset marker genes (bottom). i, Box plots showing the percentage of neutrophils expressing each gene across species in bone marrow (n = 28 human; n = 24 nonhuman primate; n = 14 mouse), lung or liver (n = 101 human; n = 23 mouse) and peripheral blood (n = 229 human; n = 17 mouse). Each dot represents one sample. Mouse neutrophils included cells from NeuMap20 and two other studies17,18. Nonhuman primate neutrophils included cells from two studies21,22 (Supplementary Table 3). A two-sided Wilcoxon rank-sum test was used. All box plots represent the median (center line), IQR (box) and 1.5 times the IQR (whiskers).
We further validated the human–mouse correspondence at the single-cell level by projecting NeuMap20 data onto SCAHN. Projected cells mapped broadly across SCAHN subsets, spanning immature to mature states (Fig. 3c–g and Extended Data Fig. 4f), which is consistent with the hub-level correspondence above. As in humans, mouse bone marrow neutrophils were enriched in immature subsets and solid-tissue neutrophils were enriched in the cytokine/inflammation subsets (Fig. 3f). Projecting nonhuman primate bone marrow neutrophils21 onto SCAHN also identified subsets similar to human (Fig. 3h).
Despite this conservation, SCAHN also revealed cross-species transcriptional differences. Granule genes LTF, LCN2, MMP8/MMP9 and CD177 were detected in far more mouse bone marrow neutrophils than in human or nonhuman primate21,22 (Fig. 3i), whereas MPO and CTSG were broadest in human, suggesting divergent granule gene composition during neutropoiesis. Among tissue neutrophils, CXCL2 and IL1B were expressed by a greater fraction of mouse cells, whereas CXCL1 was higher in humans (Fig. 3i). In blood neutrophils, SLPI was detected in a higher proportion in mouse cells, while S100A4 was detected in more human cells (Fig. 3i). Thus, by harmonizing neutrophils across species, SCAHN enabled systematic comparison of subset identity, transcriptional programs and species-specific features.
Neutrophil subsets associate with diverse disease outcomes
To demonstrate the utility of SCAHN for characterizing neutrophils across disease contexts, we analyzed whole-blood neutrophils from patients with infection and tissue neutrophils from patients with cancer at single-cell and bulk resolution. We analyzed seven whole-blood infectious disease scRNA-seq datasets5,6,14,15,16,23,24 consisting of 167 samples (44 healthy or convalescent controls, 21 non-severe coronavirus disease 2019 (COVID-19)/flu infection, 56 severe COVID-19 infection, 46 bacterial sepsis) from SCAHN (Fig. 4a). Compared to healthy or convalescent, proportions of AZU1, LTF and MMP9 subsets were significantly higher in severe COVID-19 and bacterial sepsis, but not in non-severe COVID-19 and flu (Fig. 4b and Extended Data Fig. 5a). The IFN1 and IFN3 subsets increased in both non-severe COVID-19 and flu and severe COVID-19, with the IFN3 subset increase greater in non-severe COVID-19 and flu than severe COVID-19 (Fig. 4b and Extended Data Fig. 5b). Bacterial sepsis had higher SLPI and IL1R2 subset proportions (Fig. 4b). Almost all granule genes and S100 genes in the granule subsets were higher in severe COVID-19 and bacterial sepsis, but not in non-severe COVID-19 and flu (Extended Data Fig. 5c). In the IFN subsets, expression of IFN-related genes (ISG15, LY6E, IFIT1) increased in both non-severe COVID-19 and flu and severe COVID-19 (Extended Data Fig. 5c). In total neutrophils, immune-suppression-related genes (ARG1, OLR1, S100A8/S100A9 and CD274) were higher in severe COVID-19 and bacterial sepsis, but not in non-severe COVID-19 and flu (Fig. 4c,d).
Fig. 4: Neutrophil subsets associate with diverse disease outcomes.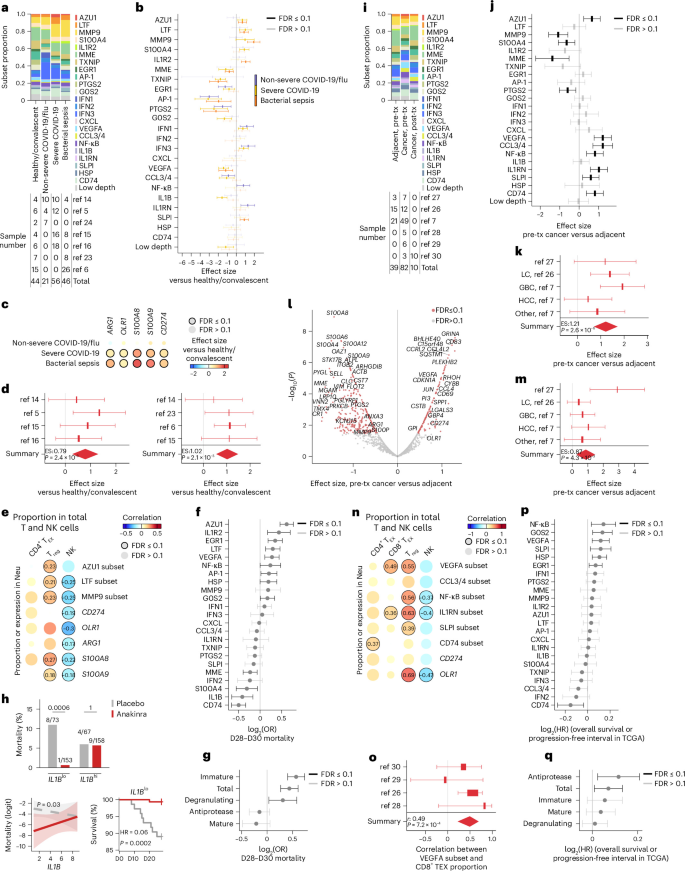
a, Proportion of neutrophil subsets in patients with infections versus healthy or convalescent in whole-blood samples from SCAHN (top) and number of samples across seven datasets (bottom). b, Forest plot showing the meta-analysis of neutrophil subset proportions in infection (non-severe COVID-19 and flu, n = 21; severe COVID-19, n = 56; bacterial sepsis, n = 46) versus healthy or convalescent (n = 44). Per-study Hedges’ g, pooled using DerSimonian–Laird random-effects meta-analysis; two-sided Wald P, Benjamini–Hochberg-corrected across subsets per contrast. c, Heatmap showing meta-analysis of ARG1, OLR1, S100A8/S100A9 and CD274 expression in total neutrophils from patients with infection, as in a and b. Per-sample mean expression across all neutrophils was compared with healthy or convalescent as in b. d, Forest plots for CD274 expression in severe COVID-19 (left) and bacterial sepsis (right) versus healthy or convalescent as in c. e, Heatmap showing the meta-correlation between T and NK subset proportions among total T and NK cells and neutrophil subset proportion or gene expression across infection datasets (healthy or convalescent, n = 43; non-severe COVID-19 and flu, n = 21; severe COVID-19, n = 51; bacterial sepsis, n = 35). Per-study Pearson’s correlation coefficient r, pooled using random-effects meta-analysis of Fisher’s z; two-sided Wald P, Benjamini–Hochberg-corrected. f,g, Forest plots showing the log2(odds ratio (OR)) of 28-day/30-day mortality in the whole-blood critical illness datasets (n = 2,833; Supplementary Table 4) for neutrophil subset signature genes (f) and neutrophil-specific signature scores (g). Per-cohort logistic regression of mortality on each score, adjusted for age and sex; log ORs pooled using random-effects meta-analysis; two-sided Wald P, Benjamini–Hochberg-corrected across subsets. h, 28-day/30-day mortality according to arm in SAVE-MORE25 individuals below and above the median baseline IL1B (placebo n = 140, anakinra n = 311; two-sided Fisher’s exact test) (top), predicted log-odds of mortality versus IL1B according to arm (logistic regression, arm × IL1B interaction, adjusted for age, sex, sequential organ failure assessment; ribbon, 95% CI; P, likelihood ratio test for the interaction, bottom left) and Kaplan–Meier survival according to arm in IL1Blo (Cox proportional HR anakinra versus placebo; P, log-rank test, bands are 95% CIs, bottom right). i, Proportion of neutrophil subsets in cancer datasets from SCAHN (top) and number of samples across six datasets (bottom). j, Forest plot showing the meta-analysis of neutrophil subset proportions in pretreatment cancer (pre-tx, n = 68) versus adjacent tissues (n = 39) for all subsets. k, Forest plot for the CCL3/4 subset in pre-tx cancer versus adjacent tissues as in i. l, Volcano plot showing the meta-analysis of gene expression in pre-tx cancer versus adjacent tissues as in j and analyzed as in c,d. m, Forest plot for CD274 expression in pre-tx cancer versus adjacent tissues as in l. n,o, Heatmap (n) and forest plot (o) showing the meta-correlation between T and NK subset proportions among total T and NK cells, and neutrophil subset proportions or gene expression, across cancer datasets (pre-tx cancer, n = 26; post-tx cancer, n = 10; adjacent tissues, n = 15) analyzed as in e. p,q, Forest plots showing the log2(HR) of overall survival or progression-free interval in the TCGA data (n = 8,205) (Supplementary Table 4) for neutrophil subset signature genes (p) and neutrophil-specific signature scores (q). Per-cancer-type Cox regression on each score, adjusted for age, sex, stage and grade. b,d,f,g,j,k,m,o,p,q, Data are presented with 95% CI estimates.
To investigate how neutrophil subsets correlated with T, natural killer (NK) and mononuclear myeloid subsets, we integrated 649,621 T and NK cells, and 449,076 mononuclear myeloid cells from the samples in SCAHN and identified subsets in each compartment (Extended Data Fig. 6a,b and Supplementary Table 1). Across the whole-blood infectious disease datasets (Fig. 4a), higher AZU1, LTF and MMP9 subset proportions and higher expression of ARG1, OLR1, S100A8/S100A9 and CD274 were associated with higher FOXP3+ regulatory T (Treg) or lower NK proportions among total T and NK cells (Fig. 4e). The IFN subset proportions positively correlated with the corresponding subsets in the other two compartments (Extended Data Fig. 6c), which is consistent with a coordinated, cross-lineage IFN response.
To test whether the signature genes of neutrophil subsets and neutrophil-specific signature scores associated with survival and severity in independent bulk-transcriptome datasets of critical illness, we used 2,148 whole-blood transcriptomes from 7 critical illness cohorts from SUBSPACE9 and 1,233 transcriptomes from 8 public datasets of infection or critical illness (Supplementary Table 4). Higher expression of AZU1, LTF, IL1R2, EGR1 and VEGFA subset signature genes were associated with higher mortality risk, while CD74 subset signature genes were associated with better survival (Fig. 4f and Extended Data Fig. 7a). Higher immature, degranulating and total neutrophil-specific signature scores were associated with higher mortality risk (Fig. 4g and Extended Data Fig. 7a). For severity rather than mortality (1,992 samples, 8 datasets; Supplementary Table 4), the signature genes of the MMP9, IL1R2, AZU1, LTF and NF-κB subsets were associated with higher, and the CD74 subset with lower risk of severe infection (Extended Data Fig. 7b,c). Although all neutrophil-specific signature scores were associated with severe disease, antiprotease and mature neutrophil-specific signature scores were not associated with worse survival (Fig. 4g and Extended Data Fig. 7b). Higher IL1B expression was associated with better survival in the critical illness datasets (Fig. 4f). To test whether the response to anakinra, an IL-1 blocker, differed according to IL1B expression, we evaluated its effect on mortality in COVID-19-induced pneumonia in the SAVE-MORE trial, a randomized controlled trial of anakinra in noncritically ill, hospitalized patients with COVID-19 (ref. 25). Dividing patients into IL1Bhi and IL1Blo groups according to median IL1B expression at baseline, we found no mortality difference between anakinra and placebo in the IL1Bhi group; however, in the IL1Blo group, anakinra significantly lowered 28-day/30-day mortality (hazard ratio (HR) = 0.06, 95% confidence interval (CI): 0.01–0.45, P = 0.0002; Fig. 4h).
We also analyzed 6 cancer scRNA-seq datasets7,26,27,28,29,30 in SCAHN consisting of 131 samples (39 adjacent normal, 82 pretreatment cancer and 10 posttreatment cancer; Fig. 4i). Four cytokine/inflammation subsets (VEGFA, CCL3/4, NF-κB, IL1RN) were higher in pretreatment cancer samples than adjacent normal (Fig. 4j), with VEGFA and CCL3/4 subsets showing the largest effect sizes (Fig. 4j,k). AZU1, SLPI and CD74 subset proportions were also higher, while MMP9, MME, S100A4 and PTGS2 were lower in pretreatment cancer than adjacent normal (Fig. 4j). Single-cell differential expression showed that top marker genes of the VEGFA, CCL3/4 and SLPI subsets (CD83, SQSTM1, VEGFA, CCL3, CCL4, SLPI, PI3), and CD274, were higher in pretreatment cancer than adjacent normal (Fig. 4l,m), whereas mature and degranulating neutrophil signatures (MME, ALPL, PGLYRP1, MMP9, ANXA3) and S100 family members were lower in pretreatment cancer than adjacent normal (Fig. 4l). Across cancer datasets, higher VEGFA, NF-κB and IL1RN subset proportions and higher OLR1 expression were associated with higher CTLA4+TIGIT+ CD8+ exhausted T (TEX) cells and FOXP3+ Treg cells, or lower NK proportions among total T and NK cells (Fig. 4n,o and Supplementary Table 1). The neutrophil cytokine/inflammation subset (VEGFA, CXCL, NF-κB, IL1RN) proportions positively correlated with their mononuclear myeloid counterparts (CCL2, CCL3/4, VEGFA), whereas the MME subset proportion negatively correlated with the CCL3/4 myeloid subsets and positively with cytotoxic GZMB+CD8+ T and NK proportions (Extended Data Fig. 6d).
Next, we examined the association of signature genes of neutrophil subsets and neutrophil-specific signature scores with clinical outcome in cancer across 8,205 tumor biopsies from The Cancer Genome Atlas (TCGA) datasets31. Higher expression of NF-κB, G0S2, VEGFA, SLPI, HSP and EGR1 subset signature genes, and antiprotease and total neutrophil-specific signature scores were associated with worse survival, while CD74 subset signature genes were associated with better survival (Fig. 4p,q and Extended Data Fig. 7d). Together, SCAHN provided a unified resource for characterizing neutrophil states across diverse disease contexts. SCAHN-derived signatures predicted patient outcomes and treatment responses in independent bulk-transcriptome datasets, demonstrating clinical relevance and translational potential.
Age, sex, body mass index and smoking shape neutrophil signatures
Next, we used SCAHN to investigate whether biological sex is associated with differences in neutrophils in healthy individuals using 33 peripheral blood samples from 17 female (median age 25.5 years) and 16 male (median age 31 years) healthy donors from 5 scRNA-seq datasets (Supplementary Table 5). The IFN3 subset proportion was higher in females, while the CCL3/4 and CXCL subsets were higher in males (Fig. 5a). When ranking genes by meta-analysis effect sizes, genes more highly expressed in males and females were enriched in marker genes of the AZU1 and IFN3 subsets, respectively (Fig. 5b). We then validated these differences using independent bulk-transcriptome datasets (Supplementary Table 5), focusing on the neutrophil-specific and IFN signatures. RNA-seq of purified neutrophils of 78 healthy individuals (20 males, 58 females)32 showed an immature neutrophil-specific signature (AZU1, MPO, CEACAM6/CEACAM8, DEFA3/DEFA4) was higher in males, whereas mature neutrophil-specific (KCNJ15, ALPL, LRG1) and IFN signatures were higher in females (Fig. 5c).
Fig. 5: Age, sex, BMI and smoking shape neutrophil signatures.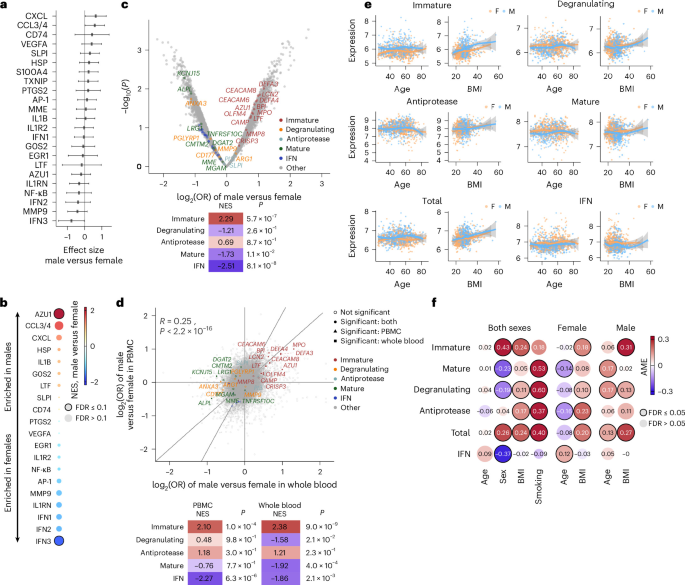
a, Forest plot showing the effect size of neutrophil subset proportion between healthy females (n = 17) and males (n = 16) in whole-blood samples from five datasets in SCAHN (Supplementary Table 5) analyzed as in Fig. 4b. b, GSEA for differential gene expression between healthy females and males, as in a. c, Volcano plot showing the age-adjusted logistic regression log2(ORs) of genes and P values between healthy females (n = 58) and males (n = 20) in purified neutrophil RNA-seq (E-GEAD-397; top). Genes in each signature have been colored. The normalized enrichment score (NES) from the GSEA for each neutrophil-specific signature gene is shown (bottom). d, Meta-analysis of bulk transcriptome between healthy females (n = 337 whole blood; n = 204 PBMCs) and males (n = 279 whole blood; n = 157 PBMCs) from 18 datasets (Supplementary Table 5). Age-adjusted logistic regression log2(ORs) are shown (top) and NES from the GSEA as in c (bottom). e, Scatter plots showing neutrophil-specific and IFN signature scores in healthy individuals (n = 433 female, n = 389 male) in the Framingham Heart Study33 on the y axes, and age or BMI on the x axes. Local regression lines were fitted using the locally estimated scatterplot smoothing method. f, Generalized linear models (GLMs) with each score as the response variable, age and BMI as continuous covariates, sex and smoking status as binary covariates, and interactions among age, sex and BMI. The average marginal effect (AME) is shown for each covariate. Samples as in e. a,e, Data are presented with the 95% CI estimates. b,d,f, Multiple hypothesis testing correction was performed using the Benjamini–Hochberg FDR.
Next, we collected 18 public blood transcriptome datasets from 977 healthy individuals aged 18–40 years (541 females, 436 males), including 616 whole-blood and 361 PBMC samples (Supplementary Table 5). Eleven of 13 genes in the immature neutrophil signature (AZU1, MPO, DEFA3/DEFA4, CEACAM6/CEACAM8) were higher in males in the sample types (Fig. 5d). Among the top 1% differentially expressed genes (DEGs), the immature neutrophil-specific signature was significantly enriched in both whole-blood and PBMC samples (P = 6.5 × 10⁻⁶). Gene set enrichment analysis (GSEA) confirmed that immature neutrophil-specific and IFN signatures were higher and lower, respectively, in males than females in both sample types, whereas the mature neutrophil-specific signature was higher in females in whole-blood samples (Fig. 5d).
Next, we used the whole-blood transcriptome of 822 healthy individuals from the Framingham Heart Study33 to investigate whether demographic factors such as body mass index (BMI) explained the observed sex differences. After adjusting for age, BMI and smoking status, immature neutrophil-specific and IFN signature scores were higher in males and females, respectively (Fig. 5e,f and Supplementary Fig. 2), as reported elsewhere34,35. The mature neutrophil-specific signature score showed age-related sex dimorphism (Fig. 5e,f). Although age’s overall marginal effect was nonsignificant, its association was negative in females and positive in males, which is consistent with reports that premenopausal women have higher neutrophil counts and neutrophil-to-lymphocyte ratio than age-matched men; the trend is reversed after the menopause36. The immature, degranulating, antiprotease and total neutrophil-specific signature scores were higher in people with higher BMI, regardless of age, sex and smoking status (Fig. 5f and Supplementary Fig. 2). All neutrophil-specific signature scores except immature were higher in smokers than nonsmokers (Fig. 5f and Supplementary Fig. 2). Together, across single-cell, purified-neutrophil, whole-blood and PBMC datasets, immature neutrophil-specific signature scores were higher in males and IFN scores higher in females, differences that held after adjusting for age, BMI and smoking. In addition, age, BMI and smoking also shaped neutrophil states.
Neutrophil signatures link to metabolic risk and mortality
Because high BMI is epidemiologically associated with diabetes37, we investigated the association of neutrophil-specific signature scores with metabolic markers (glucose, HbA1c, triglycerides, high-density lipoprotein (HDL) cholesterol) in the Framingham Heart Study33. All neutrophil-specific signature scores, except the mature score, positively correlated with glucose, HbA1c and triglycerides and negatively with HDL (Fig. 6a), including in females and males separately (Extended Data Fig. 8a,b). These correlations remained significant after excluding individuals with diabetes (Extended Data Fig. 8c), suggesting that they were not driven by diabetes. The mature score correlated only with glucose and HbA1c, but not triglycerides or HDL (Fig. 6a).
Fig. 6: Neutrophil signatures link to metabolic risk and mortality.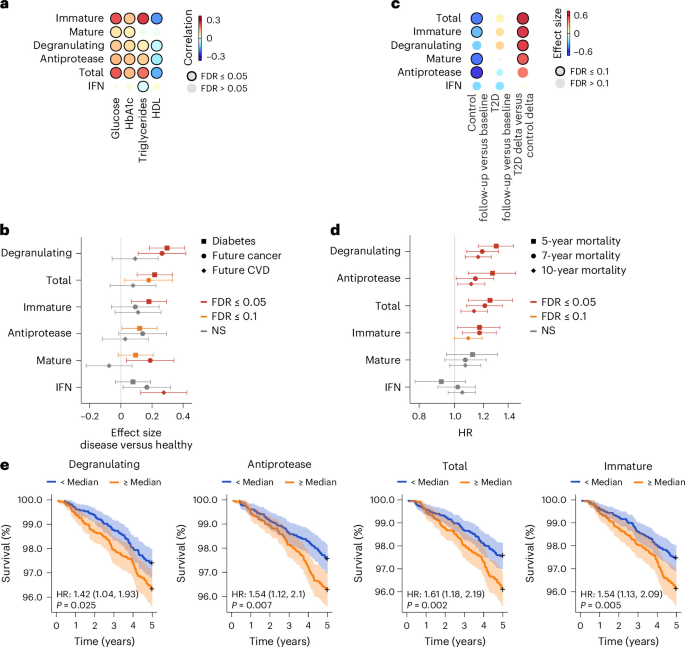
a, Heatmap showing Spearman’s rank correlation between metabolic markers and signature scores (neutrophil-specific and IFN) in the Framingham Heart Study33 (n = 5,321). b, Forest plot showing effect sizes and 95% CIs of neutrophil-specific and IFN signature scores for disease diagnosis (n = 823 healthy, n = 475 with diabetes, n = 205 future cancer, n = 226 future CVD) in the Framingham Heart Study33. NS, not significant. c, Heatmap showing effect sizes comparing neutrophil-specific and IFN signature scores between follow-up and baseline time points in the control (n = 33) and type 2 diabetes (T2D) (n = 25) groups38, and effect sizes for the difference in differences between the two groups. d, Forest plot showing the HR and 95% CI estimates from Cox proportional-hazards models in the Framingham Heart Study33 (n = 5,321), evaluating the association with 5-year, 7-year and 10-year mortality for neutrophil-specific and IFN signature scores. e, Kaplan–Meier survival according to high versus low covariate-adjusted signature scores (median split on the residual) over 5 years. HR and P from a Cox proportional-hazards model of the discretized score (likelihood ratio test). Shaded regions indicate the 95% CI. b,d,e, Signature scores were covariate-adjusted for age, sex, BMI and smoking status (and also disease in d and e).
We also examined the scores’ association with the risk of developing diabetes, cancer or CVD. After adjusting for age, sex, BMI and smoking status, all neutrophil-specific signature scores were significantly higher in patients who were already diagnosed with diabetes than in healthy controls (Fig. 6b). When comparing patients who did or did not progress to diabetes38, four neutrophil-specific signature scores decreased from baseline to follow-up (average 25 months) in those remaining diabetes-free, but increased or were unchanged in those who developed diabetes (Fig. 6c). In the Framingham Heart Study33, degranulating, total and mature neutrophil-specific signature scores associated with cancer diagnosis within 7 years after gene expression profiling, but no neutrophil-specific signature score associated with CVD diagnosis within 7 years (Fig. 6b).
Because poor metabolic health is linked to higher mortality39, we tested whether the neutrophil-specific signature scores were associated with a higher risk of all-cause mortality. In the Framingham Heart Study33, the immature, degranulating, antiprotease and total neutrophil-specific signature scores were significantly associated with all-cause mortality at 5, 7 and 10 years, with modest attenuation over time (Fig. 6d), while mature neutrophil-specific and IFN signature scores did not at any time point (Fig. 6d). Because age, sex, disease status and smoking were also associated with all-cause mortality (Extended Data Fig. 8d), we adjusted the scores by regressing out the effects of age, sex, BMI, disease and smoking. We divided the individuals using the median of each adjusted score into low-score (6e). Thus, neutrophil-specific signature scores were associated with metabolic dysfunction and higher all-cause mortality risk than expected for a given age, sex, BMI, disease status and smoking status.
Neutrophil count tracks chronic disease and mortality
Given the association of neutrophil gene expression with metabolic dysfunction and mortality, we investigated whether higher absolute neutrophil counts in routine outpatient complete blood counts (CBCs) were associated with the risk of developing chronic diseases and all-cause mortality in two EHR databases: the Stanford EHR database and the Arcadia EHR national database. In the Stanford EHR database, we included 205,817 patients who had a CBC with differential, no Charlson comorbidities at baseline and normal absolute neutrophil counts (1,500–8,000 cells per µl). We grouped these patients according to absolute neutrophil counts into the first (lowest) quartile (≤3.1 K µl−1), fourth (highest) quartile (≥5.19 K µl−1) and IQR. Patients in the highest quartile had significantly higher BMI than those in the lowest quartile, while other baseline demographics were similar (Supplementary Table 6). Patients in the IQR and highest quartile were more likely to develop at least one chronic disease in the Charlson comorbidity index than those in the lowest quartile, with HRs of 1.16 (95% CI: 1.12–1.20, P < 0.001) and 1.18 (95% CI: 1.13–1.23, P < 0.001), respectively (Extended Data Fig. 9a). By condition, IQR and highest quartile counts were associated with increased risk of developing diabetes, dementia, congestive heart failure, chronic kidney disease, peripheral vascular disease and chronic obstructive pulmonary disease (Extended Data Fig. 9b), even after sensitivity analyses for age, obesity and sex (Supplementary Table 7). We repeated this analysis in 224,771 patients with normal neutrophil counts and no baseline comorbidities in the Arcadia EHR database using the same count thresholds. Patients in the highest quartile were more likely to develop at least one chronic disease than those in the lowest quartile (HR = 1.27, 95% CI: 1.21–1.33, P < 0.001; Extended Data Fig. 9b,c). In the Stanford database, patients in the IQR and highest quartiles had significantly lower 10-year survival than those in the lowest quartile, with HRs of 1.43 (95% CI: 1.20–1.69, P < 0.001) and 1.98 (95% CI: 1.62–2.42, P < 0.001), respectively (Extended Data Fig. 9d). These findings suggested that even within a clinically normal range, higher neutrophil counts were associated with a clinically meaningful increase in the risk of developing long-term morbidity and mortality.