
Multi-tissue metabolomics in the C26 mouse model of cachexia reveals large cachexia-specific alterations in the metabolite profiles
We performed metabolomics from multiple tissues and the tumour in the well-established Colon 26 (C26) mouse model of cachexia (upon subcutaneous injection of C26 colon carcinoma cells)20. We assessed mice in either the pre-cachectic (before onset of weight loss, ‘Pre-cax’) or cachectic state (at ~10% average weight loss, ‘Cax’). As controls, we either injected mice with equal amounts of phosphate-buffered saline (PBS, ‘Ctrl’), or with non-cachexia-inducing NC26 cells (‘Non-cax’, mouse colon carcinoma)8,21 (Fig. 1a). Animals were fasted for 6 h to normalise glycaemia before performing metabolic assays and injected intraperitoneally with the stable isotopic uniformly labelled [13C6]-glucose tracer. Tumour and cachexia target tissues (plasma, liver, epididymal white adipose tissue (eWAT), inguinal white adipose tissue (iWAT), heart, gastrocnemius (GC) and soleus skeletal muscles) were collected 1 h later. Only C26 cachectic mice lost significant amounts of body weight, fat and lean mass, confirmed by tissue weights (Fig. 1b and Extended Data Fig. 2a–d). Tumour size was comparable between all groups (Fig. 1c).
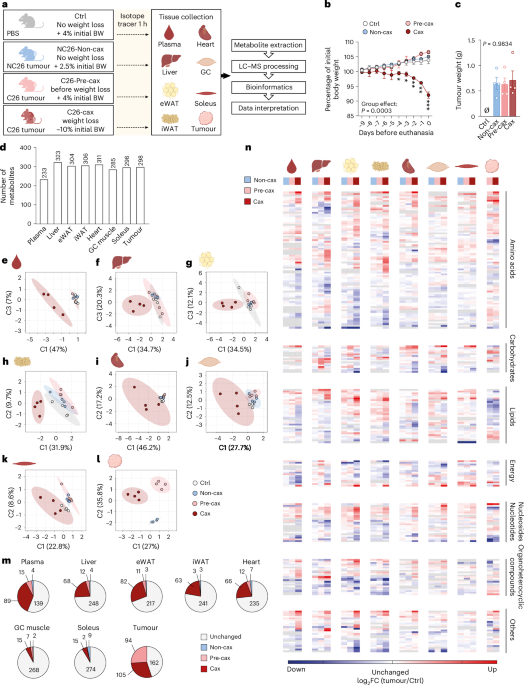
Fig. 1: Multi-tissue metabolomics in the C26 mouse model of cachexia reveals large cachexia-specific alterations in the metabolite profiles.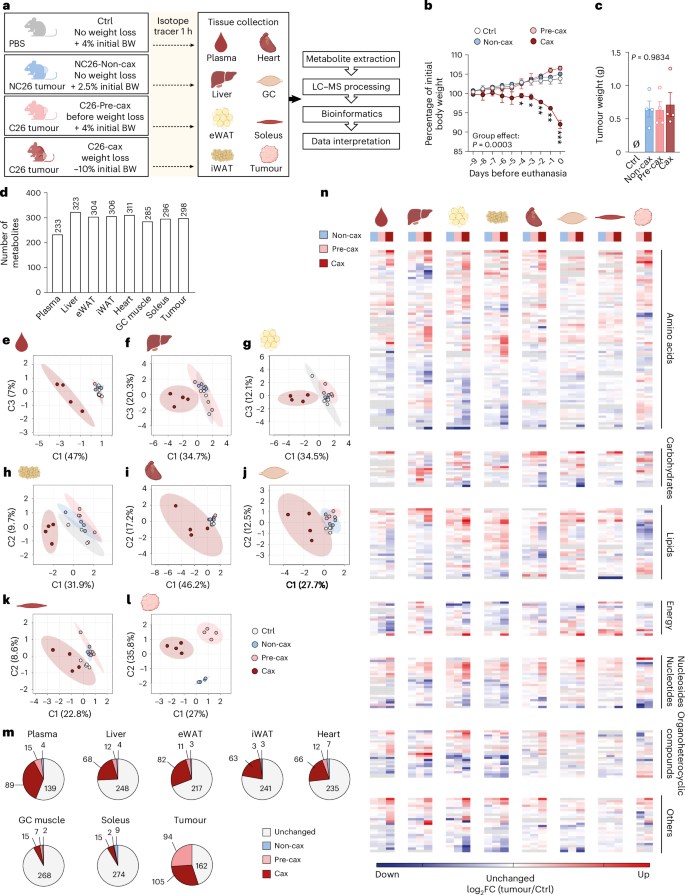
a, A schematic overview of the experimental workflow. Mice were divided into four groups: mice injected with PBS, healthy controls, no tumour (Ctrl, grey, no weight loss); mice injected with NC26 cancer cells, non-cachectic tumour controls (Non-cax, blue, no weight loss); mice injected with C26 cancer cells and killed before onset of weight loss, pre-cachectic tumour mice (Pre-cax, light red, no weight loss); mice injected with C26 cancer cells and killed once they developed cachexia, cachectic tumour mice (Cax, dark red, mean body weight (BW) loss of 10%). On the day of euthanasia, mice were fasted for 6 h and injected with an isotopic tracer ([13C6]-glucose). Tissues (plasma, liver, eWAT, iWAT, heart, GC muscles, soleus and tumour) were collected exactly 1 h later. Tissues were then processed for tracer metabolomics and results submitted to bioinformatics. n = 4 animals per group. See also Extended Data Figs. 2 and 3. b, Kinetics of body weight loss expressed as a percentage of initial body weight. c, Final tumour weight. Data are mean ± s.e.m. Statistical analysis: paired two-way ANOVA with Dunnett’s post-hoc tests versus Ctrl (b) and unpaired Kruskal–Wallis with Dunn’s post-hoc test (c). d, Total number of metabolites per tissue included in the analysis after filtering (Methods). See also Supplementary Table 1 (sum of all isotopologues; log-transformed imputed, scaled data) and our WebApp (https://m3cav.metabolomics.fgu.cas.cz/). e–l, PLSDA score plots of samples based on metabolites log-transformed imputed and scaled data for each organ, tumour and plasma; see icon legend in a. Ellipses represent 95% confidence intervals. m, Number of metabolites significantly altered in the time course of cachexia development. Grey: unchanged in Non-cax, Pre-cax and Cax versus Ctrl. Blue: significant in Non-cax versus Ctrl. Light red: significant in Pre-cax versus Ctrl. Dark red: significant in Cax versus Ctrl. List of significantly different metabolites per tissue can be found in Supplementary Table 1q–x. n, Heatmaps based on hierarchical clustering of all metabolites (Extended Data Fig. 3), which are significantly altered in at least one metabolic tissue of Cax mice, manually organised per metabolite class. Data are represented as log2 fold change (FC) (tumour group/controls). Tissues from left to right: plasma, liver, eWAT, iWAT, heart, GC muscle, soleus muscle, tumour. Groups from left to right: blue, Non-cax/Ctrl; light red, Pre-cax/Ctrl; dark red, Cax/Ctrl. Tumour: light red Pre-cax/Non-cax, dark red Cax/Non-cax. A list of metabolites and associated classes can be found in Supplementary Table 1y. m,n, Statistical analysis of filtered data: one-way ANOVA following post-hoc correction based on Tukey’s honestly significant difference procedure. Panel a and icons in e–i, k and l created with BioRender.com; icon in j reproduced from Servier Medical Art (https://smart.servier.com/) under a Creative Commons license CC BY 4.0.
Approximately 200–300 annotated polar metabolites per tissue were included in the analysis after filtering, covering a wide range of metabolite classes (Fig. 1d; for access to raw data, see Supplementary Table 1; for easy data visualization on our WebApp, see https://m3cav.metabolomics.fgu.cas.cz/). A subset of 152 common metabolites was detected in all tissues (Extended Data Fig. 2e). Partial least-squares discriminant analysis (PLSDA) and three-dimensional (3D) principal component analysis (PCA) showed that plasma, liver and adipose tissue metabolomes of C26 cachectic animals clearly clustered apart from all other groups (Fig. 1e–h and Extended Data Fig. 2f–i). Skeletal muscle and heart metabolite profiles showed a higher variability, especially in the cachectic group, and thereby no clear clustering was observed for these tissues (Fig. 1i–k and Extended Data Fig. 2j–l). NC26 and C26 tumours showed marked differences in their profiles despite equal size (Fig. 1l and Extended Data Fig. 2m,n). Non-cachexia-inducing NC26 tumours did not cause any major alterations in the metabolite profiles of host tissues compared with Ctrl (Fig. 1e–k and Extended Data Fig. 2f–l,o), highlighting that most metabolic alterations are associated with the presence of a cachexia-inducing tumour. The impact of cachexia varied across tissues with 5–38% of significantly altered metabolites (Fig. 1m and Extended Data Fig. 2o). The Pre-cax state was characterised by the alteration of a few metabolites, especially in plasma, liver, eWAT and heart, showing the progression towards a cachectic phenotype.
Hierarchical clustering across all tissues and detected metabolites revealed that most cachectic target tissues clustered apart from non-cachectic tissues, with the exception of the soleus muscle (Extended Data Fig. 3). The liver displayed a distinct metabolic profile of its own; however, the metabolites driving the clustering in other tissues were also enriched in cachectic liver. The cluster-defining metabolites were primarily associated with amino acid and nucleotide metabolism, including methylated metabolites, such as sarcosine, dimethyllysine, 1-methyladenosine and 2-methylguanosine (Extended Data Fig. 3). To highlight commonly changed metabolites within each class, we performed hierarchical clustering by metabolite class (amino acids, carbohydrates, energy, lipids, nucleosides, organoheterocyclic compounds and other) and tissue. This demonstrated that amino acids, nucleosides and organoheterocyclic compounds were jointly regulated between cachectic tissues (Fig. 1n and Supplementary Table 1q–y), suggesting a coordinated response during cachexia development.
Multi-tissue metabolomics reveals coordinated increase in one-carbon metabolism in cachectic mice
We next performed a more detailed analysis of the different classes of metabolites affected by cachexia. We mostly observed a decrease in energy-related metabolites (metabolites related to glycolysis, tricarboxylic acid (TCA) cycle and ketone bodies) in most of the metabolic tissues (Extended Data Fig. 4a–h), while the other classes did not show a unilateral change but rather a remodelling in their composition. Only a few metabolites were affected in the Non-cax and Pre-cax groups, and the Pre-cax group showed higher similarities to the Cax group (Pre × Cax comparison).
To explore the dynamic changes in metabolites between organs, we defined pseudo-time profiles of metabolite levels as a sequence of control, pre-cachectic and cachectic states (Ctrl → Pre-cax → Cax, Non-cax instead of Ctrl for tumour), mimicking the temporal progression of cancer cachexia. We performed clustering of these profiles into eight scenarios: metabolites gradually increased or decreased, at an early or a late disease stage, and so on (Fig. 2a, middle). Each cluster consisted of 24–151 metabolites. The two largest clusters (#1 and #2) were predominantly composed of amino acids, nucleosides and organoheterocyclic compounds, showing an early (#2) or late (#1) increase towards the Cax state (Fig. 2a, right). Looking at the top ten metabolites defining each cluster (Fig. 2b,c and Supplementary Fig. 1), the most prominent cluster #1 (late increase in Cax) was defined by increased levels of several methylated amino acids (for example, sarcosine/methylglycine and trimethyllysine) and derivatives of amino acid metabolism (for example, aminoadipic acid, ureidopropionic acid, glycyl-glutamate and ornithine). Cluster #5 (late decrease in Cax) included metabolites associated with energy homeostasis (for example, malic acid, adenosine triphosphate and phosphocreatine), underlining the energy deficit in cachexia. Because the same metabolite could be present in different organs, the profiles were traced back to the original organ as a flowchart (Fig. 2a, left). Remarkably, all host tissues contributed to a similar degree to the different clusters, highlighting the coordinated tissue response to cachexia, whereas the tumour seemed to have a more distinct profile.
Fig. 2: Multi-tissue metabolomics reveal coordinated increase in one-carbon metabolism in cachectic mice.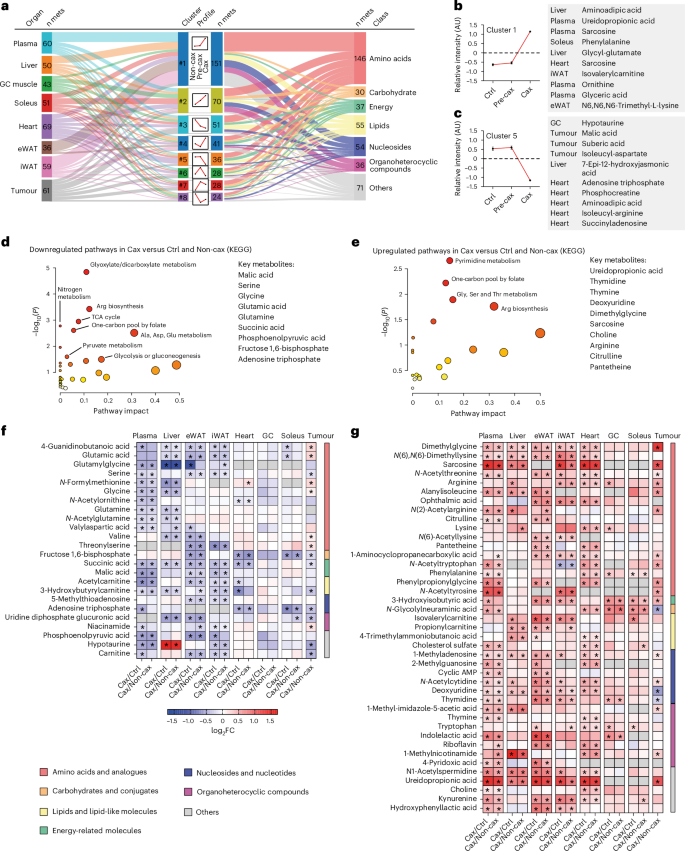
See also Fig. 1a for the experimental set-up. Ctrl: healthy controls, no tumour; Non-cax: non-cachectic tumour mice; Pre-cax: pre-cachectic tumour mice; Cax: cachectic tumour mice. n = 4 animals per group. See also Extended Data Fig. 4 and Supplementary Fig. 1. a, Cluster analysis of metabolite trajectories in the time course of cachexia progression: Ctrl (cachexia target tissues) or Non-cax (tumours) → Pre-cax → Cax. Triple flow Sankey chart showing the most represented clusters from top to bottom, associated tissues (left) and metabolite classes (right). n mets indicates numbers of metabolites contributing to each cluster. b,c, Top ten metabolites of cluster 1 (upregulated in Cax) (b) and cluster 5 (downregulated in Cax) (c). d,e, Pathway analysis (Kyoto Encyclopedia of Genes and Genomes, KEGG) of metabolites that are commonly downregulated (d) or upregulated (e) in at least two cachexia target tissues of Cax versus Ctrl mice and Non-cax mice. f,g, Heatmaps showing metabolites commonly downregulated (f) or upregulated (g) between the different cachexia target tissues. Analysis based on log2 fold change (Cax/Ctrl and Cax/Non-cax) for cachexia target tissues and (Cax/Non-cax) for tumours. Statistical analysis: one-way ANOVA following post-hoc correction based on Tukey’s honestly significant difference procedure. See also Supplementary Table 1 for log-transformed imputed data, log2 fold change and P values for each tissue. Metabolites are organised by class. *P < 0.05.
To identify metabolic signatures of cancer-induced metabolic dysfunction shared between host tissues, we next focused on metabolites that showed a significant up- or downregulation in at least two cachexia target tissues in Cax versus Ctrl and Non-cax animals (Fig. 2d–g and Extended Data Fig. 4i–l). Levels of these metabolites were altered in a cachexia-specific manner, as highlighted by the highly similar changes in Cax versus Ctrl and Cax versus Non-cax, respectively (Fig. 2f,g). ‘Amino acids and analogues’ was the most affected class. Next, by performing a pathway analysis of those metabolites (Fig. 2d,e; list in Fig. 2f,g), we confirmed that cachexia was associated with a low energetic status, as pathways related to glycolysis, glucose production or TCA cycle were significantly decreased (Fig. 2d,f). As previously reported5, amino acids in the circulation, including substrates of one-carbon metabolism (glycine and serine), were particularly depleted (Fig. 2d,f). Unexpectedly, we found that cachexia was associated with an increase in the products of one-carbon metabolism (for example, sarcosine and dimethylglycine) and related pathways, such as pyrimidine synthesis (products of the folate cycle: thymidine, thymine and ureidopropionic acid), and arginine biosynthesis/metabolism (Fig. 2e,g). Those results suggest a shift towards an increase in the products/substrates ratio of one-carbon metabolism-related metabolites in cachexia.
One-carbon metabolism is central to multiple physiological processes including nucleotide and protein biosynthesis, redox defence and epigenetic regulation of gene expression22. It comprises the joint methionine and folate cycles, contributing to essential processes including methylation reactions (DNA, RNA, proteins and lipids), selenoamino acid production, purine, pyrimidine and glutathione synthesis (Fig. 3a). To run, the cycle requires several methyl acceptors (for example, niacinamide, also known as nicotinamide (NAM) derivative of tryptophan metabolism, glycine, lysine, nucleosides and lipids) leading to the production of methylated products (for example, 1-methylnicotinamide (MNAM), sarcosine, methyllysine, methyladenosine or guanosine). One-carbon metabolism is also tightly associated with polyamine metabolism for S-adenosylmethionine (SAM) recycling (salvage pathway)23. In our dataset, we checked the overall enrichment of a large subset of substrates and (in)direct products of one-carbon metabolism (Fig. 3a,b). We observed a clear increase in the levels of the vast majority of these metabolites in all tissues of Cax animals as well as in the tumour (Fig. 3c–g and Extended Data Fig. 4m–o), especially in products of this pathway (methylated products of the methionine cycle, such as sarcosine, MNAM, methyllysines, dimethylglycine; and products of the folate cycle, such as thymidine). This is also supported by trends towards elevated SAH/SAM ratios in Cax plasma, adipose tissue and tumour (Extended Data Fig. 4p) and THF/5-methylTHF in liver (the only tissue in which such metabolites were detectable; Extended Data Fig. 4q). The effect of cachexia on one-carbon metabolites was more pronounced in blood, liver and adipose tissues; nevertheless, we observed the same enrichment profile in cardiac and skeletal muscles (Fig. 3f,g and Extended Data Fig. 4n). Interestingly, we observed tissue specificity in terms of methylated products, with MNAM being the main methyl acceptor in liver, sarcosine and methyllysine in adipose tissue and muscles. Adjacent metabolic pathways, such as creatine synthesis, were also upregulated, as reflected by a significant enrichment of creatine levels in liver and adipose tissues (Supplementary Table 1). Overall, the enrichment in products of the one-carbon metabolism suggests an activation of this pathway.
Fig. 3: Significant increases in multiple substrates and products of the one-carbon metabolism in all host tissues indicate this pathway may be involved in cachexia aetiology.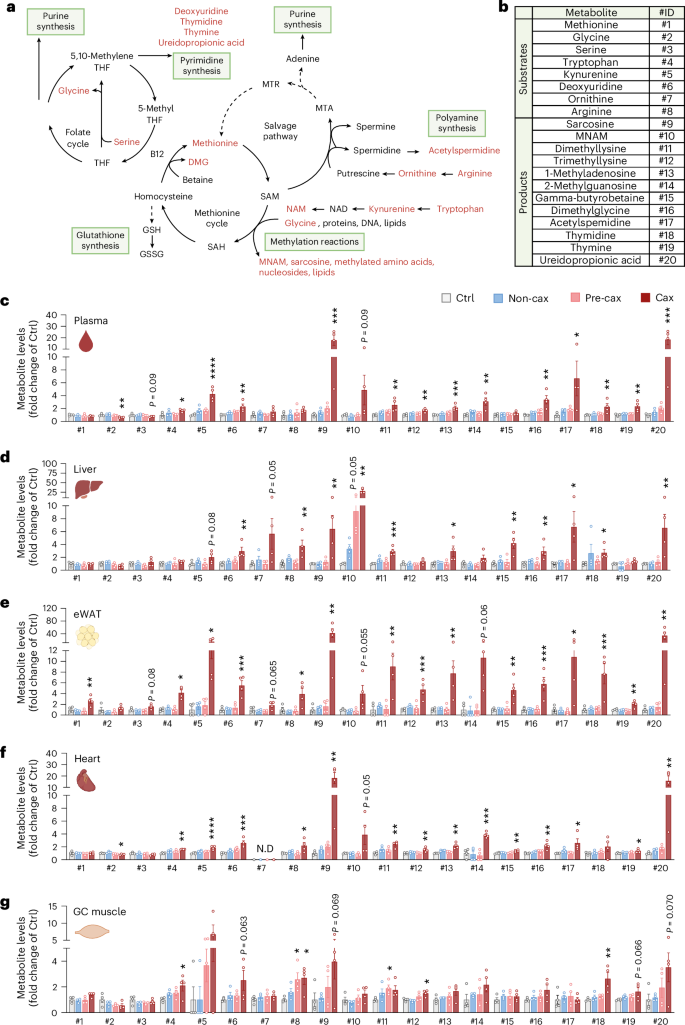
a, A graphical overview of one-carbon metabolism and related metabolic pathways. THF, tetrahydrofolate; DMG, dimethylglycine; GSH, reduced glutathione; GSSG, oxidised glutathione; SAH, S-adenosyl homocysteine; MTR, 5-methylthioribose; MTA, 5′-methylthioadenosine. b, A table showing substrates and products related to one-carbon metabolism, assigned to a specific identification number (ID). c–g, Bar graphs showing relative levels of substrates and products of one-carbon metabolism in Non-cax, Pre-cax and Cax tumour mice versus healthy controls (Ctrl), in plasma (c), liver (d), eWAT (e), heart (f) and GC muscle (g). n = 4 animals per group. See also Fig. 1a for the experimental set-up, and Extended Data Fig. 4. Data are the mean ± s.e.m. Statistical analysis based on raw data (MS signal intensities, arbitrary units (AU)). One-way ANOVA with Dunnett’s post-hoc tests versus Ctrl or Kruskal–Wallis with Dunn’s post-hoc tests versus Ctrl. *P < 0.05, **P < 0.01, ***P < 0.001, ****P < 0.0001 compared with the Ctrl group. N.D, not detected.
The analysis of metabolites jointly altered in cachectic conditions across various tissues identified one-carbon metabolism as a tissue-overarching pathway important in cachexia and indicates that this pathway may be involved in the aetiology of the condition.
Multi-omics integration identifies key nodes in cachexia-associated metabolic reprogramming under the control of IL6
To identify targetable key nodes driving metabolic reprogramming in cachexia, we next performed RNA sequencing of cachexia target tissues of the same animals as used for metabolomics (Fig. 1a; raw data can be accessed under Gene Expression Omnibus (GEO) accession number GSE290937). The differences in the mRNA expression profile of Non-cax versus Ctrl mice were minor, indicating that a tumour per se is insufficient to induce major host tissue reprogramming (Extended Data Fig. 5a–e). By contrast, we observed a huge remodelling of tissue transcriptomes in Cax compared with Ctrl mice, with cachexia explaining 89% to near 100% of gene expression changes (depending on tissues) versus tumour explaining up to 11% changes (Extended Data Fig. 5a–f). Pre-cax mice showed an in-between profile between Non-cax and Cax mice, as expected. Overall, 340 genes were significantly altered in a similar manner between metabolic tissues of cachectic animals (Extended Data Fig. 5g).
We performed a comparative pathway analysis of all genes significantly altered in the different target tissues of Cax versus Ctrl mice (Fig. 4a and Supplementary Fig. 2a) and Cax versus Non-cax mice (Extended Data Fig. 5h) and found that most pathways predicted to be activated in cachexia were related to amino acid metabolism, protein synthesis and post-translational modification (pathways #1–9), highlighting the general protein metabolism remodelling typical for cachexia2. These pathways (especially #9) also contain genes encoding for proteins related to one-carbon metabolism, such as the NAM N-methyltransferase (Nnmt, synthesis of MNAM), suggesting they are important targets for amino acid remodelling in cachexia. Other activated pathways were related to inflammatory processes (#10, #14, #18 and #21) and cancer/cachexia (#23 and #26). Meanwhile, all pathways predicted to be inhibited were related to energy production and mitochondrial function (#11, #12, #13, #15, #17 and #19). Next, seeking for potential mechanisms/pathways linking the aforementioned alterations in Cax transcriptome and metabolome, we performed an integrated pathway analysis of both datasets (Fig. 4b, Extended Data Fig. 5i and Supplementary Fig. 2b). Once again, the most significant pathways were related to amino acid metabolism (#1, #7, #12, #15, #19, #22 and #25), urea cycle and polyamine metabolism (#16 and #21), nucleotide metabolism (#9, #17 and #20), oxidative stress/detoxification signalling (#14 and #23) and energy metabolism (#2, #3, #13, #18, #24 and #26). In line with the enrichment of one-carbon metabolites, the combined analysis revealed selenoamino acid metabolism as a major hit, which contained many of the metabolites detailed in Fig. 3 (for example, MNAM and sarcosine) as well as the genes encoding for enzymes responsible for their production (for example, Mat1a, Nnmt and Gnmt). Overall, this analysis suggests a substantial, coordinated multi-level reprogramming during cachexia, which drives the deep change in tissue metabolism towards amino acid metabolism. Universal activation of one-carbon metabolism in all tissues may therefore support tissue reprogramming in cachexia through various downstream mechanisms involving protein translation and post-translational modifications.
Fig. 4: Multi-omics integration identifies key nodes in cachexia-associated metabolic reprogramming under the control of IL6.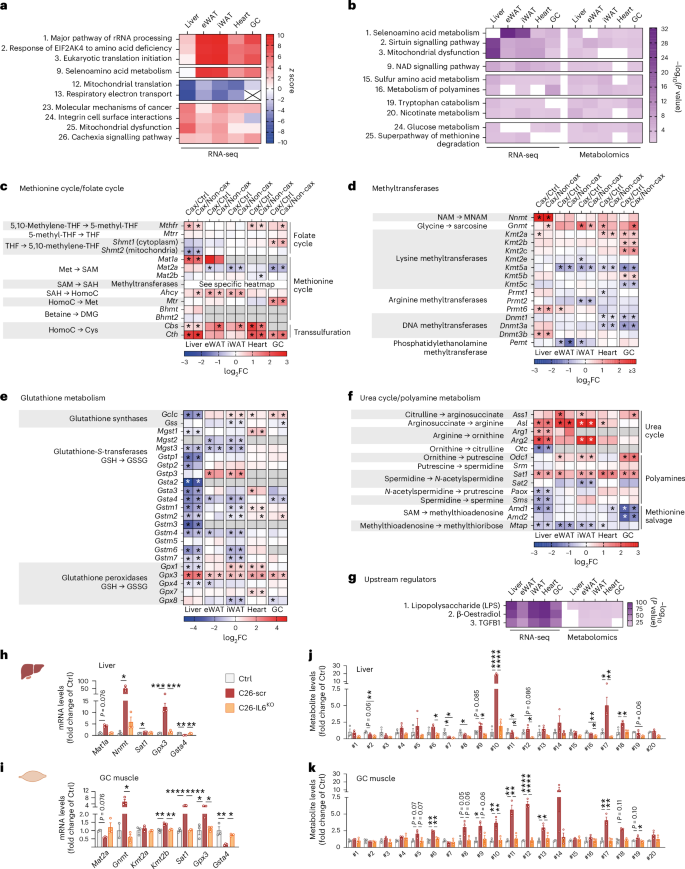
Transcriptomic analysis of cachexia target tissues from Ctrl, Non-cax and Cax tumour mice. See also Fig. 1a for the experimental set-up, and Extended Data Fig. 5. n = 4 animals per group. a, Top pathways altered in a similar manner in cachexia target tissues (liver, eWAT, iWAT, heart and GC muscle) from Cax versus Ctrl mice. Data are represented as top z scores: pathways predicted to be activated in red and inhibited in blue (IPA, Qiagen). b, Top pathways commonly altered in both transcriptomics and metabolomics datasets based on P value (IPA, Qiagen) in Cax versus Ctrl mice. Full pathway lists can be found in Supplementary Fig. 2a,b. See also Extended Data Fig. 5h–j for similar analyses in Cax versus Non-cax. c–f, Heatmaps showing the changes in mRNA expression of enzymes involved in one-carbon metabolism and related metabolic pathways (methionine cycle (c), methyltransferases (d), glutathione metabolism (e) and urea cycle (f)). Data from RNA sequencing analysis, presented as log2 fold change (Cax/Ctrl and Cax/Non-cax) and adjusted P values. *P < 0.05. Ahcy, adenosylhomocysteinase; Amd, S-adenosylmethionine decarboxylase; Arg, arginase; Asl, arginosuccinate lyase; Ass, arginosuccinate synthetase; Bhmt, betaine-homocysteine S-methyltransferase; Cbs, cystathionine beta-synthase; Cth, cystathionine gamma-lyase; Dnmt, DNA (cytosine-5)-methyltransferase; Gclc, glutamate-cysteine ligase catalytic subunit; Gnmt, glycine N-methyltransferase; Gpx, glutathione peroxidase; Gss, glutathione synthetase; Gst, glutathione S-transferase; Kmt, lysine (K)-specific methyltransferase; Mat, methionine adenosyltransferase; Mgst, microsomal glutathione S-transferase; Mtap, methylthioadenosine phosphorylase; Mthfr, methylenetetrahydrofolate reductase; Mtr, 5-methyltetrahydrofolate-homocysteine methyltransferase; Mtrr, 5-methyltetrahydrofolate-homocysteine methyltransferase reductase; Nnmt, NAM N-methyltransferase; Odc, ornithine decarboxylase; Otc, ornithine transcarbamylase; Paox, polyamine oxidase; Pemt, phosphatidylethanolamine N-methyltransferase; Prmt, protein arginine N-methyltransferase; Sat, spermidine/spermine N1-acetyltransferase; Shmt, serine hydroxymethyltransferase; Sms, spermine synthase; Srm, spermidine synthase. See also Supplementary Fig. 3 for visual integrations of transcriptomics and metabolomics data in Cax tissues. g, Top potential upstream regulators of observed changes in transcriptomics and metabolomics common to the different metabolic tissues of Cax versus Ctrl mice (IPA, Qiagen). Data are represented as top significant pathways based on P value. h–k, Relative mRNA expression levels of key enzymes (h and i) and metabolites (j and k) of one-carbon metabolism and related pathways in liver (h and j) and GC muscle (i and k) from healthy controls (PBS-injected, grey), C26-control tumour mice (C26-scramble (scr), dark red) and C26-IL6-knock out tumour mice (C26-IL6 KO, orange). Metabolite IDs as in the list presented in Fig. 3b. n = 3 animals per group. Data are the mean ± s.e.m. In h–k, statistical analysis on raw data (2−ΔCt values and MS signal intensities, arbitrary units (AU)) was performed using one-way ANOVA with Tukey’s post-hoc tests or Kruskal–Wallis with Dunn’s post-hoc tests. *P < 0.05, **P < 0.01, ***P < 0.001, ****P < 0.0001.
We next performed a targeted analysis of the different enzymes related to one-carbon metabolism in tissues of Cax mice (Figs. 3a and 4c–f). Many of them were significantly modified across multiple tissues, suggesting the upstream reprogramming of amino acid metabolism in cachexia. We observed significantly altered gene expression of many enzymes linked to different arms of one-carbon metabolism, that is, methionine/folate cycles and methyltransferases, glutathione metabolism and polyamine metabolism. We observed several tissue-specific gene expression patterns, in line with metabolite levels (Fig. 3). While Mat1a (the gene product responsible for the conversion of methionine to SAM) and Nnmt (the gene product responsible for the conversion of NAM into MNAM) were strongly induced in livers of cachectic animals, in line with a previous report24, regulation of Mat2a, Kmt2a and Kmt2b (encoding enzymes producing methyllysines) was more specific to cachectic muscle. In addition to tissue-specific gene expression changes, several changes were common across tissues, such as spermidine/spermine N1-acetyltransferase (Sat1) (suggesting an interconnection between methionine cycle and polyamine metabolism), glutathione peroxidase (Gpx3) and glutathione S-transferase (Gsta4) (suggesting alterations in detoxification processes). Pathway maps highlighting significantly altered metabolites and genes in the different tissues of Cax mice can be found in Supplementary Fig. 3.
An upstream regulator analysis of the combined transcriptome and metabolome datasets identified lipopolysaccharide and, by extension, inflammation as the first determinant to drive the substantial metabolic reprogramming occurring in cachexia (Fig. 4g and Extended Data Fig. 5j). IL6 has previously been described as a tumour-secreted and key inflammatory factor driving cachexia in the C26 model25,26,27. Thus, we assessed whether IL6 controls expression of some signature genes (Mat1a, Mat2a, Nnmt, Gnmt, Kmt2a, Kmt2b, Sat1, Gpx3 and Gsta4) in C26 tumour-bearing mice in which the Il6 gene was deleted from tumour cells (Extended Data Fig. 5k–m) or animals treated with an IL6-neutralising antibody. In both experiments, IL6 inhibition did not reduce tumour size (Extended Data Fig. 5n,o) but improved cachexia-associated weight loss (Extended Data Fig. 5p,q)25,27. Note that C26-IL6-knockout (KO) tumours grew slower than C26-scr tumours but eventually reached a comparable size at endpoint without inducing cachexia (Extended Data Fig. 5n–q). We confirmed the substantial regulation of genes related to one-carbon metabolism by IL6 in C26 cachexia in liver, GC muscle and adipose tissue in these two independent cohorts (Fig. 4h,i and Extended Data Fig. 5r–u). For instance, Nnmt induction in liver by C26 tumours was repressed by 77% with IL6-neutralising antibody, and by 89% upon IL6 KO in C26 cells. Metabolomics confirmed the significant increase of multiple products of the one-carbon metabolism in C26 cachectic liver (for example, #10 MNAM and #18 thymidine) and GC muscle (for example, #11 di- and #12 tri-methyllysine) and the near-complete absence of their enrichment upon IL6 KO (Fig. 4j,k).
Overall, our analysis suggests a coordinated remodelling of the tissue transcriptomes and metabolomes in cachexia, in part driven by the pro-inflammatory status of cachectic animals, that activates one-carbon metabolism in a universal manner to sustain the remodelling of protein metabolism inherent to cachexia.
Overactivation of the methionine cycle drives atrophy and metabolic dysfunction in myotubes
To functionally connect the activation of one-carbon metabolism with cachexia phenotypes, we treated C2C12 myotubes with different doses of L-methionine to experimentally induce one-carbon metabolism, confirmed by increased levels of associated metabolites (Fig. 5a). Interestingly, L-methionine induced myotube atrophy, a classical cachexia feature in this cell culture setting28, in a dose-dependent manner (Fig. 5b,c). Furthermore, L-methionine altered myotube metabolism towards higher glucose consumption, as indicated by lower glucose and lower pH in the cell medium (Fig. 5d,e). We thus applied the non-radioactive [13C6]-glucose tracer to L-methionine-treated C2C12 myotubes (Fig. 5f). Activation of one-carbon metabolism in myotubes induced a substantial glucose hypermetabolism (that is, condition defined by an accelerated metabolism), as indicated by the dose-dependent increase in total and labelled metabolites of the TCA cycle (Extended Data Fig. 6a–e) and the particularly higher proportion of labelled isotopologues (M + 4 and higher where applicable) (Fig. 5g–p).
Fig. 5: Overactivation of the methionine cycle drives atrophy and metabolic dysfunction in myotubes.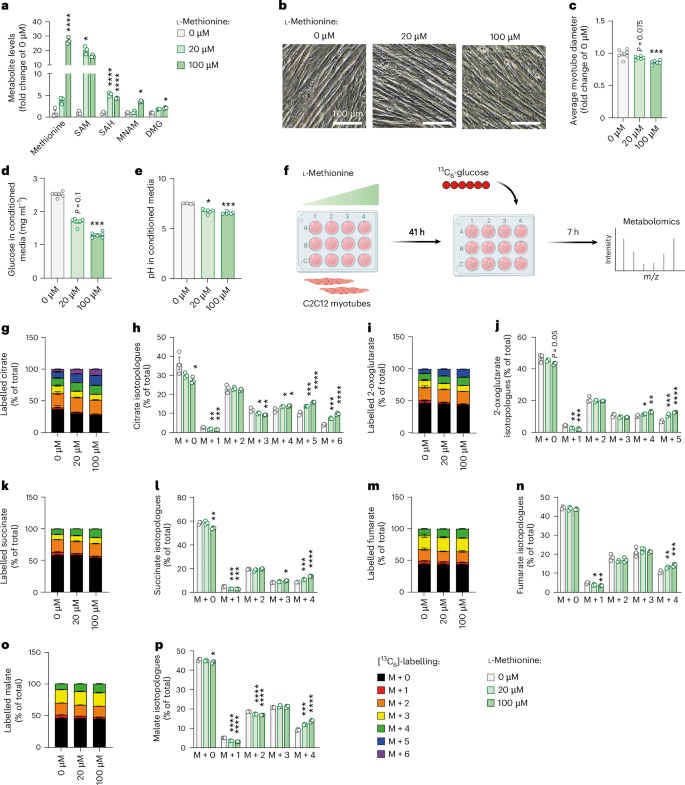
C2C12 myotubes were treated with different doses of L-methionine (0 µM, 20 µM and 100 µM) for 48 h. a, Relative levels of substrates and products of one-carbon metabolism, presented as fold change of 0 µM condition (n = 3 replicates per group). Statistical analysis was performed on MS signal intensities. b,c, Representative images (b) and quantification of myotube diameters (c) (n = 6 replicates per group). d,e, Glucose levels (d) and pH of culture media (e) (n = 6 replicates per group). f–p, Metabolic tracing experiment in C2C12 cells: after 41 h of treatment with L-methionine, glucose from media was replaced by [13C6]-glucose supplemented with different doses of L-methionine, and cells were treated for another 7 h, and then samples were submitted to tracer metabolomics (f); incorporation of labelled carbons from [13C6]-glucose into metabolites of the TCA cycle (n = 3 replicates per group) (g–p). Unlabelled metabolites are referred as M + 0 and isotopically labelled metabolites as M + X, where X represents the number of labelled carbon atoms. Data are presented as the percentage of total metabolite levels. Stacked bar graphs (g, i, k, m and o) show the overall isotopologue levels; bar graphs (h, j, l, n and p) show the levels of each individual isotopologue (citrate (g and h), 2-oxoglutarate (i and j), succinate (k and l), fumarate (m and n) and malate (o and p)). MS signal intensity (arbitrary units, AU) can be found in Extended Data Fig. 6. Data are the mean ± s.e.m. Statistical analysis: one-way ANOVA with Dunnett’s post-hoc tests or Kruskal–Wallis with Dunn’s post-hoc tests versus the 0 µM condition. *P < 0.05, **P < 0.01, ***P < 0.001, ****P < 0.0001. Panel f created with BioRender.com.
To further support the link between one-carbon metabolism, myotube diameter and glucose consumption, we next applied a specific inhibitor of the methionine cycle (FIDAS-5, inhibitor of methionine adenosyltransferase) to C2C12 cells. As expected, FIDAS-5 significantly reduced one-carbon metabolite levels (Extended Data Fig. 6f) and led to a phenotype opposite to L-methionine-treated cells in a dose-dependent manner, characterised by myotube hypertrophy associated with reduced glucose consumption, suggesting hypometabolism (Extended Data Fig. 6g–j).
As we have shown in vivo the importance of IL6 in inducing one-carbon metabolism in cachexia, we next assessed the capacity of FIDAS-5 to counteract cachexia features in C2C12 cells treated with recombinant IL6. We confirmed that the induction of IL6 signalling (Extended Data Fig. 6k,l) was associated with an induction of one-carbon metabolites (Extended Data Fig. 6m) and myotube atrophy (Extended Data Fig. 6n,o), which was rescued upon FIDAS-5 treatment. FIDAS-5 also significantly reduced glucose consumption in IL6-treated cells (Extended Data Fig. 6p,q).
Finally, we assessed whether this link between one-carbon metabolism and cachexia features was restricted to muscle cells or also applied to other cell types, that is, adipocytes. Treatment of 3T3-L1 adipocytes with different doses of L-methionine, analogous to the experiment in C2C12 cells (Fig. 5), did not affect lipolysis or glucose consumption (Extended Data Fig. 6r–t), suggesting that the connection is indeed cell type specific.
Altogether, our data suggest that activation of one-carbon metabolism is an energy-consuming process that could contribute to glucose hypermetabolism and muscle atrophy in cachexia.
Cachexia causes rewiring of glucose flux in skeletal and cardiac muscle
We next assessed alteration in glucose flux in the different tissues of cachectic mice, taking advantage of the injection of [13C6]-glucose (Fig. 1a). After 1 h, mainly intermediates of glycolysis and the TCA cycle were labelled. We observed very different responses to glucose between cachexia target tissues. In plasma and liver, total levels of TCA metabolites and labelled isotopologues were reduced, supporting previous reports showing mitochondrial dysfunction in livers of cachectic animals29,30 (Extended Data Fig. 7a,b). In WAT depots, total and labelled citrate levels were unchanged in C26-TB mice compared with controls, whereas unlabelled succinate and fumarate were increased. This indicates that alternative carbon sources (for example, from β-oxidation or amino acid degradation) feed the TCA cycle. However, because these cannot replenish the truly anaplerotic substrates, alternative carbon sources cannot keep TCA running alone, ultimately causing a block in the TCA cycle (Extended Data Fig. 7c,d). The low labelling of TCA intermediates also suggested the use of carbon units for alternative pathways such as de novo lipogenesis, a process increased in cachexia and contributing to whole-body wasting31. Cachectic C26 tumours utilised glucose for mitochondrial respiration to a lower extent compared with non-cachectic NC26 tumours (Extended Data Fig. 7e).
Curiously, while unlabelled metabolites (representing a basal state) were unchanged or rather decreased in skeletal and cardiac muscles of Cax mice (Fig. 6, Extended Data Fig. 8a–c), probably consecutive to anorexia-induced hypoglycemia, we observed an unexpected increase in the labelling of TCA metabolites in GC muscle (Fig. 6a–h), soleus muscle (Fig. 6i–p) and heart (Fig. 6q–x) upon glucose injection. As was the case for L-methionine-treated C2C12 myotubes, the percentage of label incorporation (Fig. 6 and Extended Data Fig. 8d–f), but also the labelling of higher isotopologues (M + 3 and more) of TCA cycle metabolites suggested a rewiring of glucose flux and hypermetabolism, precisely an acceleration of glucose metabolism feeding into the TCA cycle, specifically in muscle tissues in cachexia.
Fig. 6: Cachexia causes rewiring of glucose flux in skeletal and cardiac muscle.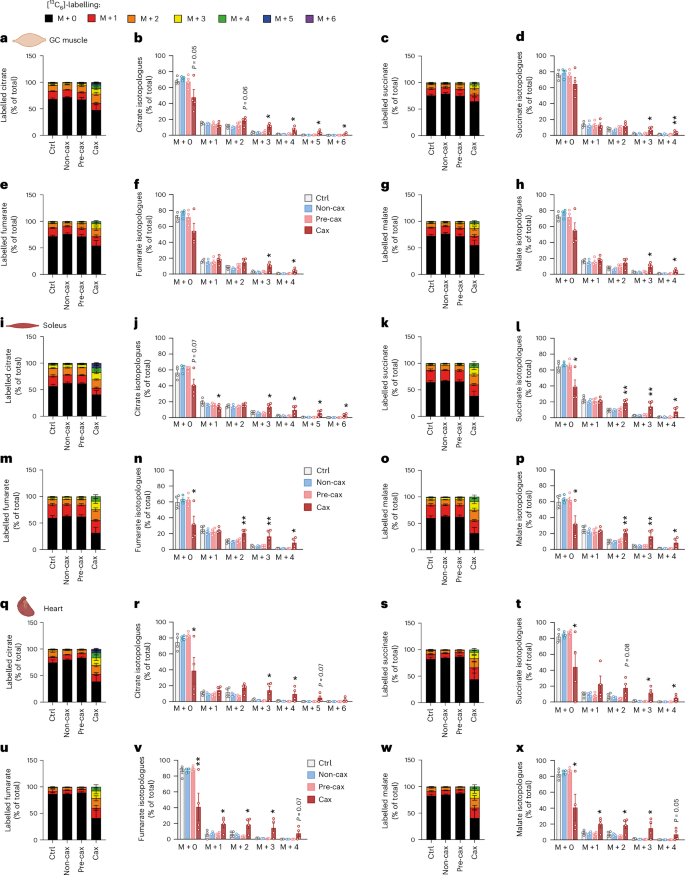
Tracing experiment using isotopically labelled glucose ([13C6]-glucose) in Ctrl, Non-cax, Pre-cax and Cax mice with tumours. n = 4 animals per group. See also Fig. 1a for the experimental set-up, and Extended Data Figs. 7 and 8. a–x, Incorporation of labelled carbons from [13C6]-glucose into metabolites of the TCA cycle in GC muscles (a–h), soleus (i–p) and hearts (q–x). Unlabelled metabolites are referred as M + 0 and isotopically labelled metabolites as M + X, where X represents the number of labelled carbon atoms. Data are presented as the percentage of total metabolite levels. Metabolites shown are citrate (a and b, i and j, and q and r), succinate (c and d, k and l, and s and t), fumarate (e and f, m and n, and u and v) and malate (g and h, o and p, and w and x). Stacked bar graphs show the overall isotopologue levels; bar graphs show the levels of each individual isotopologue. MS signal intensity (arbitrary units, AU) can be found in Extended Data Fig. 8. Data are the mean ± s.e.m. Statistical analysis: one-way ANOVA with Dunnett’s post-hoc tests versus Ctrl. *P < 0.05, **P < 0.01 compared with Ctrl.
Interestingly, M + 3-labelled citrate, succinate, fumarate and malate stem from the action of pyruvate carboxylase (PC). Thus, the significant increase in M + 3 labelling of these metabolites in muscles of Cax mice indicates that PC is active, providing intermediates to the TCA cycle. [1-13C]-pyruvate tracing in C2C12 myotubes (pyruvate labelled only on the first carbon) showed M + 1 labelling of TCA intermediates, confirming that PC is active in muscle cells (Supplementary Fig. 4). Increased M + 0 citrate and malate (derived from the non-labelled carbons of [1-13C] pyruvate) upon methionine treatment also indicated a hypermetabolic state in myotubes in which one-carbon metabolism was overactivated. Of note, the elevated M + 0 TCA intermediates without a proportional M + 1 increase in [1-¹³C]pyruvate-traced, methionine-treated C2C12 myotubes reflect the pyruvate dehydrogenase (PDH)-dominant flux pattern amplified by hypermetabolic demands, isotope dilution from unlabelled anaplerotic sources, and metabolic rewiring induced by one-carbon metabolism activation. Methionine treatment induced coordinated metabolic reprogramming that increased anaplerotic flux from multiple unlabelled sources to maintain TCA cycle function despite ongoing catabolism.
We next performed metabolic modelling of [13C]-glucose labelling data to assess the flux of different metabolite sources feeding the TCA cycle in the GC muscle of Ctrl, Pre-cax and Cax mice (Extended Data Fig. 8g,h and Supplementary Table 2). We normalised the fluxes for each group to citrate synthase activity (V12). Relative flux through PC and PDH was increased in GC muscle (V9 and V10), indicating that more glucose enters the TCA cycle. By contrast, the relative flux filling the acetyl-CoA pool from fatty acid oxidation and ketogenic amino acids (V11) was decreased. We observed a significantly increased flux through 2-oxoglutarate dehydrogenase (V18) in cachectic muscle, and trends towards increased succinate dehydrogenase, fumarate hydratase and malate dehydrogenase (V19–21) activities, supporting the increase in flux at almost all reactions of the cycle. This occurs despite normalization to citrate synthase activity, which is already elevated in Cax muscle, as shown in Fig. 6a,b. Lastly, our flux analysis highlighted the significantly increased usage of glutamine (including also glucogenic amino acid backbones) as a substrate for the TCA cycle (V16 and V17). The Pre-cax state showed trends towards increased flux in all above-mentioned reactions despite unchanged body weight and composition, indicating that glucose hypermetabolism in muscle may be an early event contributing to cachexia (Extended Data Fig. 8h).
In summary, our data revealed clear tissue-specific alterations in glucose usage in cachexia, especially an unexpected hypermetabolism of skeletal and cardiac muscles upon nutrient availability, which could contribute to energy loss in cachexia.
Activation of one-carbon metabolism is a unifying feature of cancer cachexia in mice
To assess whether the described multi-organ changes in one-carbon metabolism are specific to the C26 mouse model or a more general feature of cancer cachexia, we assessed the gene expression and metabolite profiles of liver and muscle in five additional mouse models: ApcMin (ref. 8) (genetic model developing intestinal polyps and cachexia over a few months; Extended Data Fig. 9a–g), Lewis lung carcinoma8 (LLC, heterotopic implantation, cachexia within a few weeks; Extended Data Fig. 9h–n), KPP32 (genetic model with inducible pancreatic cancer, cachexia development over a few months; Extended Data Fig. 9o–u), Panc02 (ref. 33) (pancreatic ductal adenocarcinoma (PDAC), orthotopic implantation, mild cachexia within a few weeks; Fig. 7 and Extended Data Fig. 9v–ab) and 8025 (ref. 3) (PDAC, orthotopic implantation, cachexia within a few weeks; Fig. 7 and Extended Data Fig. 9v–ab). Body weights and tissue masses corresponding to these five models are shown in Extended Data Fig. 9a–c,h–j,o–q,v–z. Panc02 cells induced mild cachexia, reflected in 3% body weight loss and a mild induction in gene expression of muscle atrophy markers (Fig. 7a and Extended Data Fig. 9x,y,aa). The 8025 cells induced more severe cachexia, and we investigated mice at two timepoints to represent mild cachexia (4% weight loss, mild induction of muscle atrophy markers) and cachexia (10% weight loss, sarcopenia), respectively (Fig. 7a and Extended Data Fig. 9x,y,aa).
Fig. 7: Activation of one-carbon metabolism is a unifying feature of cancer cachexia in mice.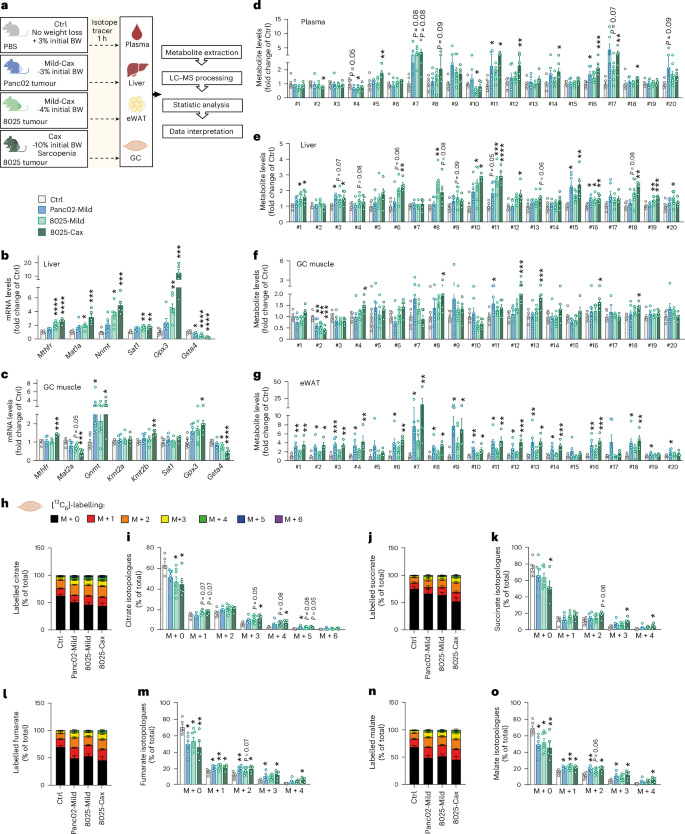
a, Experimental set-up. Mice were divided into four groups: mice injected with PBS, healthy controls, no tumour (Ctrl, grey, no weight loss, n = 6 animals per group); mice orthotopically injected with Panc02 pancreatic cancer cells, mild cachexia (Panc02-Mild, blue, mean BW loss of 3%, n = 6 animals per group); mice orthotopically injected with 8025 pancreatic cancer cells divided into two groups, mild cachexia (8025-Mild, light green, mean body weight loss of 4%, n = 7 animals per group) and cachexia (8025-Cax, dark green, mean body weight loss of 10%, sarcopenia, n = 5 animals per group). On the day of euthanasia, mice were fasted for 6 h and injected with an isotopic tracer ([13C6]-glucose). Tissues (plasma, liver, eWAT and GC muscle) were collected exactly 1 h later. Tissues were then processed for tracer metabolomics. See also Extended Data Fig. 9. b,c, Relative mRNA expression levels of key enzymes of one-carbon metabolism and related pathways in liver (b) and GC muscle (c). d–g, Metabolite levels of one-carbon metabolism and related pathways in plasma (d), liver (e), GC muscle (f) and eWAT (g). Metabolite IDs as in the list in Fig. 3b. Statistical analysis based on raw data (2−ΔCt values and MS signal intensities, arbitrary units (AU)). h–o, Incorporation of labelled carbons from [13C6]-glucose into metabolites of the TCA cycle in GC muscles. Unlabelled metabolites are referred as M + 0 and isotopically labelled metabolites as M + X, where X represents the number of labelled carbon atoms. Data are presented as the percentage of total metabolite levels. Stacked bar graphs (h, j, l and n) show the overall isotopologue levels; bar graphs (i, k, m and o) show the levels of each individual isotopologue (citrate (h and i), succinate (j and k), fumarate (l and m) and malate (n and o)). Data are the mean ± s.e.m. Statistical analysis: one-way ANOVA with Dunnett’s post-hoc tests versus Ctrl or Kruskal–Wallis with Dunn’s post-hoc tests versus Ctrl. *P < 0.05, **P < 0.01, ***P < 0.001, ****P < 0.0001 compared with Ctrl.
Expression of genes encoding for enzymes related to one-carbon metabolism, representing different arms of the pathway (Figs. 3a and 4c–f), were uniformly altered in cachexia target tissues (liver, muscle and/or adipose tissue) of the different models (Fig. 7b,c and Extended Data Fig. 9d,e,k,l,r,s,ab) and were comparable to the gene expression analysis shown in Fig. 4. These include genes encoding for key methyltransferases such as Nnmt, glycine N-methyltransferase (Gnmt) (conversion of glycine into sarcosine), Kmt2a, Kmt2b, methylenetetrahydrofolate reductase (Mthfr) (key step of folate cycle, conversion of 5,10-methyleneTHF to 5-methylTHF), methionine adenosyltransferases (Mat1a and Mat12a) (conversion of methionine to SAM), Sat1, Gpx3 and Gsta4. Once again, such analyses confirmed tissues’ specificity regarding key methyltransferases in cachexia (for example, Nnmt in liver and Kmt(s) in muscle).
As in the C26 model, we also observed an accumulation of metabolites associated with elevated one-carbon metabolism (Fig. 7d–g and Extended Data Fig. 9) (for example, #9 sarcosine, #10 MNAM, #11 di- and #12 tri-methyllysines and #18 thymidine) in the liver and muscle of cachectic animals compared with their respective controls (Fig. 7e,f and Extended Data Fig. 9f,g,m,n,t,u). In PDAC models, we also observed similar alterations in one-carbon-related metabolites in plasma and adipose tissue (Fig. 7d,g). Induction of one-carbon metabolism in the PDAC experiment was gradual with cachexia severity, with Panc02-Mild and 8025-Mild groups exhibiting gene and metabolite patterns in-between healthy controls and 8025-Cax (Fig. 7b–g and Extended Data Fig. 9ab). Of note, differences in the amplitude of the regulation of individual metabolites and genes between the various mouse experiments may be explained by several factors such as tumour entity, mouse strain, feeding status or experimental set-up. While C26, Panc02, 8025 and APCMin cohorts were fasted for 6 h, optimised for metabolic studies, LLC and KPP experiments were not specifically designed for metabolic assays and were necropsied in random-fed conditions. Nevertheless, the conserved alteration in gene expression and metabolites in six independent mouse models highlights the tissue-overarching activation of one-carbon metabolism as a hallmark of cachexia, associated with different tumour entities and cachexia trajectories.
Linking the activation of one-carbon metabolism with muscle glucose hypermetabolism, we also investigated [13C6]-glucose tracing in GC muscle of Panc02 and 8025 tumour bearing mice (Fig. 7a,h–o). 13C labelling showed an overall enrichment of labelled TCA cycle metabolites in PDAC mice compared with Ctrl, increasing gradually with cachexia severity. Tracing isotopologues also confirmed the enrichment of highly labelled isotopologues (M + 4 or higher), particularly in 8025-Cax mice, supporting the notion of increased glucose flux through the TCA cycle in cachectic muscle.
In conclusion, the PDAC experiments (representing a different genetic background, tumour entity and laboratory environment) recapitulated our main findings from the C26 model regarding one-carbon metabolism and glucose hypermetabolism.
Activation of one-carbon metabolism associated with muscle hypermetabolism is also a feature of cachexia in the humanised SW480-tumour mouse model
To verify the relevance of our findings for patients, we first checked the expression of key enzymes related to one-carbon metabolism in liver and skeletal muscle from patients with cancer with or without sarcopenia (Fig. 8a,b and Supplementary Table 3). Sarcopenia was associated with increased gene expression of NNMT and increased expression of the signature gene set overall, in accordance with our previous observation linking this pathway to muscle wasting in different mouse models.
Fig. 8: Activation of one-carbon metabolism associated with muscle hypermetabolism is also a feature of cachexia in the humanised SW480-tumour mouse model.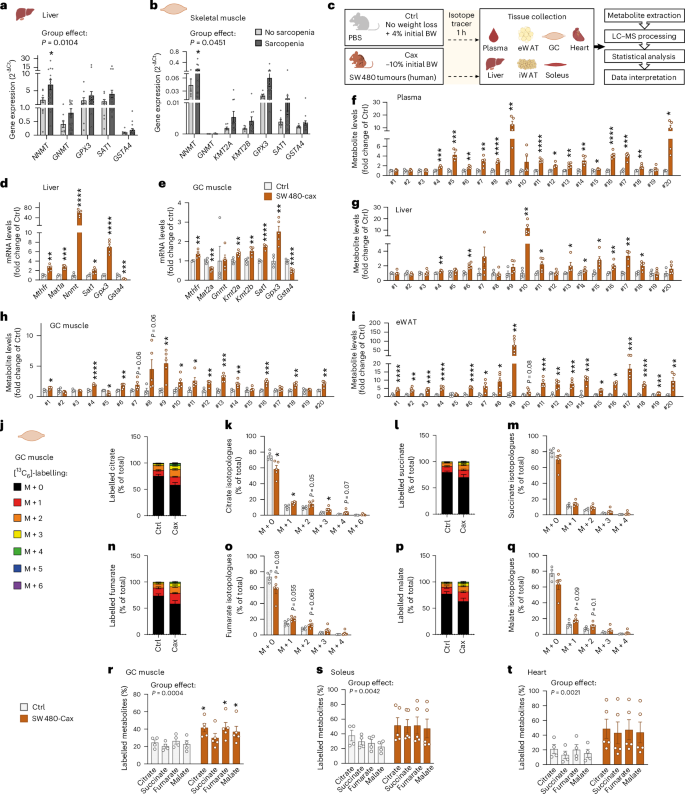
a,b, Relative mRNA expression level of key enzymes of one-carbon metabolism and related pathways in liver (a) and skeletal muscle (b) of patients with cancer with or without sarcopenia (no sarcopenia: n = 9 liver samples, 7 muscle samples; sarcopenia, n = 19 liver samples, 17 muscle samples). See also Supplementary Table 3 for patients’ clinical data. c, Experimental set-up. Mice were injected subcutaneously either with PBS (healthy control, no tumour, Ctrl, grey, n = 4 animals) or with the cachexia-inducing SW480 cancer cells (human colon carcinoma, cachexia, Cax, dark orange, mean body weight loss of 10%, n = 5 animals). On the day of euthanasia, mice were fasted for 6 h and injected with the isotopic tracer [13C6]-glucose. Tissues (plasma, liver, eWAT, iWAT, heart, GC and soleus muscles) were collected exactly 1 h later. Tissues were then processed for tracer metabolomics. See also Extended Data Fig. 10. d,e, Relative mRNA expression level of key enzymes of one-carbon metabolism and related pathways in liver (d) and GC muscle (e). f–i, Metabolite levels of one-carbon metabolism and related pathways in plasma (f), liver (g), GC muscle (h) and eWAT (i). Metabolite IDs as in the list in Fig. 3b. Statistical analysis on raw data (2−ΔCt values and MS signal intensities, arbitrary units (AU)). j–q, Incorporation of labelled carbons from [13C6]-glucose into metabolites of the TCA cycle in GC muscles. Unlabelled metabolites are referred as M + 0 and isotopically labelled metabolites as M + X, where X represents the number of labelled carbon atoms. Data are presented as the percentage of total metabolite levels. Stacked bar graphs (j, l, n and p) show the overall isotopologue levels; bar graphs (k, m, o and q) show the levels of each individual isotopologue (citrate (j and k), succinate (l and m), fumarate (n and o) and malate (p and q)). r–t, Distribution of all labelled TCA metabolite isotopologues detected in GC muscle (r), soleus (s) and heart (t). Data are the mean ± s.e.m. Statistical analysis: two-tailed, non-adjusted, Student’s t-test or Mann–Whitney test (d–i, k, m, o and q), two-way ANOVA with Šidák’s (a, b and r–t) post-hoc tests. *P < 0.05, **P < 0.01, ***P < 0.001, ****P < 0.0001 versus Ctrl or no sarcopenia groups.
We next performed metabolomics and [13C6]-glucose tracing in a humanised cachexia model (human SW480 colon carcinoma) (Fig. 8c). Tumour-bearing mice developed a clear cachectic phenotype, with a significant reduction in final body weight and tissue mass (Extended Data Fig. 10a–e). Consistent with findings from other mouse models of cachexia and from patients, gene expression of enzymes related to one-carbon metabolism was significantly changed in liver, muscle and adipose tissue of cachectic SW480 animals compared with Ctrl (Fig. 8d,e and Extended Data Fig. 10f). Furthermore, we observed a highly significant induction of metabolites related to one-carbon metabolism in all tissues from these animals, including plasma, liver, heart, skeletal muscles and adipose tissues (Fig. 8f–i and Extended Data Fig. 10g–i).
Likewise, while unlabelled TCA cycle metabolite levels in cardiac and skeletal muscles were mostly decreased or unchanged in the SW480 cachectic condition, labelled TCA cycle metabolites were enriched (Fig. 8j–t and Extended Data Fig. 10j,k), indicating higher glucose flux through the TCA cycle, comparable to the C26 and PDAC models.
Overall, our data highlight the existence of a spatio-temporally coordinated response across multiple cachexia target tissues, characterised by the activation of the one-carbon metabolism, which is conserved between multiple different models of murine and human cancer. Activation of one-carbon metabolism is associated with glucose hypermetabolism in cachectic muscle in independent models and potentially contributes to muscle wasting in cachexia.