

Constructing the scTF-seq library and single-cell atlas
To establish scTF-seq, we built a dox-inducible lentiviral open reading frame (ORF) library of 419 TFs, each tagged with a unique barcode (termed TF-ID hereafter) close to the 3′ UTR, enabling precise TF identification and quantification through 3′ scRNA-seq (Fig. 1a,b and Supplementary Table 1; Methods). Notably, viral particles were produced by individually packaging each vector to avoid barcode recombination and ensure more efficient and controllable TF overexpression than pooled virus packaging as used in most published screens3,16,18,19,20.
Fig. 1: scTF-seq design and the corresponding TF overexpression atlas.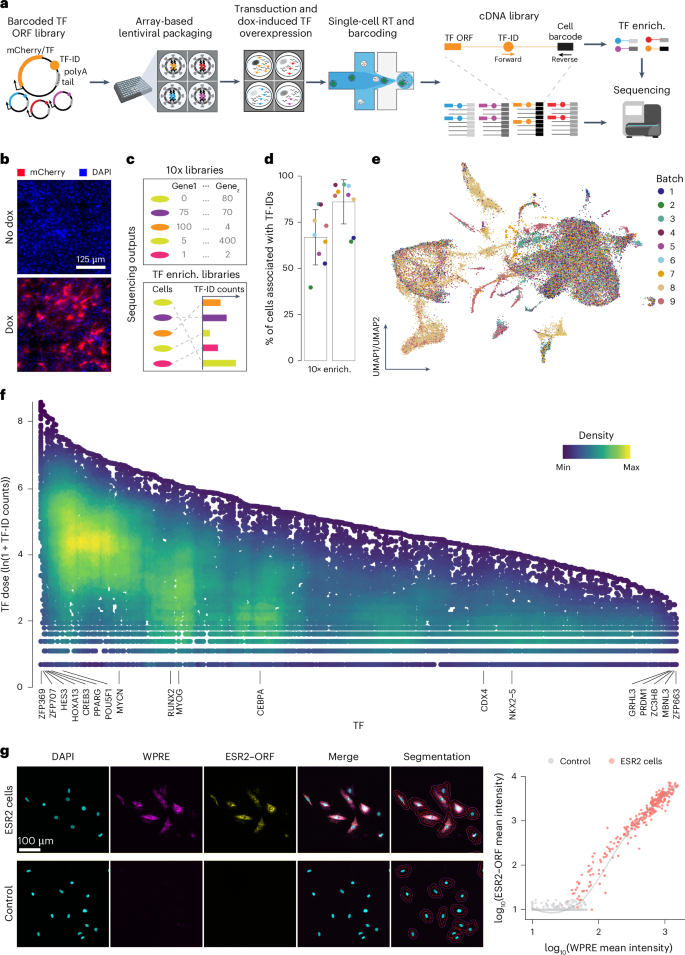
a, Schematic of the scTF-seq workflow. TF-ID, a unique barcode designed for mCherry (as control) or each individual TF; forward and reverse, primers to enrich TF-IDs. The arrayed screening schematic is created with BioRender.com. b, Fluorescence images of mCherry (red) and nuclei (DAPI, blue) in C3H10T1/2 cells treated without (no dox) or with doxycycline (dox). Representative images of more than three independent experiments. Scale bar = 125 μm. c, Schematic of the sequencing outputs of scTF-seq—count matrices of gene expression in 10x libraries (top) and ectopic TF-ID expression in TF-enrichment libraries (bottom) for each sequenced cell. d, Percentage of cell barcodes associated with TF-IDs in 10x or TF-enrichment libraries. Colors represent nine independent scTF-seq experiments (also referred to as ‘batches’, see color legend in e). Error bars represent the mean ± s.d. e, UMAP of scTF-seq data involving 45,987 cells and 384 TFs after quality control and preprocessing (referred to as ‘TF atlas’). Colors represent batches. f, Natural log-transformed TF expression levels (TF dose) in cells overexpressing individual TFs. Colors represent cell density (number of neighbors) after randomly sampling up to 500 cells for each TF. g, Left: RNAscope images for DAPI, WPRE (proxy for TF dose), ESR2–ORF in ESR2 (top) and control (bottom) cells. All fluorescence channels were merged for cell segmentation, indicated by the red (cell boundary) and purple (expanded cell boundary) outlines. Representative images of two independent experiments. Scale bar = 100 μm. Right: single-cell RNAscope quantification showing the log-normalized mean intensity of WPRE versus ESR2–ORF in control and ESR2 cells. Fitted model = LOESS (Extended Data Figs. 1 and 2). RT, reverse transcription; LOESS, locally estimated scatterplot smoothing; UMAP, uniform manifold approximation and projection; enrich., enrichment.
To assess the functionality of the scTF-seq library, we introduced it into mouse MSCs (C3H10T1/2)21 through arrayed lentiviral packaging and transduction, enabling high transduction efficiencies and dox-induced overexpression of individual TFs (Fig. 1a and Supplementary Notes 1–4). We chose C3H10T1/2 cells for their multipotency to differentiate into adipocytes, chondrocytes, osteoblasts or myocytes, thus providing a diverse range of cell fates to investigate TF-driven reprogramming22,23,24. To correct for spontaneous differentiation of C3H10T1/2 cells when reaching confluence21,25 and benchmark TF-induced changes, we included confluent and non-confluent mCherry-overexpressing cells as controls, and adipogenic cocktail-treated and Myog-overexpressing cells as references (Adipo ref and Myo ref; Methods). The transcriptomes of cells from nine batches were profiled using droplet-based scRNA-seq, while TF-IDs were enriched and robustly detected in parallel (Fig. 1a,c,d and Supplementary Note 5; Methods). After TF-ID assignment to cells and stringent quality control to remove low-quality cells and doublets (Extended Data Fig. 1a, Supplementary Table 2 and Supplementary Note 5; Methods), we obtained 45,978 cells covering 384 individual TFs and 7 TF combinations (detailed information is presented in the following sections). The number of cells (on average 116 cells per TF or TF combination) was uniformly distributed among TFs and batches, supporting the advantage of array-based sample preparation (Extended Data Fig. 1b). Leveraging the TF-enrichment library as a highly accurate and sensitive readout of the TF-ID, we quantified the TF overexpression level in a cell by the log-transformed unique molecular identifier (UMI) count of its assigned TF-ID (referred to from now on as TF dose). Batch effects were systematically evaluated and effectively corrected, allowing robust data integration (Fig. 1e and Supplementary Note 6).
As designed, the array-based lentiviral transfection and transduction strategies allow the implementation of a high multiplicity of infection (MOI; Supplementary Notes 2 and 3), leading to broad viral copy number variations. This, together with differences in transcriptional activity driven by random transgene integration and promoter fluctuation, likely contributes to the substantial dose variation observed across cells for most TFs (Fig. 1f). We validated that TF-ID counts correlate well with actual TF ORF expression using multiplex RNA in situ hybridization (RNAscope; Fig. 1g and Extended Data Fig. 1c). This supports the use of TF-ID counts as a reliable proxy for exogenous TF expression both at the RNA and protein level, which is a sensible approach given the generally reasonable correlation between mRNA and protein abundance across various contexts26. Finally, we determined that a wide dose range is critical for enhancing sensitivity in detecting differentially expressed genes (Extended Data Fig. 2a), uncovering both linear and nonlinear (and non-monotonic) dose-related effects missed in prior studies (Extended Data Fig. 2b–d).
Identifying TFs directing lineage differentiation
As the activation of lineage developmental genes generally occurs in the G0/G1 phase27, we focused on G0/G1 cells (Extended Data Fig. 2e and Supplementary Note 7) to study the roles of TFs in directing lineage differentiation. By quantifying TF-driven transcriptomic variation, we identified a subset of TF-overexpressing cells (simplified as ‘TF cells’ hereafter) that were transcriptomically similar to controls and labeled them as ‘non-functional’ (Supplementary Note 8). This was commonly observed among TFs but typically only in a subset of TF cells, implying that TF overexpression tends to induce various degrees of transcriptomic reprogramming. Upon closer inspection, we found that higher doses correlate with more pronounced transcriptomic changes, indicating TF dose as a primary determinant of this reprogramming heterogeneity (Supplementary Note 8). Subsequently, we performed clustering on the TF atlas excluding non-functional TF cells (Fig. 2a,b and Extended Data Fig. 3a,b; Methods). Clusters 2, 3 and 5 showed strikingly higher levels of lineage markers Bglap2, Fabp4 and Mylpf (Extended Data Fig. 3c), representing osteogenic, adipogenic and myogenic programs, respectively. Adipo and Myo ref cells colocalized with clusters 3 and 5, respectively (Fig. 2a,b), validating the adipogenic and myogenic identities of these two clusters. Cluster 8 showed high expression of interferon-stimulated genes like Isg15 and was enriched for inflammatory pathways (Extended Data Fig. 3c,d). Cells reprogrammed by HEY1 (ref. 28), LZTS2 (ref. 29), HNF4A30 and ZFP692 were predominantly distributed in cluster 8. Despite the lack of clear functional information associated with inflammation for these TFs, the colocalization of their cells in cluster 8 with IRF3 cells (a well-established immunomodulator31) suggests their role in regulating inflammatory response genes.
Fig. 2: TFs directing lineage differentiation and immunomodulation.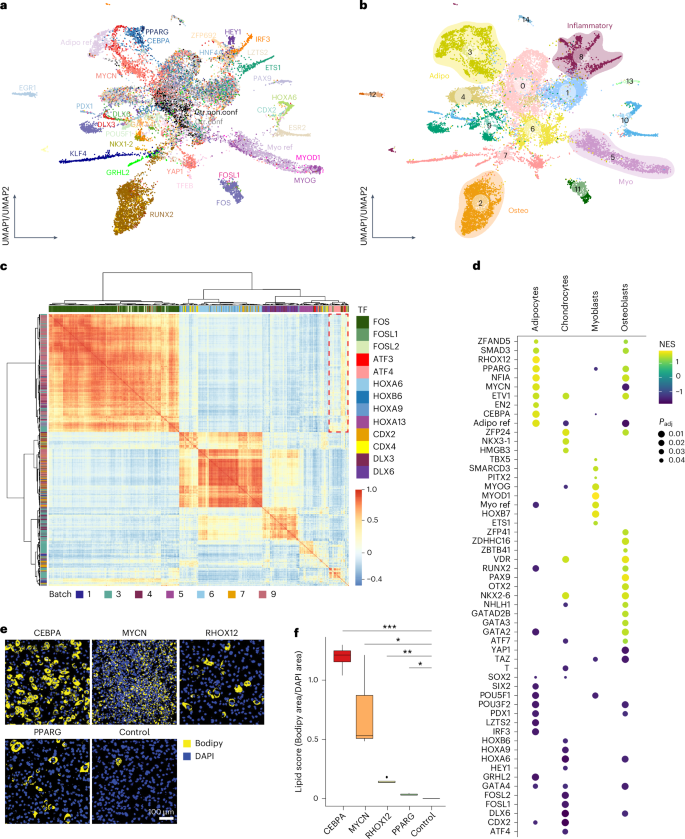
a,b, UMAP plot of the integrated TF atlas with control, functional and proliferating cells (referred to as the ‘functional TF atlas’). Colors represent assigned TFs (a) and clusters (b). ‘Ctr.conf’ and ‘Ctr.non.conf’ in a represent confluent and non-confluent control (mCherry-overexpressing) cells, respectively. Colored circles in b highlight clusters having gene expression profiles related to myogenic, osteogenic, adipogenic lineages or immunomodulation (Inflammatory). c, Heatmap showing a pairwise Pearson correlation of functional TF cells annotated by TF (in column) and batch (in row). Cells are ordered by hierarchical clustering. The red dashed box represents the transcriptomic similarity of cells reprogrammed by FOS and ATF TF families. d, Dot plot showing a functional cell expression profile enrichment of each TF in the four main differentiation lineages of multipotent stromal stem cells. Only TFs having at least 25 functional cells and enriched in at least one of the four lineages with adjusted P < 0.05 are shown. e, Fluorescence images of lipids droplets (stained with Bodipy, yellow) and nuclei (stained with DAPI, blue) in CEBPA, MYCN, RHOX12, PPARG and mCherry (control) cells after 5 days of dox-induced overexpression. Representative images of two independent experiments, with one to two independent wells for each. Scale bar = 100 µm. f, Standard boxplot (Methods) showing the quantified lipid scores (Bodipy area/DAPI area on the images shown in e) of individual TFs and the control. Data were collected from two independent experiments, with one to two independent wells for each. *P < 0.05, **P < 0.01, ***P < 0.001, pairwise two-sided t test followed by false discovery rate (FDR) correction. See Supplementary Table 5 and Methods for statistics and exact P values (Extended Data Fig. 3). Myo, myogenic; osteo, osteogenic; adipo, adipogenic.
We then computed TF–cell similarities to infer functional modules that govern the same gene expression programs (Extended Data Fig. 3e; Methods). As exemplified in Fig. 2c, pronounced intrafamily and interfamily correlations were detected among CDX, HOX, and DLX TFs, consistent with their shared role in anterior-posterior patterning and their common evolutionary origin32. However, correlations were less evident between HOXA13 and most TFs in these families (Fig. 2c), corroborating a distinct role for HOXA13 (refs. 33,34). Analogous functional characteristics were also observed for TFs with known physical interactions, such as the activator protein 1 (AP-1) formed by cross-family FOS and ATF family members35. These results emphasize the value of our scTF-seq atlas for exploring TF interactions and functional analogies.
Gene set enrichment analysis (Methods) recovered known MSC lineage-specific TFs, such as RUNX2, PAX9 and GATA2 for osteogenesis36,37,38,39; HOXB7, MYOG and MYOD1 for myogenesis40,41,42; NKX3-1 for chondrogenesis43; and SMAD3, PPARG and CEBPA for adipogenesis44,45,46 (Fig. 2d). We also identified TF candidates not yet described as implicated in MSC lineages, including OTX2 in osteogenesis, HMGB3 in chondrogenesis and MYCN and RHOX12 in adipogenesis, as experimentally validated for the latter two TFs (Fig. 2d–f and Extended Data Fig. 3f). However, unlike CEBPA, PPARG and RHOX12 cells, MYCN cells lacked Plin4 expression (Supplementary Table 3), a late adipocyte differentiation marker essential for lipid droplet association47. This is consistent with the smaller, scattered lipid droplets observed in MYCN cells (Fig. 2e,f). Thus, while all these TFs promoted adipogenesis, scTF-seq data suggest that MYCN may act using a distinct mechanism, which is explored further below.
Quantifying TF reprogramming capacity and dose sensitivity
We then quantified the relative transcriptome variation between each cell and the centroid of controls (Fig. 3a; Methods). As expected, the transcriptomic alterations were overall greater in TF cells compared to control ones, as well as in functional TF cells relative to their nonfunctional counterparts (Extended Data Fig. 4a,b). To compare the exogenously expressed TF dose to the endogenous one in normal physiological contexts, we contrasted the minimal functional dose at which an overexpressed TF leads to a substantial transcriptomic difference to the dose observed in vivo (Methods). We found that, for about half of TFs, the exogenous functional dose aligns with its physiological range, including TFs such as Runx2 in plasmacytoid dendritic cells, Meis2 in neuron subsets and Cebpa in adipocytes (Fig. 3b–e and Extended Data Fig. 4c). Notable exceptions include Pparg, lipid ligand-activated, Nfkb1, inhibited in steady-state by IκB and various homeobox TFs that tend to function combinatorially (Fig. 3d and Extended Data Fig. 4c). By visualizing transcriptomic change over TF dose, we found that TFs differ in how their effect is modulated by dose (Fig. 3b–f). Some TFs induce substantial transcriptomic changes even at very low doses, while others require higher doses to achieve their effect plateau.
Fig. 3: Characterizing TF dose sensitivity and reprogramming capacity.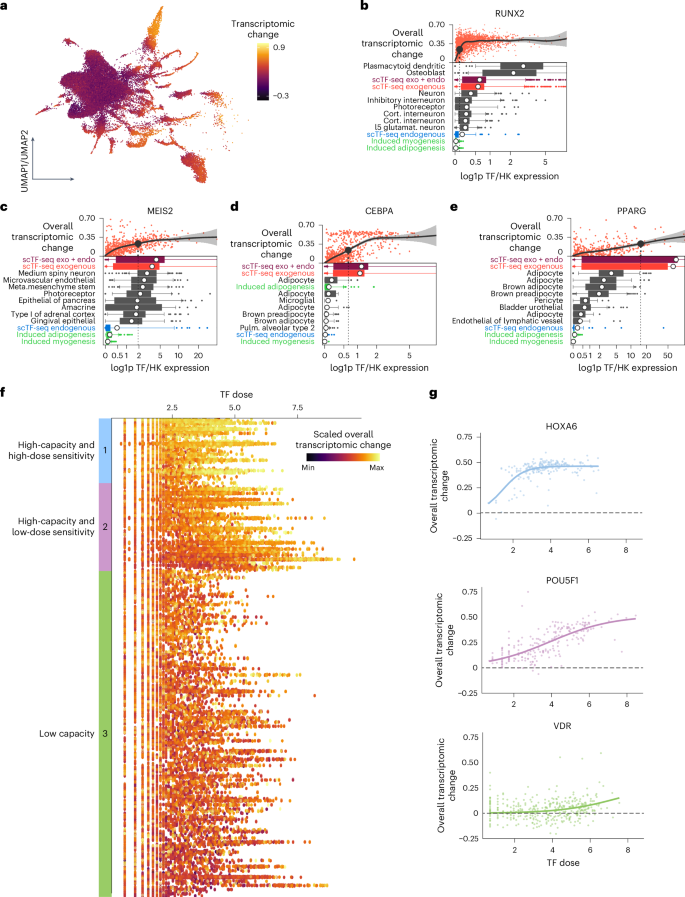
a, UMAP plot of the TF atlas after regressing out the heterogeneity specific to control cells, colored by overall transcriptomic changes (Methods). b–e, Comparison of physiological and exogenous dose for RUNX2 (b), MEIS2 (c), CEBPA (d) and PPARG (e). Top scatterplots indicate the change in overall transcriptomic response (distance in PCA space to control cells) over various doses. The dashed line represents the minimal functional dose at which the overall transcriptomic change is above 0.23. Bottom boxplots show the range of doses in the given cell type (boxes representing 25th and 75th percentiles, with 1.5× IQR as whiskers and the mean as the white dot). Endogenous TF expression for induced adipogenesis or myogenesis (teal), the endogenous TF expression in mCherry-overexpressing cells (blue) and this expression added to the exogenous expression (purple). f, Dot plot showing the scaled, overall transcriptomic change of TF-overexpressing cells over TF dose. Each dot represents a cell. Each row represents a TF. Color bars on the left represent TF groups categorized according to dose sensitivity and reprogramming capacity. g, Scatterplot showing the overall transcriptomic change of one representative TF of each TF category across TF dose. The lines represent the fitted logistic regression (Extended Data Fig. 4).
To better capture the TF dose–response relationships, we modeled the transcriptomic change in function of TF dose using a logistic model (Supplementary Note 9). Leveraging the model parameters, we defined TF reprogramming capacity and dose sensitivity, and broadly classified TFs into the following three major groups (Fig. 3f,g, Supplementary Table 4 and Supplementary Note 9): (1) 32 high-capacity and high-dose-sensitive TFs, including HOX and CDX TFs; (2) 44 high-capacity and low-dose-sensitive TFs, such as POU5F1, that required a high dose to reach high capacity and (3) 158 low-capacity TFs like VDR that induced no to only very mild transcriptomic effects across a wide dose range.
To explore the functional relevance of TF reprogramming capacity, we analyzed mutational constraint data, including the probability of loss-of-function intolerance and loss-of-function observed/expected upper bound fraction, from gnomAD48,49 for human orthologs (Supplementary Note 10). We found that high-capacity TFs are substantially enriched among genes intolerant to loss-of-function mutations (Supplementary Table 5), suggesting a more substantial impact on cellular and ultimately organismal phenotypes compared to low-capacity ones48,50. Enrichment analysis on TF classes showed that zinc-finger TFs were under-represented and homeodomain TFs over-represented among high-capacity TFs (Supplementary Table 5; Methods). Moreover, protein feature analysis revealed that high-capacity TFs are enriched for small amino acids like proline and serine, low sequence complexity and β turns that represent energetically favored nucleation points51, while being depleted in aliphatic amino acids (including leucine and isoleucine), hydrophobic amino acids, negative charge and α helices (Fig. 4, Extended Data Fig. 4d and Supplementary Table 6; Methods). Similar compositional biases have been revealed as evolutionarily conserved patterns associated with phase-separating proteins, including specific TFs and coregulators whose condensate formation ability is thought to have a key role in gene regulation52,53,54.
Fig. 4: Features of high-capacity TFs.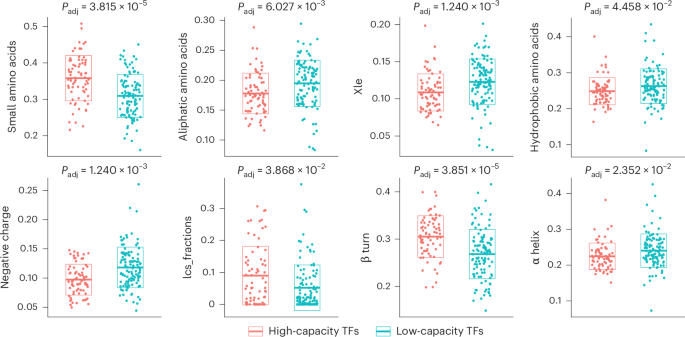
Scatterplots showing the distribution of various TF features (small amino acids, aliphatic amino acids, Xle, hydrophobic amino acids, negative charge, lcs, β turn, α helix) across high-capacity and low-capacity TFs. Crossbars and boxes represent the mean ± s.d. See Supplementary Table 5 and Methods for statistics and exact P values (Extended Data Fig. 4). Small amino acids, fraction of small amino acids; aliphatic amino acids, fraction of aliphatic amino acids; Xle, fraction of leucine and isoleucine; hydrophobic amino acids, fraction of hydrophobic amino acids; negative charge, fraction of negatively charged amino acids; lcs, low sequence complexity scores; β turn, fraction of β turns; α helix, fraction of α helices.
While the wide dose range is a key feature of scTF-seq, some TFs may still not reach high enough doses for accurate capacity assessment. A power analysis revealed that the predicted probability of correctly classifying TFs (at the maximum dose >3.5) as having low capacity was 77% (Extended Data Fig. 4e–g; Methods). This indicates that the dose levels reached in this study are sufficient to accurately resolve the regulatory capacity for most TFs (198 of 234) in MSCs.
Reprogramming heterogeneity is driven by dose and stochasticity
TF dose strongly contributes to reprogramming heterogeneity; however, overall transcriptomic changes lack directionality and gene-specific resolution (Fig. 3a). Therefore, we also investigated whether individual genes or gene sets respond consistently or variably to TF dose, thereby facilitating the emergence of different forms of reprogramming heterogeneity. We identified TFs inducing heterogeneous responses by systematic clustering (Extended Data Fig. 5a–c; Methods). Focusing first on lineage-driving TFs, heterogeneous cell states within a single lineage could be explained by monotonic effects of TF dose on early and late differentiation genes. For example, the adipogenic gene expression signature (termed adiposcore hereafter) of CEBPA cells strongly correlated with Cebpa dose (Fig. 5a). Early adipogenesis regulator Cebpd was down-regulated, whereas the master regulator of adipocyte differentiation Pparg and mature adipocyte markers like Fabp5 and C3 were upregulated with increasing Cebpa doses (Fig. 5b).
Fig. 5: Reprogramming heterogeneity induced by TFs.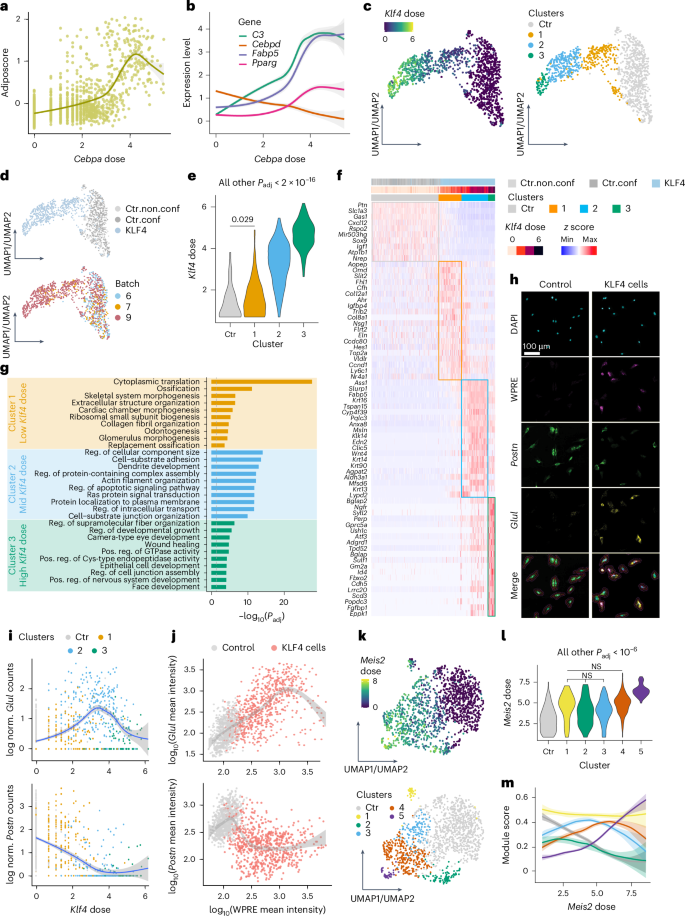
a,b, Adiposcore (a; Methods) and expression level of adipogenesis-related genes (b) in CEBPA cells at different doses and batch-paired control cells (dose = 0). c,d, KLF4 and batch-paired control cells colored by Klf4 dose (c, left), cluster (c, right), category (d, top) or batch (d, bottom). Fitted model = LOESS. e, Dose distribution of KLF4 cells in each cluster shown in c (right). f, Heatmap displaying log-normalized expression (z score scaled by gene) of the top differentially expressed genes of KLF4 clusters (shown in c (right) and d (top)). Colored outlines indicate marker genes for respective clusters from e. g, Top ten unique biological process terms identified by GO enrichment analysis on the substantially differentially expressed genes of each KLF4 cluster (shown in c (right)). h, RNAscope images showing DAPI, WPRE (proxy for TF dose), Postn and Glul expression in control and KLF4 cells. Representative images of two independent experiments. Red and purple outlines indicate the cell boundary and expanded cell boundary, respectively. Scale bar = 100 µm. i, Scatterplot showing the expression of Glul (top) or Postn (bottom) in KLF4 cells (colored by the clusters shown in c (right)) and batch-paired control cells in function of Klf4 dose. j, Single-cell quantification of RNAscope (as shown in h) showing the log-normalized mean fluorescence intensity of WPRE (proxy for TF dose) versus Glul or Postn in KLF4 and control cells. Fitted model = GAM. k, UMAP plots of MEIS2 and batch-paired control cells colored by Meis2 dose (top) or cluster (bottom). l, Violin plot showing the dose distribution of MEIS2 cells in each cluster shown in k. m, Dose–response curves for the scores of five distinct gene expression modules regulated by MEIS2. Each module represents the substantially differentially expressed genes from the individual MEIS2 clusters in k. The same color scheme used for the clusters in k is applied to the corresponding modules here. Fitted model = GAM. See Supplementary Table 5 and Methods for statistics and exact P values (Extended Data Figs. 5–7). Ctr, clusters containing fewer than 60% TF cells; GAM, generalized additive model; norm., normalized; pos. reg., positive regulation.
Beyond monotonic effects within one lineage, some TFs induced non-monotonic dose–response patterns across gene sets, driving distinct cell fate specifications and thus contributing to a more complex form of reprogramming heterogeneity. Using KLF4 as an example, three subclusters of KLF4 cells exhibited substantial differences in Klf4 doses and gene expression patterns (Fig. 5c–f). Low-dose KLF4 cells (cluster 1) uniquely expressed genes related to gene ontology (GO) terms such as ossification, skeletal system morphogenesis and cardiac chamber morphogenesis (Fig. 5f,g). Moderate Klf4 doses upregulated genes associated with regulation of cellular component size, protein-containing complex assembly and intracellular transport, while high Klf4 doses induced genes involved in regulating developmental growth, epithelial cell development and face development (Fig. 5f,g). These findings suggest that Klf4 dose variations direct cells toward different functional states, regulating differentiation, cellular organization and development, respectively. Similar patterns were observed for many other TFs, including RUNX2, ETV1, EGR1, GRHL2 and ESR2, and were reproducible across batches (Extended Data Figs. 5d–f and 6a–h). Using RNAscope, we probed the TF dose (using WPRE, a viral element in the TF-ID-containing mRNA, as a proxy; Methods) and marker genes that are specific to particular KLF4 or ESR2 subpopulations, and cross-validated their dose-dependent expression patterns (Methods). In line with the scTF-seq results, RNAscope quantification accurately captured the mutually exclusive expression of Glul and Postn in low versus intermediate/high KLF4 cells, as well as the non-monotonic dose responses of Gng12 and Aspn in ESR2 cells (Fig. 5h–j and Extended Data Fig. 6i–k).
While TF dose is a key factor influencing cell fate, we also identified TFs including MEIS2 and MYOG that reproducibly stratified cells into distinct states despite similar TF doses (Fig. 5k–m and Extended Data Figs. 5d and 7a–d). For Meis2, intermediate doses generated multiple cell states (Fig. 5k,l, clusters 1–4) with minimal differences in dose distribution and each characterized by the expression of unique gene modules (Fig. 5m and Extended Data Fig. 7e,f). In fact, MEIS2 cells that were conservatively enriched for modules 2 and 3 displayed opposing dose relationships across two batches, thereby obscuring any consistent dose-dependent trend in the aggregate data (Extended Data Fig. 7g–l) and suggesting the emergence of multiple alternative cell states at moderate Meis2 doses. At higher Meis2 doses, cells appeared to converge on a more homogeneous cell state (Fig. 5m and Extended Data Fig. 7f). Altogether, these findings indicate that, while TF dose is a critical determinant of cell fate, additional, possibly stochastic factors likely have important roles in regulating cell fate decisions.
Dissecting the impact of cell cycle on reprogramming
One factor that also contributes to transcriptomic heterogeneity, alongside TF dose, is the cell cycle, given its fundamental role in stem cell self-renewal and lineage determination27,55. To address our limited understanding of how the cell cycle interacts with TFs and their dose, and contributes to reprogramming heterogeneity, we leveraged our scTF-seq data to systematically study TF overexpression and cell cycle dynamics interactions. Cell cycle phase was inferred and adjusted for each cell, and the proportion of cells in each adjusted phase was compared across all TFs (Fig. 6a, Extended Data Fig. 2e and Supplementary Notes 7 and 11). As expected, known cell cycle-driving TFs such as E2F2 (ref. 56), T57 and MYCN58 substantially increased the proportion of S and G2/M cells (Fig. 6b). Beyond discrete phase classification, which overlooks the circular and continuous nature of the cell cycle, we examined the density distributions of cell cycle scores. One-dimensional distributions revealed that E2F2 overexpression primarily shifted cells toward high S scores, while T and MYCN increased both S and G2/M scores (Fig. 6c). Two-dimensional density estimation further clarified that E2F2 may not only drive entry into the S phase but also block cells from progressing to G2/M (Fig. 6c and Extended Data Fig. 8a–d). This aligned with previous findings showing that stabilized E2F2 activity throughout the cell cycle accelerates G1/S transition in the short term but initiates replication stress, DNA damage and apoptosis, thereby impairing long-term cell fitness59.
Fig. 6: Interactions between TFs, the cell cycle and differentiation (adipogenesis).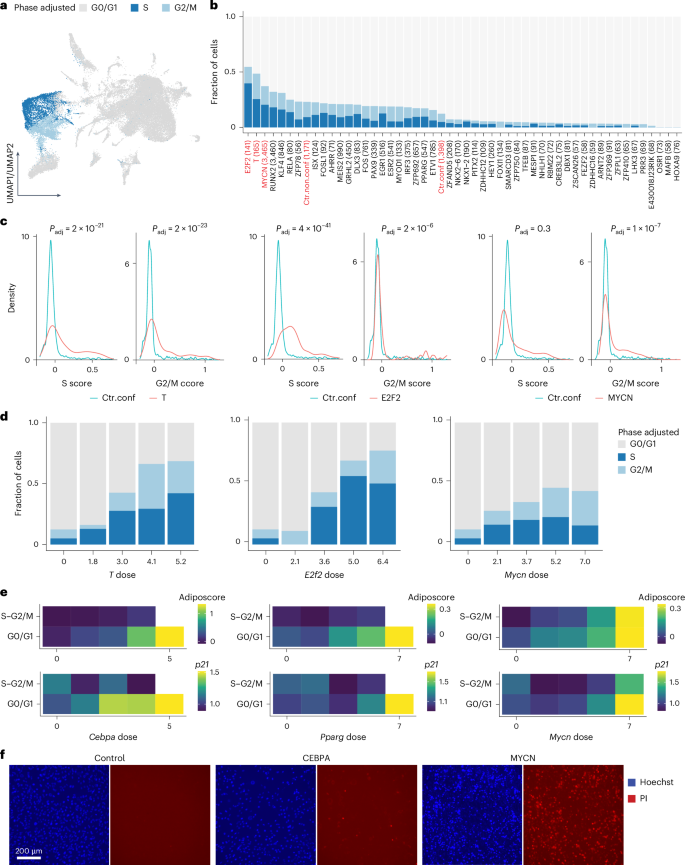
a, UMAP plot of the TF atlas colored by adjusted cell cycle phase (Supplementary Note 7). b, Bar plot showing the fraction of cells in the adjusted phase for each TF. The total number of cells is indicated in brackets. A Fisher’s exact test was performed between confluent control cells (Ctr.conf) and each TF. In addition to Ctr.conf, only TFs and the non-confluent control cells (Ctr.non.conf) that tested significantly (FDR-adjusted P < 0.05) are visualized here. The top three TFs and controls are highlighted in red. c, Density plots showing the distributions of S and G2/M scores of TF cells (T, E2F2 or MYCN in red) compared to confluent control cells (Ctr.conf in teal). d, Bar plots showing the fraction of cells in each adjusted cell cycle phase across binned doses of T, E2f2 or Mycn. e, Heatmaps showing the transcriptomic adiposcore and the mean expression level of p21 in CEBPA, PPARG and MYCN cells, which are binned according to their adjusted cell cycle phase and TF dose. Bins with less than three cells were excluded (white square). f, Fluorescence images showing the viability of control, CEBPA and MYCN cells, indicated by PI staining in red (Supplementary Note 12). Nuclei were stained with Hoechst in blue. Representative images of two independent experiments. Scale bar = 200 μm. See Supplementary Table 5 and Methods for statistics and exact P values (Extended Data Fig. 8). PI, propidium iodide.
Interestingly, the proportion of S and G2/M cells generally increased with rising T and E2f2 doses (Fig. 6d). However, TFs such as MYCN, RUNX2 and PAX9 exhibited a non-monotonic relation between dose and cell cycle, with the largest fraction of S and G2/M cells observed at intermediate doses (Fig. 6d and Extended Data Fig. 8e). This prompted us to explore how TFs dose-dependently coordinate cell cycle dynamics and lineage differentiation, revealing, for example, for adipogenesis that cell proliferation and the adiposcore were mutually exclusive in CEBPA or PPARG cells (Fig. 6e). This aligns with the established notion that lineage differentiation, including adipogenesis, requires cell cycle exit27,55,60. Indeed, p21, encoding a cyclin-dependent kinase inhibitor critical for harmonizing cell cycle exit and adipocyte differentiation60, was upregulated at high Cebpa or Pparg doses (Fig. 6e). In contrast, cell cycle exit and cell differentiation were decoupled in high Mycn cells, as evidenced by the concurrent high adiposcore and p21 expression in S and G2/M, and the observed accumulation of lipid droplets alongside increasing nuclei counts (Figs. 2e and 6e and Extended Data Fig. 3f). However, this aberrant differentiation under high Mycn doses was accompanied by evident cell death (Fig. 6f). These findings collectively underscore the intricate interplay among TFs, TF dose, cell cycle dynamics and lineage differentiation.
Dose influences TF combination synergy or antagony
TFs do not operate in isolation and their effects depend on the relative dose61,62. Yet, how one TF’s dose influences the effects of another TF is poorly understood due to the complexity underlying combinatorial analysis. To explore this, we selected TFs with strong lineage-driving potential, including CEBPA, PPARG and MYCN for adipogenesis, MYOG for myogenesis and RUNX2 for osteogenesis, and performed combinatorial scTF-seq experiments (Fig. 7a; Methods).
Fig. 7: Dose-dependent effects of interactions between TFs.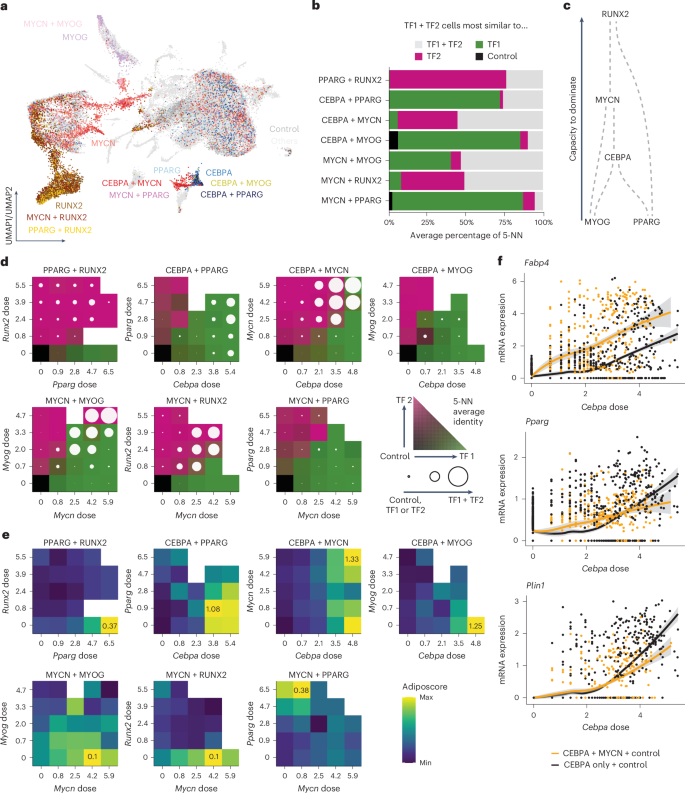
a, UMAP plot showing the positions of single and combinations of TFs with respect to all other tested TFs and control cells. b, Percentage of five nearest neighbors to which each combinatorial TF (TF1 + TF2) cell is closest. c, Schematic representation of the dominance of each TF inferred from b. For example, RUNX2 dominates other TFs because combining RUNX2 with another TF results in transcriptomes that closely resemble those of RUNX2-only cells. d, Percentage of five nearest neighbors to which each combination cell is closest within a pair of dose bins. Bins were determined by uniformly splitting the interval between 0 and the maximum dosage, with an additional bin at a dose of 0. The color scale represents the percentage of cells closest to TF1, TF2 or the control cells, respectively, represented using a bilinear interpolation between green, pink and gray. The circle represents the percentage of cells closest to the TF1 + TF2 cells, with a full circle meaning that all cells were closest to TF1 + TF2. e, Transcriptomic adiposcore between different dose bins. The color scale ranges from the maximal to the minimal adiposcore for each combination of TFs. The value of the maximal adiposcore is indicated in the corresponding bin for each combination. f, Dose–response curves for control cells with only CEBPA cells (black) or with MYCN + CEBPA cells (orange). Fitted model = LOESS (Extended Data Fig. 9). NN, nearest neighbors.
Using single-cell readouts, we evaluated whether TF pairs induced distinct cell states compared to those induced by either TF alone (Methods). Typically, one TF dominated the transcriptomic outcome, forming a directed network of TF dominance (Fig. 7b,c). Yet, pairs such as CEBPA + MYCN, MYCN+MYOG and MYCN + RUNX2 produced unique states not explainable as simple combinations of individual TF effects, marked by distinct gene expression profiles (Fig. 7b and Extended Data Fig. 9a). For instance, CEBPA + MYCN uniquely upregulated adipogenesis-related genes (Fabp4 and Gpd1l), suggesting a synergistic interaction (Extended Data Fig. 9a). Interestingly, adipogenic TFs paired with either adipogenic or lineage-diverting partners had synergistic or antagonistic effects, respectively, on adipogenic capacity (Extended Data Fig. 9b). These findings were substantiated by the respectively higher or lower lipid score for MYCN + CEBPA or MYOG + CEBPA compared to CEBPA cells (Extended Data Fig. 9c,d).
We then investigated how TF dose shapes combinatorial effects. For overall cell identity, we found that any TF with much greater doses than another was able to overcome the dominant effect, except for PPARG, possibly due to its low dose sensitivity (Fig. 7d, Extended Data Fig. 9e and Supplementary Table 4). Unique combinatorial states often required high doses (Fig. 7d). Additionally, TF dose sensitivity could shift in competitive contexts. For example, MYOG was highly dose sensitive alone, whereas it was mostly dominated by other less dose-sensitive TFs at low doses (Fig. 7d, Extended Data Fig. 9e and Supplementary Table 4). MYCN, despite lower dose sensitivity than CEBPA, dominated over CEBPA when they were at similar doses (Fig. 7d, Extended Data Fig. 9e and Supplementary Table 4). TF combinations also exhibited dose-dependent effects on adipogenic capacity, with some interactions being non-monotonic (Fig. 7e). For instance, CEBPA + MYCN synergized globally, yet MYCN at intermediate levels antagonized adipogenesis in high Cebpa cells (Fig. 7e and Extended Data Fig. 9b). Conversely, the highest adipogenic capacity of the CEBPA + PPARG combination was observed at a low Pparg dose, a surprising finding given PPARG’s role as a master regulator of adipogenesis (Fig. 7e)45. Finally, we observed that dose-dependent synergism can be gene-specific. CEBPA + MYCN synergistically activated adipocyte markers (Fabp4, Adipoq), while other adipogenesis-related genes (Pparg, Plin1) switched between synergy and antagonism depending on Cebpa dose (Fig. 7f and Extended Data Fig. 9f). These nonlinear and gene-specific interactions reflect the complexity of regulatory architectures, necessitating TF dose-resolved approaches for deeper insight.