
We have developed a method for producing gene-specific z-score centile charts and growth charts based on small datasets in rare diseases. The resulting charts are unbiased due to the way they are constructed; cosmetically, they look plausible; they agree with other published literature, and the centiles almost always exactly match the baseline reference when given random z-scores, i.e., the specificity is as high as 97%.
Sample size
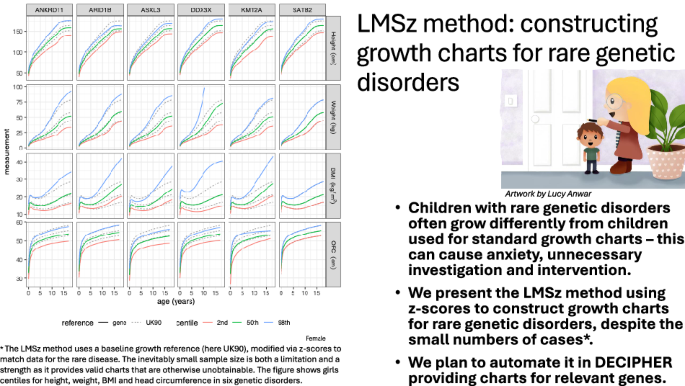
Growth charts typically require many thousands of data points to ensure adequate precision for the outer centiles [10]. This does not work for the small samples available in rare disease cohorts. The LMSz method instead considers the universe of all possible simple models, such as all combinations of sex and linear age for the mean and SD, and selects the best model, penalised for complexity. This works because the universe of all possible linear models is small, between 30 and 45 alternative models, and the model selection does not depend on the statistical significance of the regression coefficients.
Fitting of centiles
Due to the larger penalty per extra coefficient, the BIC models ought to be simpler than the AIC models, and indeed they are—the BIC models underlying the 24 facets in Fig. 1 involve 53 coefficients, i.e., ~2 coefficients per facet. In contrast, the corresponding AIC models in Supplementary Fig. 2 involve 74 coefficients, averaging over 3 per facet. Despite this, the centiles in Fig. 1 and Supplementary Fig. 2 are not materially different, probably because the coefficients are all small. The specificity calculation showed that the AIC models had only 53% specificity, compared to 97% for the BIC models, for selecting the correct null model when the data were random Normal. This shows that the AIC tends to choose over-complex models, which in turn supports the use of the BIC models. Note that the sensitivity of the method cannot be tested in the same way as the specificity. It involves knowing in advance the centiles appropriate for the particular genotype, which are by definition unknown.
Z-scores versus growth centiles
The z-score centile plots show clearly the differences in growth pattern for a particular gene compared to UK90. The z-score plots compactly show growth trends over time, and sex differences where present. However, in clinical practice, health professionals measure and plot their patients’ growth on centile charts as part of standard clinical care. For this reason, it is important to provide the back-transformed centile charts for each gene, see Figs. 2 and 3, as clinicians will find them more familiar in measurement units.
Comparison with the literature and published charts
There is a published centile chart for Coffin-Siris Syndrome (CSS; OMIM #135900), caused by variants in BAF complex genes [4]. Direct comparison with ARID1B is not possible given the greater genetic heterogeneity and differing endpoints (height to age 10; OFC to 36 months). In fact, we did not see a sex difference for weight, but the 50th centile for height at age 10, and weight and OFC were consistent.
We were able to analyse the MWS dataset in two ways: LMSz as described here and the conventional LMS method applied to the raw data. The two sets of centiles are reasonably similar, though the z-score-based centiles look more convincing for height and weight, particularly at older ages. For BMI, the 2nd and 50th centiles agree well, but the 98th centiles are more discordant. This is probably because the z-score conversion applies the UK90 skewness adjustment to the MWS data, but the degree of skewness in the MWS data is different from UK90. With right skewness, this would tend to affect the upper rather than the lower centiles of the distribution, as seen here.
MWS centiles have already been published by the MWS Consortium [3], but superficially they look different from the centiles in Fig. 4. This may be because we excluded different outliers and fitted a different model–see Supplement 1 for our gamlss code.
Clinically, the dashed curves are more reliable, particularly at older ages, because the LMSz method preserves the expected pattern of growth (e.g., plateauing after puberty), even when data are sparse, by anchoring to the external reference. In contrast, the LMS method applied directly to raw data can overfit and artificially extend growth trends, as seen where the LMS centiles continue to rise post-puberty despite growth having ended.
There are no published growth charts for ANKRD11, KMT2A, DDX3X or ASXL3. Variants in ANKRD11 cause KBG Syndrome (MIM # 148050) [14]. Our growth charts are consistent with the published phenotypes. Growth hormone has been trialled as a therapeutic option for a small number of individuals with short stature [15]. These growth charts will be an essential tool in monitoring children, both in determining the need for potential treatment and judging its success.
We selected DDX3X syndrome (MIM #300160), a neurodevelopmental disorder predominantly in females [16], to investigate how our charts would work for a very rare gene, where \(n=5\) for the males. Our charts agree with the literature of fairly normal heights and weights in females, with a proportion having borderline microcephaly. The phenotype in boys is less well understood, as the data are limited. Nonetheless, our method enables some form of chart to be produced. Considered with caution, this could still provide a useful adjunct in a clinical setting, particularly if the data points are viewable in the chart to alert the clinician to the small sample size on which the chart is based.
Alterations in KMT2A cause Wiedemann–Steiner Syndrome (WSS) (MIM # 605130) [17]. WSS is associated with short stature in about 60% of individuals, microcephaly in a third, and weight below the 5th centile in a third. Our charts are concordant with published descriptions depicting median height, weight, and OFC for KMT2A at the reference 2nd, 2nd and 25th centiles, respectively.
ASXL3-related disorder (Bainbridge–Ropers Syndrome, MIM # 615485) is associated with normal birth weight but poor postnatal growth due to feeding issues in infancy, which stabilise following feeding intervention [18,19,20]. BMI rises with age, which may be explained by sustained feeding intervention or because of dysregulated or impulsive eating behaviours that can develop later in childhood. Feeding interventions should not target reference height (ASXL3 median height = 12th centile), and our charts will be important for growth monitoring. Median OFC is on the 3rd centile, consistent with the published literature of postnatal microcephaly.
Pre- and postnatal growth restriction, sometimes with microcephaly, can be found in up to 34% of individuals with variants in SATB2 [21, 22] (MIM # 608148). Growth charts were produced recently (1508 data points), but they are hard to compare with ours as they included single variants together with chromosomal microdeletions, and they stopped at age 10 [5]. They presented z-score heatmaps, which indicate that the microdeletion group was most affected by growth restriction, and this probably explains the difference compared to our charts.
Limitations
Most individuals were likely Caucasian, although ethnicity was not formally recorded. Data were collated from various sources, and some outliers may be due to measurement error, though we sought out extreme measurements and either corrected or excluded them. Fewer OFC measurements were available, and birth OFC measurements were frequently missing. UK90 was used as the baseline reference for three reasons: most of the data were from the UK (except for the European ANKRD11 and MWS and International ASXL3 cohorts), UK90 is the official UK growth reference for data at birth and over 4 years of age [23], and the DECIPHER database uses UK90 to display the growth data. However, there are inter-country differences in height for any child – see Supplement 2 – and this is true for neurodevelopmental disorders, as shown with ANKRD11 – clinical interpretation needs to take this into account.
The LMSz method converts raw data to z-scores using the baseline reference and then models the z-scores. It assumes that any skewness in the raw data matches the skewness in the reference, and this may not be the case. If the two skewness patterns differ, it will introduce bias, as seen in Fig. 4B for BMI, where the 98th centiles based on the LMS and LMSz methods are very different, particularly in males. BMI is markedly right-skewed at older ages (i.e., the L-value is large and negative), which affects the 98th centile more than the 2nd and 50th centiles.
Another limitation is that for conditions that attenuate the pubertal growth spurt, such as achondroplasia [24] and hypochondroplasia [25], the LMSz method will generate rare disease centiles with a spurious pubertal spurt. Clinicians managing such conditions need to bear this in mind.
Strengths
The LMSz method appears to provide appropriate growth charts for rare genetic conditions where there are, by definition, only small numbers of cases. It is flexible and automatable, which allows rare disease data to be accumulated over time and the charts to be continually updated.
The method relies on a baseline growth reference from which to borrow strength, and here the baseline is the British 1990 or UK90 reference, which was modelled using the GAMLSS BCCG distribution [6, 9]. However, it should be pointed out that the LMSz method will work with any GAMLSS model that can convert measurements to z-scores, including other popular distributions such as the Box-Cox t (BCT), Box-Cox Power Exponential (BCPE) [26] or generalised gamma (GG) [27]. In addition, it will work with any baseline growth reference, not just UK90, and researchers in other countries may prefer to use their own national references where appropriate.
Implementation
We plan to automate LMSz within the DECIPHER platform [28, 29] using its open-access datasets alongside further growth measurements being collated through the GenROC study [8]. Gene-specific growth charts will be viewable within DECIPHER. A future development would be to vary subtype-specific charts within our proposed pipeline.