
Cohort characteristics and model risk score distribution
The study cohort comprised 92,493 patients enrolled in the DT Biobank as of May 1st, 2021 (demographics detailed in Table 1). After excluding 65 patients with pre-existing NS diagnoses, the remaining 92,428 patients were analyzed using their complete de-identified diagnosis description text. The dataset contained 14,969,183 diagnostic entries, including documented symptoms, clinical findings, phenotypic features, and disease diagnoses, with a mean of 162 entries per patient. These comprehensive diagnostic records served as input for the predictive DCNN model.
Table 1 Demographics of the study cohort
The model generated NS risk scores for all patients, with a mean score of 0.004 (distribution shown in Fig. 1A). The majority of patients received very low risk scores, with 171 patients (0.19%) exceeding our predetermined high-risk threshold of 0.8 (indicated by the red dashed line in Fig. 1A). This distribution aligns with the expected rarity of NS in this population and suggests that the model maintains appropriate specificity in real-world applications.
Fig. 1: Distribution and precision analysis of predicted NS risk scores.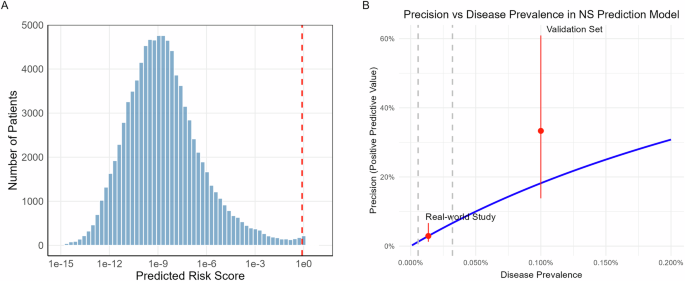
A Distribution of predicted NS risk scores across 92,428 patients plotted on a log10 scale. The red dashed line indicates the high-risk threshold (0.8). The strongly right-skewed distribution reflects the model’s high specificity, with 171 patients (0.19%) classified as high-risk. B Relationship between model precision and disease prevalence. The blue line shows the theoretical relationship at fixed sensitivity (40%) and specificity (99.82%). Red dots with error bars indicate observed precision in this real-world study (lower) and previous validation set (upper). Gray dashed lines mark the 95% confidence interval of the estimated disease prevalence in the current study cohort. Figure generated with R ggplot2.
To examine associations between demographic factors and risk prediction, we performed a linear regression analysis using log10-transformed risk scores as the dependent variable, with demographic factors plus diagnostic entry count as covariates. The regression model explained 7.6% of total score variance and revealed several significant associations, including lower scores in females compared to males, lower scores in Black patients compared to White patients, and negative correlation between score and age (Supplementary Table 2). The relationship between the score and the number of diagnostic entries was significant but non-linear: the score decreased with entry count up to 200 before showing an increasing trend. These relationships are visualized in Supplementary Fig. 1. Notably, none of these associations were observed within the high-risk group (score >0.8).
Chart review and genetic testing cohort selection
Manual chart review of the 171 high-risk patients was conducted in February 2022 by a clinical geneticist (KNW) and genetic counselor (AS) to identify and exclude those with existing genetic diagnoses prior to subsequent genetic sequencing.
The review identified 86 patients with prior genetic diagnoses, with Alagille syndrome (n = 15) and Williams syndrome (n = 13) being the most prevalent among 10 recurrent conditions (Supplementary Table 3). Notably, three patients received NS diagnoses after the initial EHR data extraction (May 2021), demonstrating the model’s predictive capability:
Patient A: Diagnosed May 2021, pathogenic heterozygous PTPN11 variant NM_002834.5(PTPN11):c.922 A > G (p.Asn308Asp). This variant is classified as Pathogenic by FDA expert panel in ClinVar.
Patient B: Diagnosed September 2021, pathogenic heterozygous PTPN11 variant NM_002834.5(PTPN11):c.854 T > C (p.Phe285Ser). This variant has been reported in multiple patients with NS and is classified as Pathogenic in ClinVar.
Patient C: Presented with characteristic NS features including short stature, intellectual disability, suggestive facial dysmorphology, mitral valve dysplasia/regurgitation, and impaired ventricular relaxation. Comprehensive genetic analysis revealed compound heterozygous pathogenic variants in LZTR1 confirmed to be in trans by phasing analysis:
NM_006767.4(LZTR1):c.263 G > T (p.Gly88Val). Classified as VUS in ClinVar and reclassified as Pathogenic based on ACMG criteria PVS1 (splice disruption), PM3 (in trans with pathogenic variant) and PM2 (population frequency)9.
NM_006767.4(LZTR1):c.1943-256 C > T. Classified as Pathogenic by ClinGen RASopathy VCEP. This intronic variant disrupts normal splicing, causing frameshift and premature termination.
The remaining 85 patients without identified prior genetic diagnoses proceeded to genetic evaluation through three pathways: two patients had previous clinical exome sequencing data available (with negative clinical genetic reports), 25 patients with isolated pulmonary stenosis qualified for whole genome sequencing through the GMKF Pulmonary Stenosis study, and 58 patients underwent whole exome sequencing.
Genetic sequencing results and case confirmation
Of the 85 patients selected for genetic testing, sequencing was successfully completed for 83 samples (2 clinical exome sequencing, 24 WGS, and 57 WES). Two samples failed sequencing due to inadequate DNA quality or quantity. All successfully sequenced samples met quality control criteria for DNA contamination, sequencing coverage, and sex concordance.
Filtered variants in candidate genes across all 83 samples were reviewed by the clinical geneticist, including 53 rare missense variants and 14 rare nonsense, frameshift, or deletion variants. This analysis confirmed two additional NS cases:
Patient D: Presented with short stature, VACTERL association, and Tetralogy of Fallot, with documented genetics consultations including a newborn evaluation in 2012. Sequencing revealed a heterozygous PTPN11 variant NM_002834.5(PTPN11):c.1529 A > G (p.Gln510Arg), classified as Pathogenic/Likely Pathogenic in ClinVar and through ACMG criteria (PM5, PP3, PM1, PM2, PP5).
Patient E: Presented with short stature, delayed bone age, and café au lait spots. Initially suspected of having NF1 at 4 months of age (without genetic confirmation), our sequencing identified a heterozygous in-frame deletion in NF1 (NC_000017.11(NM_000267.3):c.3285_3294del). This variant, classified as Likely Pathogenic (PM2, PP1, PP4), was independently confirmed by clinical testing in April 2022. This case was included as a true positive due to NF1’s inclusion in RASopathy panels and significant phenotypic overlap with NS10,11.
Additionally, phenotype-guided variant analysis identified three non-NS genetic diagnoses explaining clinical features. These findings included pathogenic variants in genes associated with other developmental disorders and congenital heart defects (detailed in Supplementary Table 4). Notably, we identified one patient with a pathogenic variant in ADNP, the gene associated with Helsmoortel-van der Aa syndrome (OMIM:615873), which was recently reported to exhibit phenotypic overlap with RASopathies12. The identification of these alternative diagnoses underscores the phenotypic overlap between NS and other genetic conditions, emphasizing the importance of comprehensive genetic evaluation in patients with complex clinical features.
In total, this validation study identified five previously undiagnosed NS cases: three confirmed through chart review and two by genetic sequencing. Detailed clinical and molecular characteristics of all five cases are summarized in Table 2.
Table 2 Summary of confirmed NS casesModel performance and cohort prevalence analysis
Genetic sequencing validation identified 2 NS cases among 83 patients, yielding a precision of 2.41% (95% CI: 0.66%–8.37%). Including the three NS cases identified during the study period, a total of 5 NS cases were confirmed among 171 high-risk patients, yielding an overall precision of 2.92% (95% CI: 1.26%–6.66%). This real-world precision was notably lower than the 33.3% (95% CI: 13.8%–60.9%) achieved during the previous pseudo-prospective evaluation.
Despite the lower precision, the model maintained consistent specificity. With 166 false positives and n undiagnosed NS cases, specificity is (92,428 – 166 – n) / (92,428 – n), which approximates to 99.82%, given that n is very small relative to the cohort size. This result aligns closely with the 99.92% specificity (95% CI: 99.84% –99.96%) observed in our previous evaluation, conducted at a slightly higher risk score threshold (0.84 versus 0.8 in this study). Given that data sources and processing methods remained identical between studies, the marked decrease in precision can be primarily attributed to differences in disease prevalence, following the established relationship13:
Figure 1B illustrates this relationship between precision and disease prevalence, assuming fixed sensitivity (40%) and specificity (99.82%). Based on our observed precision, the estimated disease prevalence in this real-world cohort is one case per 7379 individuals, equating to 12.5 undiagnosed NS cases in this study cohort of 92428. This prevalence is significantly lower than the one case per 1000 individuals used in our previous evaluation set. The calculated prevalence aligns with the expectations, as the DT Biobank likely contains fewer undiagnosed NS cases compared to diagnosed cases. When combining the estimated undiagnosed cases with the 65 known NS cases, the overall NS prevalence across all 92493 patients in the DT Biobank is one case per 1193 individuals.
Phenotypic analysis of high-risk patients
We conducted phenotype enrichment analysis using HPO terms to characterize the clinical phenotypes of model-identified high-risk patients. Comparing the 171 high-risk patients against the background population (n = 92,428), we identified significantly enriched phenotypes primarily associated with cardiac abnormalities, including pulmonic stenosis, cardiomegaly, atrial septal defect, as well as systemic manifestations such as failure to thrive, short stature, and feeding difficulties (detailed in Supplementary Table 5). When compared with the enriched phenotypes observed in the 65 previously diagnosed NS patients (Supplementary Table 6), the enriched phenotypes in the high-risk patients largely mirrored those observed in the NS patients (Fig. 2A). The majority of these NS phenotypes demonstrated stronger or similar enrichment in these high-risk patients (except Ptosis), supporting the model’s ability to identify clinically relevant features of NS.
Fig. 2: Phenotypic comparison and longitudinal trajectories of NS risk scores.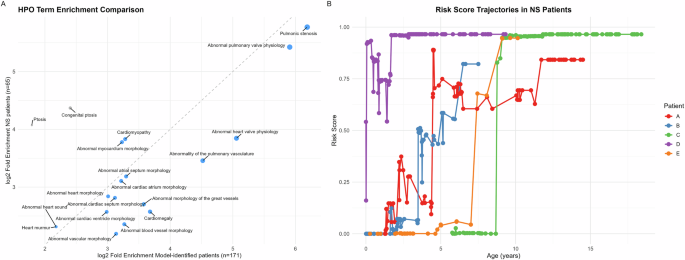
A Comparison of HPO term enrichment between model-identified high-risk patients (n = 171) and known NS patients in DT(n = 65). The x-axis shows log2 fold enrichment in model-identified patients, while the y-axis shows that in known NS patients. For simplicity, only enriched HPO terms in NS patients (adjusted p < 0.01) at depths 4 to 6 in the ontology are included. Each point represents an HPO term. The diagonal dashed line indicates equal enrichment in both groups. Detailed enrichment analysis results are in Supplementary Table 5 and 6. B Longitudinal analysis of NS risk scores for five confirmed cases. Risk scores were calculated using cumulative diagnosis texts at each age point. Each patient’s trajectory (color-coded) shows distinct patterns of progression to high-risk status (>0.8). While some patients (C, E) demonstrated rapid transitions, others (A, B, D) showed more gradual progression with fluctuations. Figure generated with R ggplot2.
Comparative analyses within the high-risk group revealed subtle phenotypic patterns. The five confirmed NS cases showed potential enrichment of connective tissue phenotypes, particularly flexion contracture, though these associations did not remain significant after multiple hypothesis testing corrections (Supplementary Table 7). Demographic analysis found no significant differences in race, gender, or age between these five NS cases and other high-risk patients (Supplementary Table 8). While the 166 false positive cases showed no significantly enriched phenotypes compared to the overall high-risk group, analysis of specific genetic diagnoses revealed characteristic signatures: Alagille syndrome patients (n = 15) showed significant enrichment of splenic and hepatic abnormalities (Supplementary Table 9), while Williams syndrome patients (n = 13) demonstrated distinctive features including supravalvular aortic stenosis and oral cavity abnormalities (Supplementary Table 10).
Risk score trajectories of the confirmed NS patients
We conducted a longitudinal analysis of risk scores for the five confirmed NS patients by applying the predictive model to cumulative diagnosis texts for successive age points until the final EHR data extraction. While all patients converged to high-risk scores at their final assessment point, their trajectories varied considerably (Fig. 2B). Some patients (Patients C and E) exhibited rapid transitions from low to high scores, while others (Patients A, B, and D) demonstrated more gradual progression with notable fluctuations. Importantly, these trajectories revealed potential opportunities for earlier identification, as the majority of patients showed elevated risk scores years before their final model assessment.
Score increases typically corresponded to the documentation of NS-related phenotypes in the EHR, however, some fluctuations were less intuitive. For example, for Patient A, the documentation of “Congenital pulmonary valve stenosis” at age 4.39 years led to a marked increase in risk score, while the subsequent addition of “Personal history of surgery to heart and great vessels, presenting hazards to health” at age 4.58 years unexpectedly led to a decrease in the score.