
Participant recruitment
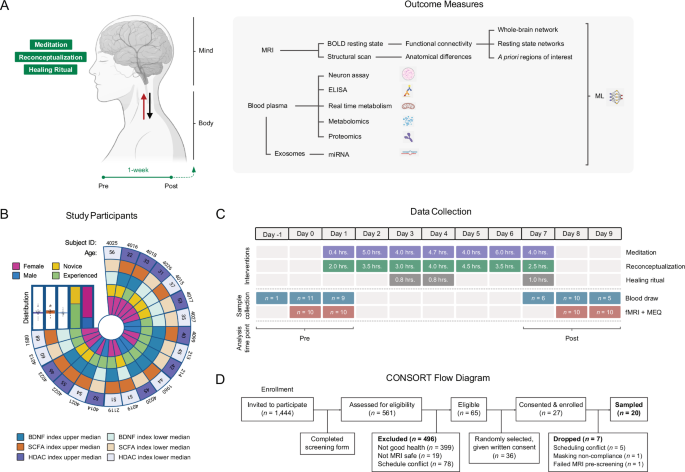
The study was advertised to all 1444 registered retreat attendees via email invitation, of which 561 expressed interest by answering an online questionnaire to determine eligibility (Fig. 1D). Inclusion criteria included being an English speaker; being at least 21 years of age; being in good general health; being able to provide blood samples before, during, and after the retreat; and agreeing to undergo fMRI neuroimaging before and after the retreat. Exclusion criteria included inability to consent, inability to follow or comply with study procedures, current use of psychoactive medications, contraindications for phlebotomy, and contraindications for MRI (pregnancy, history of seizures, electronic or ferromagnetic medical implants or devices, claustrophobia). Of 65 eligible participants, 36 were randomly selected to participate and provided written informed consent. Of 27 who consented, five were dropped due to scheduling conflicts; one participant was dropped for not complying with MRI facility masking requirements; and one participant failed MRI screening due to a heart stent. The study size was determined by the scanning time available at the fMRI facility (1 MRI scanner for 2 days pre- and post-intervention). Our study included male (n = 6) and female (n = 14) participants (gender identity), and similar findings are reported for both genders. Of the 6 male participants, 2 had been practicing the meditations carried out in the workshop daily for more than 1 year, 3 had been practicing the meditations daily for less than 1 year (one of whom practiced a different form of meditation), and 1 participant had not previously practiced the meditations before attending the retreat, though he had a different meditation practice. Of the 14 female participants, 8 had been practicing the retreat meditations for over 1 year (most being a daily practice), and 1 of the 8 also practiced a different form of meditation. Six of the 8 females had been practicing the meditations for less than 1 year, with only 3 reporting an almost daily practice, and 4 of the 8 reported having a different meditation practice. One of the 8 females had not previously practiced the meditations before attending the retreat, though she had a different meditation practice. The retreat began at 5 pm on Day 1 and ended at 1:30 pm on Day 7 and was conducted in April 2022 at the Manchester Grand Hyatt (San Diego, CA, USA). The diet was provided by the hotel. There were no adverse events.
The study was conducted in accordance with the Declaration of Helsinki principles and all relevant ethical regulations. Experimental protocols were approved by the Western Institutional Review Board (WIRB; now WCG-IRB; Protocol MED02#20211477) and registered on clinicaltrials.gov (NCT 06615531). Written informed consent was obtained from all participants prior to study inclusion, and clinical records are housed at VitaMed Research (Palm Desert, CA) as mandated by federal laws. All ethical regulations relevant to human research participants were followed.
Functional magnetic resonance imaging (fMRI)Acquisition
fMRI was performed off-site at the UCSD Center for Functional MRI pre-intervention (Day 0: 8 am–8 pm and Day 1: 8 am–4 pm) and post-intervention (Days 8 and 9: 8 am–6 pm). Participants were positioned in the MRI scanner (Siemens Prisma 3T with standard 32-channel head coil) with a respiratory transducer placed around the chest, a pulse oximeter placed on the left index finger, and MRI-safe headphones. A structural scan, two functional blood oxygen level dependent (BOLD) scans (resting state and meditation), and a diffusion tensor imaging (DTI) scan (not described here) were acquired.
Structural scan
Participants were instructed to “not move and keep eyes closed.” High resolution structural images were acquired with a T1-weighted magnetization-prepared rapid gradient-echo (MPRAGE) sequence with TR = 2400 ms, TE = 2.22 ms, TI = 1000 ms, flip angle = 8°, FOV = 224 mm, voxel size = 0.7 mm isotropic, 320 slices, slice thickness 0.80 mm, saggital orientation, bandwidth = 210 Hz/Px, and acquisition time = 7 min. 40 s.
Functional scans
During the 5-min BOLD resting state scan, participants were instructed to “not move, keep eyes open, stay awake, and think about whatever you want, but do not meditate.” During the subsequent 15-min BOLD meditation scan, an auditory recording of a guided meditation from the retreat was played and participants were instructed to “not move, listen to the guided meditation soundtrack, and meditate as suggested by the audio while keeping your eyes open.” An eyes open paradigm was chosen to reduce the risk of drowsiness or sleep during the meditation run, which was deemed a potentially greater risk than the presence of visual confounds to accurately comparing active meditation with passive rest66,67. One rest and one meditation run were collected per scan. The audio consisted of continuous expansive atmospheric music with an intermittent ethereal voice repeatedly instructing listeners to “tune into nothingness”, “no time”, “nowhere”, and “love”, combining loving-kindness meditation with focused awareness of the experiencing self and its potential dissolution into pure awareness. BOLD images were obtained with a gradient-recalled echo-planar imaging (EPI) sequence with TR = 800 ms, TE = 37 ms, flip angle = 52°, FOV = 208 mm, voxel size = 2 mm isotropic, 2 mm slice thickness, 72 slices, number of volumes = 1200, matrix size = 104 × 90, bandwidth = 2290 Hz/Px, and acquisition time = 5 min. (rest) and 15 min. (meditation).
Post-scan questionnaire
Immediately after each scanning session, participants were asked to assess their experience meditating by completing the Mystical Experience Questionnaire (MEQ-30)68.
fMRI preprocessing and denoising
Anatomical and functional data were preprocessed using fMRIPrep v21.0.269. B0-field maps were estimated with Topup70. Anatomical T1-weighted (T1w) images were corrected for intensity non-uniformity using ANTS 2.3.371, skull-stripped, segmented using Fast (FSL 6.0.5)72, and normalized to standard space (MNI152Nlin2009cAsym) with nonlinear registration (ANTs 2.3.3). Brain surfaces were reconstructed using recon-all (FreeSurfer 6.0.1)73. Due to a corrupted T1w image for participant 4023, co-registration failed, and 4023 was excluded from fMRI analysis.
BOLD head motion parameters were estimated using MCFLIRT (FSL 6.0.5)74. Functional runs were co-registered to anatomical T1w references using boundary-based registration (FreeSurfer) and resampled to standard space. Confounding time-series were calculated for CSF/WM region-wise global signals, and motion artifacts were identified using independent component analysis (ICA-AROMA)75. Non-steady state volumes were removed and spatial smoothing with an isotropic Gaussian kernel of 6 mm FWHM (full-width half-maximum) was applied. Denoising using Nilearn 0.9.276 was performed by detrending, standardizing, and bandpass filtering (0.01–0.1 Hz) time series data, and by regressing ICA-AROMA motion artifacts and mean CSF + WM signals75. Physiological noise was addressed via ICA-AROMA + CSF/WM regressions rather than with physiological recordings. Additional denoising for whole-brain network analyses involved regressing global signal and excluding BOLD runs with mean FD > 0.3 mm to obtain functional connectivity distributions mean-centered around zero, which were confirmed by visual inspection.
Functional connectivity analysis
Functional connectivity analyses were performed on seven canonical resting state networks (RSNs), eight a priori defined regions of interest (ROIs), and whole-brain networks (Nilearn 0.9.2) (Brain Connectivity Toolbox77). To understand how this meditation style influences large-scale neural dynamics, we examined functional connectivity and whole-brain network measures, capturing the integration, segregation, and reorganization of brain networks.
Resting state networks and regions of interest
RSNs examined included the default mode network (DMN), dorsal attention network (DAN), executive control network (ECN), salience network (SN), sensorimotor network (SMN), visual network (VN), and auditory network (AN). The Montreal Neurological Institute (MNI) coordinates for the 36 regions that comprise them were extracted from the Raichle (2011) atlas78 (Supplementary Table 3). Mean denoised BOLD time series were extracted from 10 mm-radius (523-voxel) spheres centered on the MNI coordinates. Between-region Pearson correlations were calculated and z-transformed to obtain a measure of connectivity strength. Within-network connectivity was calculated as the mean connectivity between each unique pair of ROIs within a given network, and between-network connectivity was calculated as mean connectivity between all ROIs from two networks, with each ROI pair containing one region per network. Eight a priori ROIs were additionally selected for a hypothesis-driven analysis based on task-induced and connectivity changes in other meditation studies79,80,81,82: medial prefrontal cortex (mPFC), right and left dorsolateral prefrontal cortices (r/l dlPFC), right and left insular cortices (r/l IC), right and left angular gyri (r/l AG), and central precuneus, with MNI coordinates extracted from the DiFuMo atlas83 (Supplementary Table 4). Mean denoised BOLD time series per region were extracted from 10 mm-radius (523-voxel) spheres centered on the MNI coordinates, and between-region Pearson correlations were calculated.
Whole-cortex/brain networks
Networks were constructed from the 25%-thresholded 48-region Harvard-Oxford 2 mm cortical atlas37 and from the 264-region whole-brain Power (2011) atlas38 by extracting mean denoised BOLD time series per region per parcellation and calculating between-region Fisher z-transformed correlations for all possible pairs. We constructed weighted undirected graphs and computed modularity, global efficiency, and characteristic path length per network. Functional connectivity value distributions were visually inspected, and one outlier run not mean-centered around zero was excluded from Power atlas analysis. Network measures were recalculated while excluding runs with mean framewise displacement > 0.3 mm to check if any significant effects were due to motion artifacts.
Statistics
We investigated scanner head motion per session and condition with a 2 (pre/post) × 2 (meditation/rest) repeated measures ANOVA on mean and maximum framewise displacement per BOLD run with post-hoc effects confirmed with Wilcoxon signed rank tests. MEQ score differences were compared between sessions with Wilcoxon signed rank tests (n = 18, two subjects missing data).
After confirming normality and heteroskedasticity, paired t-tests compared RSNs, their component regions, a priori ROIs, and whole-cortex/brain networks pre- and post-intervention (separately for rest and meditation scans), plus rest and meditation (separately for pre- and post-scans) to investigate effects of time and of meditation, respectively. On rest vs. meditation comparisons, the last 5 min of the 15-min meditation scan were used to compare equal-length scans. P-values were corrected for multiple comparisons using Bonferroni–Holm family-wise error correction and Benjamini–Hochberg false discovery rate when no results reached pFWE < 0.05.
Anatomical data
Preprocessed skull-stripped segmented T1w data was resampled to the MNI fsaverage template using mris_preproc (FreeSurfer 7.3.2) and cortical surface was inflated to an average spherical surface. Hemispheres were automatically parcellated into regions of interest, and vertex-wise volumetric and cortical thickness calculations were performed. Images were spatially smoothed with a 5 mm FWHM Gaussian kernel. Pre-vs-post differences were assessed by repeated measures ANOVA, and group differences between novice and advanced participants at each timepoint were assessed by fitting a general linear model using mri_glmfit-sim. Total intracranial volume and age were included as covariates, and results were cluster corrected with a cluster-wise p-threshold = 0.01.
Human plasma collection
Human plasma was collected and processed, as described in ref. 84, via venous puncture by registered nurses, physicians, and phlebotomists, at pre-intervention either off-site (“Day -1”, 2 days pre-retreat, 2–4 pm) or on-site (“Day 0”, 1 day pre-retreat, 11 am–4 pm) and post-intervention (“Day 8”, on-site, 9–5 pm). Participants were offered the same food options for all breakfast, lunch, and snacks throughout the week, although food choices were not monitored. All participants were required to fast for at least 30 min prior to blood collection. Blood was collected in EDTA-coated tubes (BD, Franklin Lakes, NJ) and kept at 4 °C (wet ice) for less than 30 min. Plasma was isolated by centrifugation at 3000 RPM for 15 min in an E8 Touch tabletop centrifuge (LW Scientific, Lawrenceville, GA), aliquoted into 1.5 mL Eppendorf tubes, and immediately frozen on dry ice. At the end of the retreat, samples were shipped to UCSD and stored at −80 °C.
Plasma nanoparticle tracking analysis
Plasma Nanoparticle Tracking Analysis (NTA) measured circulating plasma nanoparticle size and concentration with a NanoSight NS300 instrument (Malvern Instruments Ltd., UK). Samples were thawed on ice and diluted in PBS (100×) to prevent aggregation. Measurements were performed at room temperature under continuous video recording (16 × 30-s. acquisitions/sample) and 532 nm laser illumination. Mean hydrodynamic diameter, size distribution, and particle concentration were obtained per sample with NTA 3.3 software.
ELISA
To investigate plasma concentrations of oxytocin, beta-endorphin, dynorphin, anandamide, cocaine, and amphetamine-regulated transcript (CART), c-reactive protein (CRP), and neuropeptide Y (NPY), pre- and post-intervention plasma samples were tested with commercially available ELISA kits listed in Supplementary Table 12 following manufacturers’ instructions. Absorbance was measured with a Tecan Spark 10 M microplate reader, and concentrations were calculated by interpolating absorbance values against the standard curve, previously fit with a 3-parameter logistic curve. Pre- and post-intervention concentrations were compared with Wilcoxon signed rank tests.
Plasma proteomics
To investigate the intervention’s effects on the plasma proteome, 7596 proteins were quantified with the SomaScan Assay v4.1 (SomaLogic, Boulder, CO, USA).
SomaScan assay
Samples were thawed on ice, diluted in SomaLogic plasma diluent, and loaded onto SomaScan 96-well plates containing capture SOMAmer reagents for 7596 unique human protein targets. Plates were incubated for protein capture, unbound material was washed away, and biotinylated capture antibodies were added to hybridize with SOMAmer-bound proteins. Streptavidin-conjugated Cy3 dye was added to label the antibodies, plates were washed to remove unbound dye, and protein-bound SOMAmer reagents were eluted and hybridized to custom DNA microarrays containing complementary sequences to each SOMAmer. Cy3 fluorescence intensity in relative fluorescence units (RFU) measured protein abundance. Hybridization control normalization removed sample variance between microarrays and scanners; median signal normalization removed within-plate inter-sample differences; and calibration normalization removed variance across assay runs. Performance and quality were monitored with blank wells, technical replicates, and spiked protein controls, and precision was assessed by calculating coefficients of variation for all measurements. Background subtraction RFU calculations were performed with SomaLogic Discovery Server software.
Data processing
RFU values were normalized, log10-transformed, and auto-scaled (mean-centered and divided by each variable’s standard deviation), and outliers above two SDs were flagged. Foldchange and paired t-tests tested pre/post-intervention differences, and hierarchical clustering and k-means clustering revealed correlated variation expression patterns. Functional enrichment analysis (Enrichr-KG) on differentially expressed proteins (pre/post p < 0.01), with all SOMAmer targets as background, assessed enriched biological processes, molecular pathways, and cellular components. Enriched pathways were considered significant at pFDR < 0.05. Protein-protein interaction subnetworks of significant proteins (p < 0.05 or |fold change| ≥ 0.5) were created in Cytoscape with ≤30 interactor nodes and heat diffusion using the STRING database85.
Plasma metabolomics
640 metabolites in whole plasma were detected via liquid chromatography-mass spectrometry analysis using the widely-targeted Metware platform (Metware Biotechnology, Woburn, MA, USA).
Metabolite detection
Plasma samples were extracted with a 1:4 ACN:methanol solution and centrifuged at 12,000 RPM (10 min, 4 °C) and again at 12,000 RPM (3 min, 4 °C) after 30 min. at −20 °C. Supernatants were analyzed by ultra-HPLC (UPLC) (ExionLC 2.0, Sciex, Framingham, MA, USA) on a UPLC column with a gradient elution system for metabolite separation (UPLC conditions listed in Supplementary Table 13). Eluted metabolites were detected based on mass and fragmentation patterns by Tandem Mass Spectrometry (MS/MS) using a quadrupole-time of flight mass spectrometer (QTRAP®6500+, Sciex) with an electrospray ionization (ESI) Turbo Ion-Spray interface, operating in positive and negative ion mode. Untargeted qualitative metabolite identification was performed by matching ion features to references from Metware, HMDB86, METLIN87, and KEGG88 databases. Identified metabolites were then quantified using triple quadrupole mass spectrometry with multiple reaction monitoring (mass spectrum conditions in Supplementary Table 14). Mass spectrometry chromatographic peaks were corrected with MultiQuant software (Sciex). Reproducibility, cross-contamination, and inter-sample quality were controlled with control samples, internal standard peaks from blank samples, and internal standards, respectively.
Metabolite analysis
Quantified metabolite features were variance-filtered via inter-quartile range (max 25% filtered out), normalized, and log10-transformed. Outliers above 2 standard deviations were flagged. Dietary factors and fasting may have introduced confounds in proteomic and metabolomic measures, as no standardized diet was implemented and fasting times beyond 30 min pre-blood collection were not controlled. Exogenous compounds annotated as dietary or drug-related by HMDB were monitored using the MetaboAnalyst pipeline and were flagged or removed if observed among the top 25 features. PCA, hierarchical cluster analysis (HCA), partial least squares discriminant analysis (PLS-DA), and FDR-corrected pre/post paired t-tests (Scikit-learn89) identified differentially expressed metabolites. Correlation heatmaps were generated using Pearson r distance measures. Metabolic pathway analysis comparing pre- to post-samples was performed with MetaboAnalyst v5.0 based on the KEGG database. Pathway enrichment was first assessed using MetaboAnalyst, and false discovery rate (FDR) correction was applied to control for multiple comparisons. Significant pathways (pFDR < 0.05) were then selected for follow-up analysis. For these pathways, we examined the distribution of normalized feature values and report the corresponding p-values for group comparisons after normalization.
Real time cellular metabolic analysis
To investigate the effects of human plasma on cellular metabolism, we performed Seahorse XF mitochondrial stress, glycolytic rate, and ATP production assays on BE(2)M17 cells (ATCC), a human neuroblastoma cell line, exposed to plasma followings90,91 methods.
Cell culture and plasma treatment
BE(2)M17 cells were cultured in complete DMEM/F12 medium supplemented with 10% FBS and 1% penicillin/streptomycin under standard conditions (37 °C, 5% CO2). Cells were harvested, washed, and seeded onto microplates pre-coated with poly-L-lysine at a 40,000 cells/well density and incubated overnight. Cells were resuspended in XF assay medium and treated with 1% plasma for 1 h at 37 °C, with 4 technical replicate wells per plasma sample, and stained with DAPI for post-assay cell counting.
Seahorse XF assays
Seahorse XF96 Analyzer (Agilent, Santa Clara, CA, USA) was calibrated according to manufacturer’s instructions, and the following injection protocols were implemented: Mitochondrial Stress Test (kit #103015-100): Oligomycin (1.5 µM), FCCP (2.0 µM), and Rotenone/Antimycin A (0.5 µM) were sequentially injected to measure basal respiration, proton leak, maximal respiration, and spare respiratory capacity, with oxygen consumption rate (OCR) monitoring. Glycolytic Rate Test (kit #103344-100): Rotenone/antimycin A (0.5 µM) and 2-deoxyglucose (50 mM) were injected to assess basal glycolytic rate, glycolytic reserve, and non-glycolytic acidification, monitored by extracellular acidification rate (ECAR). ATP Production Rate Test (kit #103592-100): Injections of oligomycin (1.5 µM) and rotenone/antimycin A (0.5 µM) enabled real-time calculation of ATP production rates from OCR and ECAR.
Data analysis and statistics
We used Seahorse XF software (v.2.6) to analyze raw OCR and ECAR data, normalizing results by cell counts, and compared metabolic parameters between control, pre-, and post-intervention groups with paired t-tests (p < 0.05 considered significant). We assessed cell viability pre- and post-treatment and included four non-cellular blank well controls per plate to ensure assay quality.
Neurite differentiation
To investigate the effects of human plasma on neurite growth, PC12 neuroendocrine cells were differentiated to their neuronal phenotype, treated with plasma, and live-imaged following published methods92.
Cell culture and differentiation
PC12 cells (ATCC, Manassas, VA, USA) were cultured in RPMI 1640 medium supplemented with 10% horse serum, 5% FBS, and 1% penicillin/streptomycin under standard conditions (37 °C, 5% CO2). On Day 0, differentiation was induced by plating cells onto poly-D-lysine-coated plates at a 1.0 × 10⁴ cells/cm2 density and culturing them with Opti-MEM medium supplemented with 0.5% FBS, 1% penicillin/streptomycin, 50 ng/mL nerve growth factor (NGF), and either 1% human plasma pooled from pre- and post-intervention or no plasma (control cells) with 2 technical replicate wells per condition. Medium was replaced every 48 h. Media was supplemented with 1% Culture One from Day 2 onwards to support neuronal differentiation.
Live-cell imaging and neurite analysis
Differentiated cells were live-imaged every 24 h for 10 days at 20× in a live cell imaging microscope (Keyence BZ-X700) equipped with a phase contrast objective and an incubation chamber at 37 °C, 5% CO2, and controlled humidity. Images were acquired under consistent illumination across groups and time points, and background subtraction and image thresholding were applied to enhance neurite visualization. The single longest neurite per cell, for cells for which it was longer than the cell body diameter, was manually traced in FIJI software (v1.0). Neurite lengths were compared with two-tailed independent samples t-tests between plasma-treated and control groups at each time point. Treatment wells remained blinded until completion to avoid bias.
Exosome-specific small RNA transcriptomicsExosome isolation
Exosomes were isolated from plasma samples (300–500 µl) by centrifugation at 300 × g for 10 min at 4 °C to remove cell debris. Supernatants were transferred to microcentrifuge tubes, filled with 1× PBS, balanced for mass, placed in a pre-cooled Beckman Coulter Type 70.1 rotor, and centrifuged at 10,000 × g for 30 min at 4 °C with maximum acceleration and gradual deceleration. Supernatants were transferred to new tubes, exosome pellets were resuspended in 100 µl 1× PBS, and another round of ultracentrifugation at 100,000 × g for 2 h. at 4 °C was performed. Final exosome pellets were resuspended in 150 µl 1× PBS, analyzed by nanoparticle tracking using the same protocol as whole plasma, and stored at −80 °C.
Exosome RNA sequencing
Total RNAs were purified from exosome pellets using Direct Zol RNA mini kit (Zymo Research). RNAs were eluted in 20 µl of RNAse-free water and concentrated to 5 µl using SpeedVac Vacuum Concentrator (Thermo Fisher Scientific). 44 to 523 ng of exosome-specific extracellular small RNAs (exRNAs) were obtained from 28 human plasma samples. exRNA quantity and integrity were determined using the NanoDrop ND-1000 spectrophotometer (Thermo Fisher Scientific) and the Bioanalyzer 2100 (Agilent, Santa Clara, CA, USA), respectively. Small exRNA libraries were generated using NEXTFlex Small RNA-seq Kit v4 with UDIs (Revvity Inc, Waltham, MA, USA) according to modified manufacturer’s protocol to account for low exRNA concentrations in exosome samples. The strategy for small RNA libraries aimed at a range of 16–120 nucleotide (nt)-long transcripts for accurate identification and quantification of exosome-specific extracellular microRNAs, ncRNAs, and protein-coding RNAs. NEXTFLEX® 3′ Adenylated Adapter v4 was ligated at 25 °C for 1 h. Following 3′ Adenylated Adapter inactivation, NEXTFLEX 5′ Adapter v4 was ligated at 20 °C for 1 h. Reverse Transcription-First Strand Synthesis from 5′ and 3′ NEXTFLEX® Adapter Ligated RNA templates was conducted at 50 °C for 1 h, followed by inactivation at 90 °C for 5 min. First Strand Synthesis products were purified using NEXTFLEX Cleanup Beads by two washes in 80% ethanol. RNA templates were combined with NEXTFLEX UDI Barcoded Primer Mixes v4 diluted 1:4 and amplified by PCR for 24 cycles. PCR products size selection and cleanup were done using NEXTFLEX Cleanup Beads. Small exRNA libraries were eluted from beads in 15 µl and concentrations were determined using Qubit dsDNA HS Assay (Life Technologies). DNA fragment profile in small exRNA libraries was analyzed on the Bioanalyzer 2100. RNA-seq was conducted on the NovaSeq × Plus Short-Read Sequencer (Illumina, San Diego, CA) at the Genomics Research and Technology Hub, University of California, Irvine.
RNA-seq data processing
Sequencing read data were converted to FASTQ format for bioinformatic processing using Lonestar6 supercomputer at the Texas Advanced Computing Center and bioinformatically processed according to guidelines developed for NEXTFLEX Small RNA-Seq (Revvity Inc., Waltham, MA, USA). In brief, flanking forward (TGG AAT TCT CGG GTG CCA AGG) and reverse (AGA TCG GAA GAG CGT CGT GTA GGG AAA GA) adapter sequences were trimmed prior to alignment with Cutadapt93. Paired reads above 16 nucleotides with quality scores above 20 were mapped to the human genome primary assembly (Release 47, GRCh38.p14). Reads-to-genome alignment was conducted using STAR aligner94. Mapping quality was assessed using MultiQC tool95.
Detection of differential exosomal RNAs
The differential analysis of sequence read count data was done using a generalization of a paired t-test using EdgeR software96,97,98 in which exosome RNA pools in pre- and post-intervention samples per participant were compared separately and the baseline differences between participants were subtracted. Transcripts with fewer than 10 counts were removed from analysis. Trimmed Mean of M-values (TMM) normalization99,100 was applied to account for compositional difference between samples. exRNA were annotated using org.Hs.eg.db101 and miRbase102 databases. Sequences corresponding to non-coding RNAs (ncRNAs) and exhibiting the highest variance across all samples were analyzed by PCA of TMM-normalized counts using PCAtools Bioconductor package. Functional analysis of differential exRNA was done using ClusterProfiler103 and the Reactome Pathways Knowledgebase46. A paired design in the negative binomial (NB) generalized linear model (GLM) detected the effect of the intervention on the composition of exRNAs from paired post-intervention (n = 14) vs pre-intervention (n = 14) samples, while adjusting for differences between participants. Participants’ experience level (9 advanced, 5 novices), gender (8 females, 6 males), and age were included as additional covariates.
Machine learning and MEQ-features correlation analyses
We applied machine learning to identify the most biologically relevant features across time point (pre/post) and experience level (novice/advanced) datasets. Each dataset was preprocessed (log-transformed and auto-centered) and missing data was imputed to ensure feature scaling, normalization consistency, and data integrity and comparability across modalities104. Post-preprocessing, ELISA, metabolomics, transcriptomics, and proteomics datasets were concatenated into a single feature matrix used as input for an eXtreme Gradient Boosting (XGBoost)105 classifier chosen for its ability to handle high-dimensional data. To obtain a unified impact metric per feature, the dataset was passed through a Shapley Additive exPlanations (SHAP)106 explainer model. Spearman correlations were then calculated between MEQ scores and the top 14 features per model and corrected for multiple comparisons to explore whether the top molecular changes were linked to subjective outcomes.
Statistics and reproducibility
Given the n = 20 sample size (n = 19 for fMRI), nonparametric Wilcoxon signed rank statistics were performed throughout when comparing paired samples, except when n ≥ 30 (e.g., protein targets) or when normality and homoskedasticity were ascertained, in which case two-tailed paired t-tests were employed. Given that proteomic and metabolomic analyses were hypothesis-free and data driven, False Discovery Rate (FDR) correction was applied using the Benjamini–Hochberg procedure, and reported p-values are labelled as FDR-adjusted, with nominal p-values included for transparency. Seahorse XF plates were prepared with 4 technical replicates (wells) per participant and time point. PC12 assay plates were prepared with pooled plasma (n = 20) with 2 technical replicates (wells) per treatment (pre-plasma/post-plasma/no treatment).
Ethics and inclusion statement
Data collection and analysis was performed locally in San Diego, CA, USA and included local researchers. Roles and responsibilities were agreed amongst collaborators ahead of the research, and clinical practice and biospecimen handling trainings were provided to all researchers. The study was approved by a local research ethics committee and did not result in personal risk to study participants. Researchers who handled biospecimens during collection and analysis wore adequate personal protective equipment. fMRI researchers and participants were thoroughly screened for MRI safety before being allowed inside the fMRI magnet room.