
DNA sequencing
WGS and WXS data were newly generated for the MD Anderson Cancer Center, Duke University Hospital, Henry Ford Hospital, Case Western Reserve University, Chinese University of Hong Kong, Mayo Clinic, Northwestern Medicine, Olivia Newton-John Cancer Research Institute, University of California, San Francisco, Saint Joseph’s Hospital and Medical Center, Seoul National University and Luxembourg Institute of Health at the Jackson Laboratory for Genome Medicine sequencing core. All were subjected to 150 base pair (bp) paired-end sequencing using Novaseq (Illumina) according to the manufacturer’s protocol. Previously published longitudinal data from GLASS5,12 and TCGA7 were also used and the sequencing information for those can be found in previous publications. In total, sequencing data were contributed by 21 institutions: Columbia University, University of Florida, German Cancer Research Center, Pitié-Salpêtrière, Samsung Medical Center, Biobank Japan, University of South Wales, University of Sao Paulo and the aforementioned 13 institutions including the Jackson Laboratory. For the Seoul National University cohort, both DNA and RNA were concurrently extracted from each tumour sample at the Jackson Laboratory for Genomic Medicine using QIAGEN’s AllPrep DNA/RNA Mini Kit (80204). For blood samples, DNA extraction was done using QIAGEN’s QIAamp DNA Mini and Blood Mini Kit (51104). A total of 200 ng of DNA was fragmented to 400 bp using an LE220 focused-ultrasonicator (Covaris) and then size-selected with Ampure XP beads (Beckman Coulter). The DNA fragments underwent end repair, A-tailing and ligation of Illumina unique adapters (Illumina) using the KAPA Hyper Prep Kit from Roche (7962363001). The resulting whole-genome libraries were sequenced with 150-bp paired-end reads on the Illumina NovaSeq 6000. Sequencing coverage on average was 27× and more than 100×, respectively, across WGS and WXS longitudinal samples, and driver mutations were consistently supported by sufficient depth (ranging from 30×–80× for WGS and 80×–300× for WXS) in both primary and recurrent tumours, minimizing the effect of coverage variability on mutation detection.
Reference cohorts
GLASS data were compared with data from two reference cohorts: TCGA7 and AACR GENIE (v.18.5)25. Clinical data for patients in the GLASS cohort at baseline were compared with data from TCGA patients with primary IDH-mutant gliomas with respect to age of onset and overall survival5,7,12. Survival data for patients with oligodendrogliomas and astrocytomas were compared between the GLASS and GENIE cohorts. The GENIE cohort includes mainly panel sequencing data, and in most cases lacks copy-number data or coverage of TERT promoter hotspots. Oligodendrogliomas in the GENIE cohort were therefore defined as IDH-mutant gliomas without alterations in TP53 or ATRX, as determined by high-coverage panel sequencing, whereas IDH-mutant gliomas with these alterations were called astrocytomas.
GLASS identifiers
A GLASS barcode system based on the TCGA barcode design was used to identify all samples and their corresponding patients. In brief, the 24-character barcode includes information about the project, collection centre, patient identification, sample type, analyte type and sequencing platform. Detailed information on the barcode breakdown is available in a previous GLASS publication12.
Computational pipelines
GLASS pipelines for variant and copy-number calling were developed using Snakemake (v.5.2.2)46. The Genome Analysis Toolkit 4 (GATK4, v.4.1.0.0)47 suite was used unless otherwise specified. All data were analysed using homogeneous pipelines capable of processing raw FastQ files.
Alignment and variant calling
In brief, in alignment and preprocessing, the study adhered to GATK Best Practices, using various tools to manage and sanitize binary alignment map files, assign and manage read groups, perform QC, mark sequencing adapters, align sequences to the b37/hg19 genome (human_g1k_v37_decoy), merge and mark duplicates and perform base recalibration. For variant detection, GATK4 was used, with germline variants called from control samples, and somatic variants identified in tumour samples and patient cohorts. QC measures included evaluating cross-sample contamination and read orientation artefacts. In variant post-processing, BCFTools (v.1.9)48 normalized, sorted and indexed variants to generate a consensus variant call format (VCF) file, which was then annotated and used to compare allele frequencies between related samples, with single-sample variants overlaid on multi-sample calls to infer individual sample mutations. Further details of these steps can be found in the previously published GLASS paper5.
Copy-number calling
Copy-number identification was performed according to GATK Best Practices, with different methods for WGS and WXS data. For WGS data, the genome was segmented into 10-kb bins, whereas overlapping regions from various capture kits were merged for WXS data. Both strategies included counting reads in these bins, subsetting germline variants and separating the cohort by sequencing centre to create a panel of normals. This involved denoising read counts, annotating intervals for GC content and inspecting results for quality. Copy-number calling used a method based on GATK CallCopyRatioSegments and GISTIC (v.2.0.23)26, identifying neutral segments and classifying amplifications or deletions on the basis of weighted means and standard deviations. Chromosome arms were analysed to set high-level thresholds, and gene-level copy numbers were called by intersecting gene boundaries with segment intervals and comparing the weighted non-log2 copy ratio to these thresholds. These steps have also been described in detail previously5.
Molecular data cohort selection
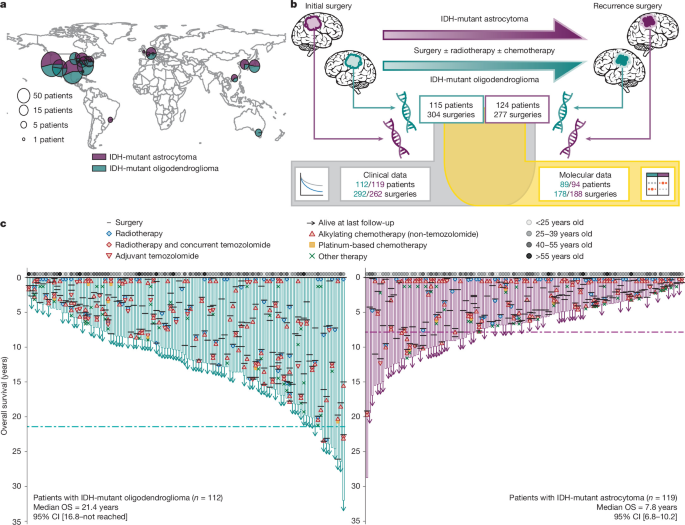
Stringent QC measures were put in place to retain time-separated surgeries for molecular analyses (Extended Data Fig. 1b). QC criteria required (QC1) that a tumour sample was available and WGS and/or WXS data were generated from the sample; (QC2) that fingerprinting confirmed sample identity using the Picard CrosscheckFingerprints tool49; (QC3) that sequencing coverage was at least 8× for WGS samples and at least 28× for WXS samples, and that the mutation frequency was not zero and not abnormally elevated (indicative of FFPE artefacts); (QC4) a minimum interval of 3 months between the initial and recurrent surgery; (QC5) the exclusion of patients with only one surgery remaining and a restriction to two distinct surgeries per patient, choosing the first and last surgery available; and (QC6) that copy-number profiles met quality thresholds without excessive noise, unexpected genomic stability or insufficient signal, as independently assessed and jointly reviewed by three of the authors (T.C., K.C.J. and F.S.V.).
sSNV calling
dN/dS ratios were estimated using dNdScv (v.0.1.0)50 with the default and recommended parameters applied to all mutations in initial and recurrent tumour samples, as well as for each mutational fraction (unique to initial, unique to recurrent, and shared). These analyses were performed separately for each of the two types of IDH-mutant glioma. Adequate sequencing depth and reciprocal mutation calling between paired samples minimized coverage-related false negatives; because our analysis compares shared mutations with sample-specific ones, coverage variation is unlikely to affect the qualitative patterns observed.
Clonality analysis
We used PyClone-VI51 to assess the clonal status of all sSNVs in our dataset. In brief, variants with a minimum coverage of 10× in at least one sample from each paired set were included in the analysis. PyClone-VI was run in beta-binomial mode using default parameters. Mutations with a cancer-cell fraction higher than 0.9 were classified as clonal, and those below this threshold were considered subclonal.
GISTIC
GISTIC26 was run on the public version of the GenePattern server, on the segmentation data of primary and recurrent tumours for each type of IDH-mutant glioma individually to identify broad and focal copy-number changes of significance in each group. The analysis was done using the GeneGISTIC method, with broad event detection and gene collapse values set to extreme. Additional parameters included a focal length cut-off of 0.5 or higher, with a confidence level of 99% and a chromosome-arm adjustment capped at 1.0. Copy-number driver genes were identified from the GeneGISTIC results.
Aneuploidy calculation
Aneuploidy was calculated at three different levels for all samples: arm level, segment level and genome-wide level. For the arm-level aneuploidy calculation, a previously described method was used52. In brief, adjacent segments with identical arm-level calls (−1, 0 or 1) were merged, resulting in a single call for each merged segment. The proportion of the chromosome arm spanned by each merged segment was calculated. Segments covering over 80% of the arm were called −1 (loss), 0 (neutral), +1 (gain) or NA, if no segment covered at least 80%. For each sample, the number of arms with non-neutral events was then counted. As a secondary method, average log2(copy-number ratios) were calculated to compare arm-level aneuploidies between groups. Lower thresholds were set at ±0.1 for significant arm-level gain or loss at any time point and ±0.05 for significant arm-level changes (∆gains or losses).
For segment-level calculation, each segment was assigned a status of gain, loss or neutral on the basis of the log2 copy ratio threshold of ±0.2. Segments with an absolute log2 ratio greater than 0.2 were considered altered. In each sample, the total number of altered segments (gains and losses) was counted.
High-level amplification and homozygous deletion thresholds were determined per sample from segmented copy-number data by calculating the weighted mean and s.d. of non-log2 copy ratios among neutral segments (0.9–1.1), with segment length used as weights and iterative filtering performed twice to remove outliers. Thresholds for amplification and homozygous deletion were then defined as the twice-filtered weighted mean ± 2 s.d.
For genome-wide level calculation, FGA was calculated with the following formula: FGA = 1 – (total base pairs in neutral segments/total callable base pairs). For WGS samples, the callable genome size was assumed to be 3 × 10⁹ bp. For WXS samples, callable size was set to 5 × 10⁷ bp on the basis of the exome capture target region. FGA values were calculated per sample using platform-specific copy-number profiles and normalized to a 0–1 scale; WGS and WXS represent mostly non-overlapping tumour sets.
Structural variant calling
Structural variants (SVs) were called on WGS data only using SvABA (v.1.2.0)53, against the hs37d5 reference genome, incorporating dbSNP build 138 (b37) and excluding ENCODE hg19 blacklist regions. Somatic SVs were extracted from SvABA VCFs and parsed in R, with break-end records resolved to obtain partner coordinates and strand orientation. Only autosomes and chromosome X were retained, and events on decoy, random or alternative contigs were excluded. Reciprocal break ends were paired to reconstruct complete events and classified as deletions, duplications, head-to-head inversions, tail-to-tail inversions or translocations, with duplicate mates collapsed to a single representative event per sample.
Chromothripsis
Chromothripsis events were identified using ShatterSeek (v.1.1)54. Copy-number segments were derived from GATK segmentation output for WGS aliquots, and somatic SVs were called using SvABA. Only samples with both SV and copy-number data were retained for downstream chromothripsis analyses. Of the copy-number segments, log2 copy ratios were converted to integer total copy number and capped at 20, and adjacent segments with an identical copy number were merged. Chromothripsis was assessed on the basis of break-point clustering, oscillating two-state total copy-number patterns and fragment-join randomness, and chromosome-level summaries were used to define confidence categories. High-confidence events required more than five intrachromosomal SVs, more than six oscillating segments, significant break-point enrichment or clustering (P < 0.05) and non-random fragment joins (P > 0.05); low-confidence events met similar criteria, with four to six oscillating segments. Alternatively, high-confidence events required more than two intrachromosomal SVs, with more than three interchromosomal events and more than six oscillatingsegments.
Kataegis
Kataegis events were called using SigProfilerSimulator and SigProfilerClusters (v.1.2.2)55 as previously described. For each sample, 100 simulated genomes were generated under a pentanucleotide context model, preserving chromosome-level mutation burdens and transcriptional strand bias, to derive empirical intramutational distance thresholds. Cluster detection incorporated genome-wide correction for regional mutation density using 1-Mb windows, and variant allele frequencies were considered during subclassification. From the outputs, kataegis event results were selected and mutations sharing a cluster group identifier were aggregated and defined as a single kataegis event. Finally, the number of events per sample was counted to establish the kataegis burden (log2(kataegis count + 1)) per sample. Kataegis analyses were restricted to non-hypermutator samples to avoid violation of the genome-wide background mutation rates.
WGD
ASCAT was used in multi-sample mode to derive patient- and sample-level WGD status56. Denoised copy ratio and tumour and normal allelic count files from the GATK CNV caller were transformed into tumour and normal B-allele frequency as well as tumour and normal logR files as input for ASCAT. ASCAT was run in case-based multi-sample mode. WGD was called from the ASCAT solution as part of the reported summary metrics. To avoid overestimating WGD, we applied a second filter and used a cut-off of major copy-number fraction ≥ 0.5 assessed by Sequenza in samples that were predicted to have undergone WGD by ASCAT.
Copy-number signatures
Allele-specific copy-number profiles from ASCAT were used as input for copy-number signature calling using the SigProfilerToolkit55. Sample-level 48-feature copy-number matrices were generated using SigProfilerMatrixGenerator. Assignment of copy-number signatures was performed using SigProfilerAssignment55 with the COSMIC v.3.5 reference copy-number signature set38. Per-sample absolute and relative signature activities were exported for downstream analyses.
Extrachromosomal DNA
Complex focal amplifications and extrachromosomal DNA (ecDNA) were detected using AmpliconSuite57, which integrates AmpliconArchitect and AmpliconClassifier. Case-based multi-sample mode was used with default AmpliconSuite parameters. From the output that categorizes amplicons into predefined classes (ecDNA, breakage–fusion–bridge cycles and linear amplification), we classified samples into samples lacking or containing ecDNA.
Mutational signatures
Mutational signature analysis was done in three steps using previously published methods28,58. First, WGS data for all the samples were used to create a mutational matrix and extract de novo signatures using SigProfilerExtractor (v1.2.1)58. We used the b37/hg19 reference genome, maximum signatures of 10 and non-negative matrix factorization replicates of 100 for the SigProfiler run. Seven SBS and seven ID de novo signatures were extracted from the oligodendroglioma cohort and ten SBS and six ID de novo signatures from the astrocytoma cohort, with an average stability higher than 0.8. Extracted signatures with a cosine similarity to a reference signature of 0.8 or higher were deconvoluted, whereas those with a similarity lower than 0.8 were retained as novel signatures (Supplementary Table 12). Then, de novo signatures were deconvoluted to a curated list of reference signatures for SBS, DBS and ID. To curate the reference signature list, we combined two public mutational signature databases: the COSMIC database (https://cancer.sanger.ac.uk/signatures)28 for SBS signatures 1–96 and all ID signatures, and the Signal database (https://signal.mutationalsignatures.com/explore/main/cancer/signatures)29 for SBS signatures 97 and higher. To ensure confidence in signature assignment probability, we used only WGS data from our cohort, aligning with the WGS-based curated reference. Finally, we used the deconvoluted reference signatures identified in step 2 to estimate the exposure of mutational signatures in each sample. The R package Palimpsest (v.2.0.0)59 was then used to assign the most likely signature to each mutation in a sample. We excluded four cases from downstream mutational signature analyses in which the initial, but not the recurrent sample, had a mutation burden exceeding 10 mutations per Mb.
Mutational burden
Mutational burden was determined by the number of mutations per Mb sequenced, requiring a minimum base coverage of 15×. Mutational burden was calculated per sample and shown on a common scale (0–10 for non-hypermutated tumours); WGS and WXS represent distinct tumour sets rather than matched samples sequenced on both platforms. DNA hypermutation was defined for recurrent tumours with a combination of more than 10 mutations per Mb and more than 25% of recurrence-specific mutations attributable to the COSMIC mutational signature SBS11. Tumours with fewer than 10 mutations per Mb were classified as non-hypermutant, whereas hypermutation status was left unassigned for tumours with more than 10 mutations per Mb but fewer than 25% of recurrence-specific mutations attributable to SBS11.
Mutual exclusivity analysis
Mutual exclusivity of genomic alterations was assessed using the DISCOVER (discrete independence statistic controlling for observations with varying event rates) algorithm (v.3.1.7)21, which computes tumour-specific probabilities of gene alterations while preserving the observed marginal totals per gene and per tumour. Expected co-occurrence rates between gene pairs were derived under a Poisson binomial model, accounting for these probabilities. Significantly fewer co-alterations than expected under this null model were interpreted as evidence of mutual exclusivity.
Assessment of batch effects
To assess potential sequencing-centre-related batch effects, we tested for associations between treatment centres and recurrent sSNVs, CNAs and mutational signatures using tumour-type- and hypermutation-status-stratified logistic regression models, which showed no significant centre-specific effects.
Survival analysis
Survival end points included overall survival from diagnosis and time to recurrence. Overall survival from diagnosis was defined as the interval between the date of primary surgical resection and the date of death or the date of last follow-up if censored. Time to recurrence was defined as the interval between the date of primary surgical resection and the date of first recurrence surgery. No censoring was required for time to recurrence because all patients had undergone a secondary surgery by study design. Overall survival from birth was calculated by adding age at diagnosis to OS from diagnosis. Post-recurrence survival was defined as the interval from the date of the QC-passed last recurrence surgery to death or censoring at last follow-up. Kaplan–Meier survival curves were generated and compared using the log-rank test with the survival and survminer R packages. Cox proportional hazards regression was used to estimate hazard ratios; variables with likelihood ratio test P ≤ 0.10 were considered for inclusion in multivariable models. Schoenfeld residuals were examined to verify the proportional hazards assumption; variables violating this assumption were excluded. Prognostic models were refined through stepwise backward elimination, and model performance was quantified using Harrell’s concordance index with 1,000 bootstrap resamples.
Other statistical methods
All statistical analyses were performed using R (v.4.3.2) and Python (v.3.10.13). For cohort-level comparisons that did not account for patient-level pairing, unpaired categorical variables were assessed using Fisher’s exact test or the χ2 test, and unpaired continuous variables using the Wilcoxon’s rank-sum or Kruskal–Wallis’ test, as appropriate. For cohort-level analyses specifically evaluating patient-level discordance over time, paired categorical variables were compared using McNemar’s test and paired continuous variables using the Wilcoxon’s signed-rank test. Statistical significance was defined as two-tailed P < 0.05 unless specified otherwise.
Ethics statement
The GLASS Consortium is an international observational study aimed at understanding the molecular response to treatment in adult glioma, in which data is pooled from different sources. The protocols used to collect and sequence specimens, or to collect and analyse data from patients, were approved by the institutional review board of Yale University (2000036542, 2000041140, 2000039350, 2000036441, 2000035189, 2000034831, 2000035190, 2000035426 and 2000035453) and as previously reported5,12. Anonymized patient and sample identifiers were generated as previously reported5. All participants provided written informed consent before enrolment, and the study was performed in accordance with the Declaration of Helsinki and applicable institutional and national ethical guidelines.
Reporting summary
Further information on research design is available in the Nature Portfolio Reporting Summary linked to this article.