
Chromosome-level assembly of the migratory locust
We conducted genome sequencing on an adult female locust with a heterozygosity of 1.58%, using a combination of long-read sequencing, optical mapping and chromosome conformation capture based on proximity ligation (Figs. 1a,b, Supplementary Figs. 1 and 2, Supplementary Table 1 and Supplementary Note 1). In female locusts, the third longest scaffold, identified as the X chromosome based on Hoechst staining of metaphase chromosomes, showed equal read coverage to autosomes and about twice that in male locusts (Figs. 1c,d). The high contiguity of the LMv3.1 assembly greatly improved the completeness of the transposable elements (TEs) (Supplementary Fig. 3). Fluorescent in situ hybridization (FISH) of a pericentromeric satellite DNA sequence (Fig. 1e and Supplementary Note 1) showed fluorescent bands on one of the chromosome ends (Fig. 1f), demonstrating the anticipated chromosome end regions. We predicted 18,127 protein-coding genes using RNA expression and homology data (Supplementary Fig. 4). The LMv3.1 assembly presented higher mapping rates of full-length transcripts than the LMv2.4 assembly, indicating improved coverage of RNA transcript structures (Supplementary Figs. 5 and 6). The improvement in genome contiguity facilitates further investigation of the epigenomic landscape in locusts.
Fig. 1: Chromosome-level assembly of the migratory locust.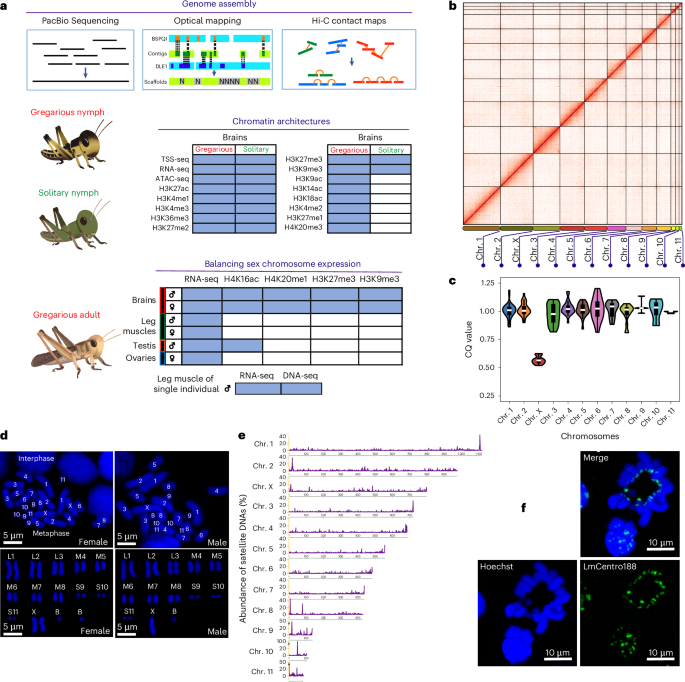
a, Summary of sequencing datasets in this study. b, Heatmap showing frequency of Hi-C contacts along the migratory locust genome assembly. c, Identification of the X chromosome using the chromosome quotient method. The X chromosome was identified by aligning the ~30X DNA-seq data from both male and female locusts to the genome assembly. To calculate the read coverage, the chromosomes were split into 30-Mb bins. The bin numbers for chromosomes 1–11 and X are 40, 33, 27, 24, 20, 18, 16, 16, 5, 4, 3 and 27, respectively. Boxplots indicate the median (center line), the first and third quartiles (box limits) and whiskers extending to 1.5× the interquartile range. d, Characterization of locust chromosomes. Embryos of the migratory locust were subjected to chromosome characterization using Hoechst 33342 nucleic acid stain; n = 1 independent biological replicates for demonstration purpose. e, The percentage distribution of satellite DNA sequences along locust chromosomes. Because centromeric satellite DNAs show a typical size greater than 100 bp, short tandem repeats with monomer lengths <100 bp were excluded from this analysis. The chromosomes were divided by partitioning into 1-Mb bins. f, FISH of the satellite DNA LmCentro188. The signal probe for LmCentro188 is conjugated with Alexa Fluor 488, and the chromosomes were labeled using Hoechst nucleic acid staining; n = 2 independent biological replicates.
Increased number of intronic enhancers in large-sized genes
To determine the chromatin structure, we performed cleavage under targets and tagmentation (CUT&Tag) sequencing for a panel of 13 histone modifications, assay for transposase-accessible chromatin using sequencing (ATAC-seq), transcription start site (TSS) sequencing (TSS-seq) and strand-specific RNA sequencing (RNA-seq) in brains. The hierarchical clustering of read coverage clearly reflected the noncrossreactivity of the primary antibodies, the consistency of biological replicates and the differences among sequencing methods (Fig. 2a). We demonstrated that the abundance of histone modifications is associated with gene expression levels (Supplementary Note 2 and Supplementary Fig. 7). Approximately 40% of the genomic regions were classified into the 11 ChromHMM-defined chromatin states, which are associated with distinct regulatory elements (Fig. 2b, Supplementary Note 3 and Supplementary Figs. 8–11). As exemplified in Supplementary Fig. 12, chromatin states allow for inference of gene expression. The intergenic region contributes the largest portion of chromatin states, due to its dominance in genomic composition (Supplementary Fig. 13). The permissive and repressed chromatin states have a considerable portion of TEs, indicating that TEs contribute to host regulatory innovation and are subject to epigenetic impact (Fig. 2c, Supplementary Note 4 and Supplementary Figs. 14 and 15).
Fig. 2: Difference in enhancer number between large-sized and short-sized genes.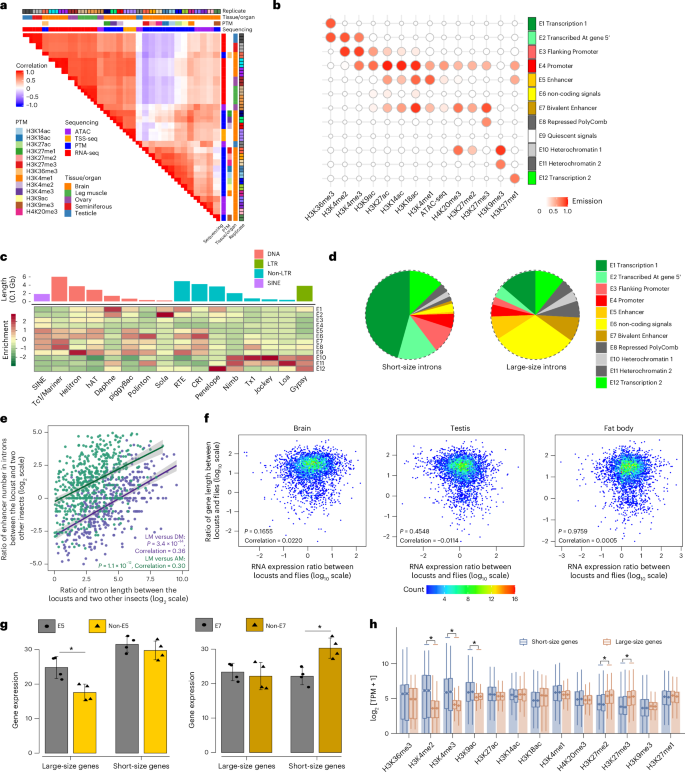
a, Pearson correlations among sequencing assays, tissues/organs and biological replicates based on the normalized signals in 10-kb window bins. b, Emission patterns of the 12 chromatin states. c, Enrichment profiles of chromatin states overlapped with different TE superfamilies. The 16 most abundant TE superfamilies were included in this analysis. d, Genomic region occupancy of chromatin states in short and long introns. Short-size introns correspond to the lower 25% of data, whereas large-size introns correspond to the upper 75% of data. e, Correlation between intron length changes and changes in enhancer number in the brains of the migratory locust (LM), the fruit fly (DM) and the honey bee (AM). A peak was considered an active enhancer if the abundance of both H3K4me1 and H3K27ac exceeded their first quartile (Q1). Error bands represent the 95% confidence interval around the fitted smoothing curve. f, Correlation between gene length changes and expression changes in somatic and reproductive tissues. Transcripts per kilobase million (TPM) was used as the unit for gene expression quantification. g, RNA expression of genes varies with different sizes in the presence and absence of chromatin states E5 and E7. Error bars, s.d. Short-size genes correspond to the lower 25% of data, whereas large-size genes correspond to the upper 75% of data; n = 4 independent biological replicates. Data are shown as mean ± s.e.m. P = 0.0125 for the E5 comparison and P = 0.0058 for the E7 comparison. *P < 0.05. h, Histone modification deposition on gene-body regions in short-size and large-size genes. Deposition abundance was determined using TPM + 1 on a log2 scale. *False discovery rate < 0.01. Boxplots indicate the median (center line), the first and third quartiles (box limits), and whiskers extending to 1.5× the interquartile range. PTM, post-translational modification.
The intron length in locusts exceeds the values observed in other insects (Supplementary Figs. 5 and 16). The chromatin states E5 (enhancer) and E7 (bivalent enhancer) occupy a broader region in the large introns than in the short introns, indicating a higher number of enhancers in large introns (Fig. 2d). The changes in intron length are correlated positively with the changes in enhancer number in the locust compared to the fruit fly and the honey bee, suggesting that the expansion of intron size is associated with an increase in enhancer number (Fig. 2e). The changes in gene length do not have a significant impact on the gene expression changes in the migratory locust compared to the fruit fly (Fig. 2f). Furthermore, expression values were distributed evenly among short-sized and large-sized genes in locusts (Supplementary Fig. 17), demonstrating that gene structure enlargement in locusts does not significantly impact gene expression. We also found that the RNA expression of the large-sized gene associated with an intronic enhancer is significantly higher than that of the large-sized gene lacking intronic enhancers (Fig. 2g), although it remains unclear whether these enhancers serve the role of enhancing transcription levels or adding extra control over gene expression. Compared with the short-sized genes, the large-sized genes show greater depletion of H3K4me2, H3K4me3 and H3K9ac, as well as greater deposition of H3K27me2 and H3K27me3 (Fig. 2h), which are catalyzed primarily by polycomb repressive complexes8. These results suggest that polycomb repressive complexes facilitate the spreading of H3K27me3, increase chromatin compaction and tether long-distance chromatin loops that promote contact between distal enhancer in the large-sized genes9. Taken together, the increase in enhancer numbers in large-sized genes, coupled with genome size expansion, may ensure equalized gene expression across genes of varying lengths in locusts.
Regulation of the intronic enhancer in behavioral plasticity
Because polyphenism is clearly modulated epigenetically10, we tried to use the behavioral changes of locusts as an example of epigenetic regulation in large genomes. Principal component analysis revealed the distinguishable spatial distribution of histone modifications linked to regulatory, repressive and transcription marks between the two locust phases (Fig. 3a). In the brain, we identified 1,069 genes that were upregulated and 485 genes that were downregulated in gregarious locusts. Gene ontology analysis suggests that the differentially expressed genes are involved in regulatory mechanisms underpinning behavioral regulation, signal transduction, synaptic plasticity and immune modulation (Supplementary Fig. 18). The two most significantly positively correlated histone modifications—H3K4me3 and H3K27ac—at the TSS region emphasize their role in promoter regulation (Fig. 3b). Conversely, the two most significantly negatively correlated histone modifications—H3K4me1 and H3K27me3—were situated 10 kb upstream of the TSS region, implying their involvement in a distal regulation as enhancers. Compared to the other three genomic categories, including promoters, introns and intergenic regions, H3K4me1 in the 10 kb region upstream of TSS showed the least overlap with H3K27ac (Supplementary Fig. 19), indicating primed enhancers lacking transcriptional enhancement11. We identified the binding sites of transcription regulators associated with differential H3K4me3/H3K27ac at promoters and differential H3K4me1/H3K27me3 situated 10 kb upstream of the TSS region (Fig. 3c). We found higher frequencies of five transcription regulators located in these two regions, including cg (which establishes long-range chromatin contacts at promoters12), Trl (a transcription activator associated with nucleosome remodeling and long-distance enhancer–promoter communication13), l(3)neo38 (an essential regulator of nervous-system development14), Sp1 (which controls gene expression within dopaminergic neurons15) and Clamp (a pioneer factor that increases chromatin accessibility at promoters16). Three of these five transcription regulators, including Trl, Sp1 and Clamp were differentially expressed between the solitary and gregarious locusts. Therefore, these three transcription regulators were probably involved in regulating differentially histone modification regions in brains of solitary and gregarious locusts.
Fig. 3: Chromatin differentiation of locust phase changes.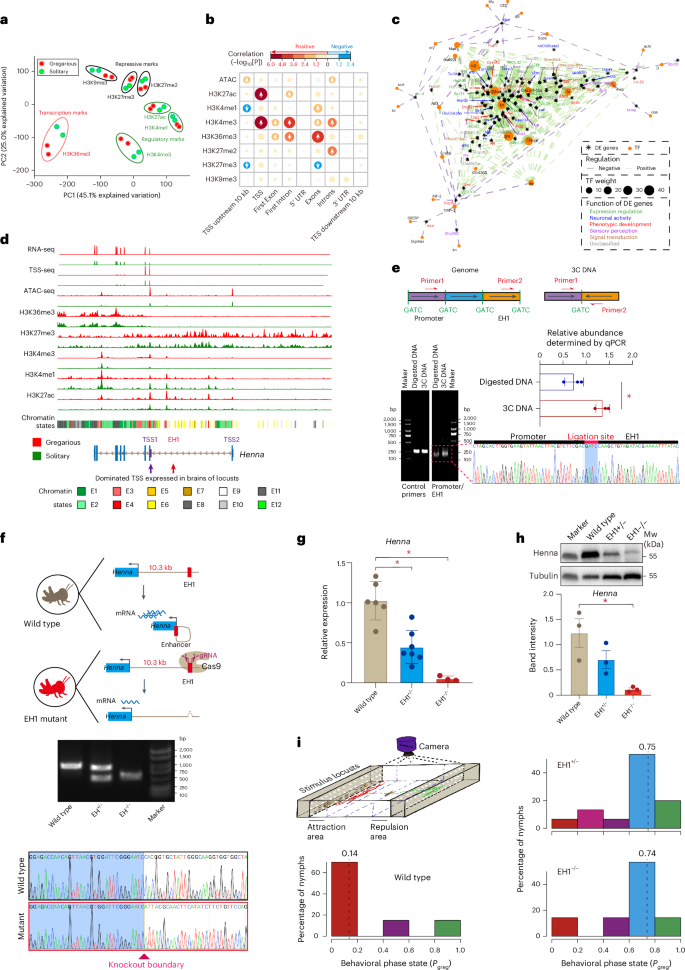
a, Principal component analysis of seven histone modifications. b, Pearson correlation analysis between chromatin signals and the phase-related gene expression of gregarious and solitary locusts. c, Association of transcription factors (TFs) with differential histone modifications near promoters. Differentially expressed (DE) genes, which were positively and negatively correlated with the differential H3K4me3/H3K27ac at promoters and the differential H3K4me1/H3K27me3 situated 10 kb upstream of the promoters, respectively, were included in this analysis. TF weight is calculated based on the frequencies of nonredundant TF binding sites. Positive and negative regulation refer to the relationships between histone modification abundance and gene expression, respectively. d, Combinatorial chromatin signals of Henna. The y axis was scaled separately for different sequencing methods. e, Quantitative 3C assays to assess the spatial interaction between EH1 and TSS1 in gregarious locusts. Control DNA represents the fragments amplified by two internal primers between two enzyme sites. Digested DNA represents random ligated genomic DNA. The ligation site represents the site where EH1 is ligated to TSS1; n = 3 independent biological replicates. Data are shown as mean ± s.e.m. P = 0.0131; *P < 0.05. f, Knockout EH1 by the CRISPR–Cas9 system in gregarious locusts. EH1+/− and EH1−/− indicate heterozygous and homozygous mutants, respectively; n = 1 independent biological replicates for demonstration purpose. g, qPCR quantification of Henna mRNA expression in wild type, heterozygous mutants and homozygous mutants. At least n = 3 independent biological replicates. Data are shown as mean ± s.e.m. P values for comparisons of wild type with EH1+/− and EH1−/− are 0.0004 and 0.0000, respectively. *P < 0.05. h, Western blot of Henna protein expression; n = 3 independent biological replicates. Data are shown as mean ± s.e.m.; P = 0.017, *P < 0.05. i, Arena behavioral assays for quantifying phase-related behavior. Independent biological replicates; n = 15 (EH1−/−), n = 7 (EH1+/−) and n = 20 (wild type). A Pgreg (probabilistic metric of gregariousness) close to 0 indicates typical gregarious behavior; P = 0.0014 for EH1−/− and P = 0.0414 for EH1+/−. UTR, untranslated region.
Because the enlargement of genome size results in the presence of long introns17, we sought to explore whether the intronic cis-regulatory elements are involved in the regulation of behavioral plasticity of locusts. We used the gene Henna as an example because we have shown previously that it is the most critical gene in determining behavioral plasticity in dopamine biosynthesis pathway2,3. The dominant TSS of Henna in brains, as identified by TSS-seq, was TSS1, whose chromatic pattern was correlated with differential RNA-seq expression between solitary and gregarious locusts (Fig. 3d). In gregarious locusts, we observed upregulated deposition of ATAC, H3K4me3 and H3K27ac in the TSS1 region, as well as H3K36me in the gene-body region. Notably, we found an enhancer, EH1, which was decorated with high H3K4me1 and low H3K4me3 signals, in the 10.3-kb intronic region upstream of the first Henna coding exon. The significantly higher interaction frequency in quantitative chromosome conformation capture (3C) DNA confirmed the close three-dimensional physical proximity between TSS1 and EH1 (Fig. 3e). The EH1-knockout mutants in gregarious locusts resulted in a significant reduction of Henna expression at mRNA and protein levels (Figs. 3f,g,h). Consequently, the EH1-knockout mutants of gregarious locusts showed a significant behavioral shift toward solitary behavioral traits in behavioral arena assays (Fig. 3i). Indeed, our previous studies have demonstrated that RNAi silencing of Henna expression induces a behavioral change from solitary to gregarious phases2. Therefore, the knockout of EH1 in gregarious locusts resulted in altered behavior—a phenotype copied by silencing Henna expression. Collectively, the enhancers located in long intron interact with promoters to regulate behavioral plasticity of locusts.
Chromatin changes of X chromosome during meiotic silencing
In the brain and leg muscles, we found a strong positive diagonal correlation between male and female gene expression on the X chromosome and autosomes (Fig. 4a), indicating a comparable expression between X chromosome and autosomes in the two sexes. Unlike autosomes, the X chromosome exhibited higher gene expression in ovaries compared to testes. So, the gene expression between the sexes is re-equilibrated in soma but not in gonads.
Fig. 4: Global interaction and chromatin change of the X chromosome during meiotic silencing.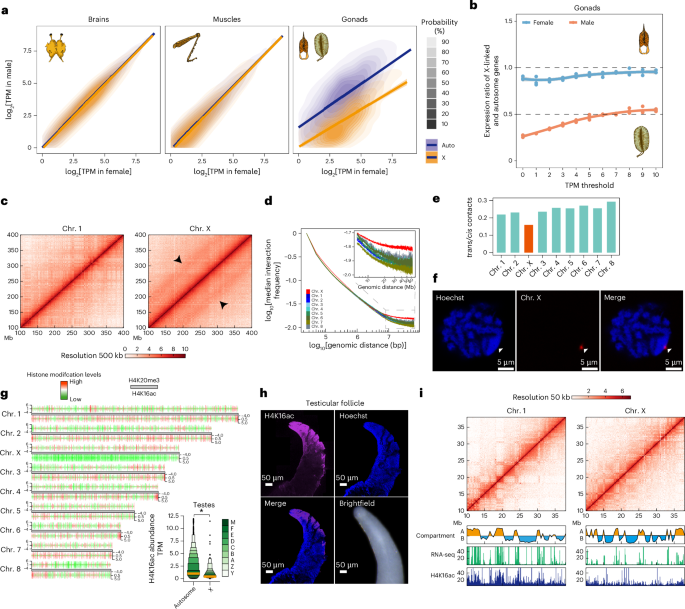
a, Correlation of gene expression in brains, leg muscles and gonads. Error bands, 95% confidence interval of the linear model fit. P values < 2.2 × 10⁻¹⁶, Pearson correlation test. b, Expression ratios between X-linked and autosomal genes in gonads under different minimum TPM cutoffs. Error bands, 95% confidence interval around the fitted smoothing curve. c, Pearson correlations of Hi-C interaction frequency matrices of chr. 1 and chr. X at 500-kb resolution. The intensity of each pixel represents the normalized frequency of interaction between a pair of genomic loci. Arrowheads indicate parallel lines along the main diagonal of the interaction map. d, A log–log plot of interaction frequency decay with distance in testes. We assumed independence between the X chromosome and the autosomes. Normalized Hi-C data binned at 25-kb scale were converted to interaction frequencies. The x axis shows the log10 genomic distance, and the y axis shows the median log10 Hi-C interaction frequency for any given genomic distance. e, Relative enrichments of trans contacts by calculating the ratio of the number of trans- over cis-mapping read pairs for each chromosome. f, Condensation of the X chromosome in a meiotic cell of spermatocytes in testes. A series of 24 DNA probes (the single-copy X-linked gene Pex5) was selected randomly. Nuclei were stained with Hoechst 33342; n = 2 independent biological replicates. The position of the X chromosome is indicated by arrowheads. g, Read abundances of H4K16ac and H4K20me3 are shown in 1-Mb bin units. P = 0.0000, *P < 0.05. h, The distribution and abundance of H4K16ac in testicular follicles of adult locusts. Nuclei were stained with Hoechst 33342 staining; n = 2 independent biological replicates. i, Association of Hi-C interaction frequency with gene expression and H4K16ac signals in chr. 1 and chr. X. The A and B compartments, determined by the first principal component (PC1), reflected the transcription and H4K16ac state on a linear genomic scale.
The X/A ratio in testes held near 0.5—a key indicator of meiotic sex chromosome inactivation (Fig. 4b). The X chromosome showed increased Hi-C signals/interaction frequencies, as evidenced by the presence of parallel lines along the main diagonal in the interaction map (Fig. 4c). The increased interaction frequencies are unique to the X chromosome and not observed in the other autosomes (Supplementary Fig. 20). The log–log plot of interaction frequencies against distance showed that the X chromosome deviated gradually from the autosomes as distance increased (Fig. 4d). Compared to autosomes, the slower interaction frequency decay in the X chromosome indicates the relatively higher interaction frequencies at long-range distances, from 10 Mb to 60 Mb. Consequently, the inactivated X chromosome is more compacted in higher-order chromatin structures, consistent with the observation that active chromatin regions tend to interact18. We quantified the pairwise chromosomal interactions within (intrachromosomal cis contacts) and between (interchromosomal trans contacts) chromosomes to measure spatial distance between the X chromosome and autosomes. As expected, the intrachromosomal cis contacts are more prevalent than the interchromosomal trans contacts (Supplementary Fig. 21). Furthermore, the interchromosomal trans contacts are less frequent, specifically on the X chromosome (Fig. 4e), indicating a more distal spatial position of the X chromosome compared to autosomes within chromosomal territories. The DNA FISH assay of a single-copy X-linked gene (Pex5) reveals that the X chromosome shows greater condensation than autosomes (Fig. 4f). These results suggests that the inactivated X chromosome is farther from the transcription-associated hubs at nuclear speckles, which are connected closely among activated autosomes19.
The global reduction of H4K16ac signals of X-linked genes in testes is in accordance with the loss of expression balance between male and female locusts, indicating chromatin suppression of gene expression on the X chromosome in male locusts (Fig. 4g). The early germ cells displayed an enrichment of H4K16ac (Fig. 4h), whereas the spermatocytes, undergoing meiotic division, exhibited a depletion of H4K16ac, corresponding to the global reduction of H4K16ac signals in X-linked genes in the testes20. The binary classification of A (active transcriptional state) and B (inactive transcriptional state) compartments showed that different H4K16ac distribution was correlated strongly with transcription activity (Fig. 4i and Supplementary Fig. 22). The number of high expressed genes in compartment A in the X chromosome (0.572 Mb−1) was lower than that in autosomes (0.915 Mb−1). These results show that the loss of expression balance of the X chromosome in testes might be correlated with interchromosomal spatial distance, compartment organization and H4K16ac depletion. Therefore, the relatively remote spatial position of the gigantic X chromosome, decorated with distinct chromatin structures, results in the formation of segregated chromosome territories compared to autosomes during meiotic silencing.
Dosage compensation of the X chromosome in soma
In brains and leg muscles, X-linked gene expression in female and male locusts was equal to that of the autosomal genes, indicating complete dosage compensation in male locusts (Fig. 5a). X chromosome expression in female locusts can be achieved through biallelic expression of both alleles or by random inactivation of one allele with hyperactivation of the other in animals21. The transcriptome analysis of heterozygosity in a female individual revealed biallelic expression of X-linked genes in female locusts (Fig. 5b). To eliminate potential influences from A-to-I RNA editing, the results, even after removing adenine sites, robustly supported the biallelic expression of X-linked genes in female soma.
Fig. 5: Balanced expression of the X chromosome in soma.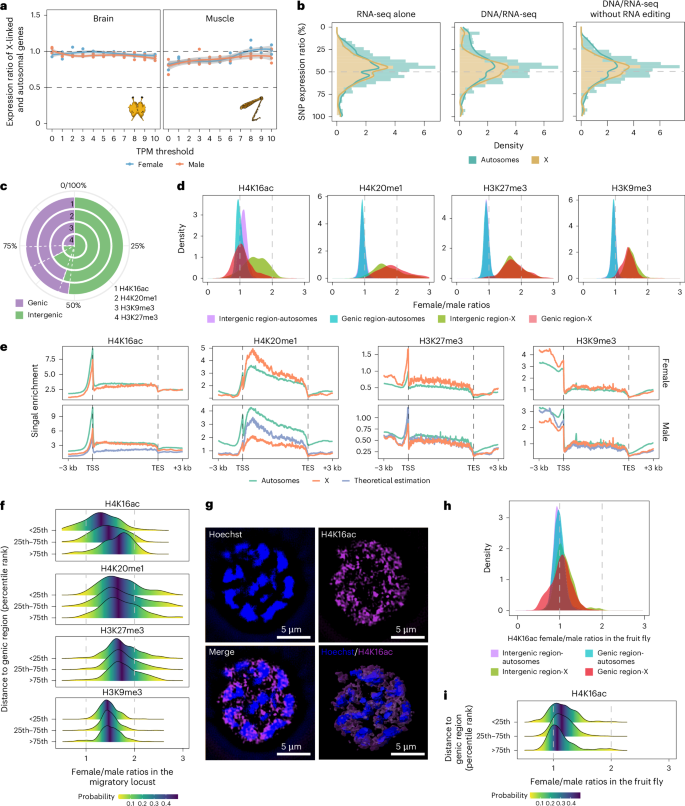
a, Expression ratios between X-linked and autosomal genes in brains and muscles under different minimum TPM cutoffs for gene inclusion. Error bands, 95% confidence interval around the fitted smoothing curve. b, Allelic X chromosome expression in a female. To ensure accurate identification of heterozygous alleles, the biallelic heterozygosity sites were determined using DNA-seq for the same individual locust that was subjected to RNA-seq. c, Genomic prevalence of the histone modifications H4K20me1, H4K16ac, H3K27me3 and H3K9me3. The genomic prevalence was determined by the average portion of the reads located in the genic and intergenic regions. d, Density distribution of the ratios (female/male) of histone modification abundances in 200-kb bins between the two sexes in brains. e, Enrichment profiles of histone modification of H4K20me1, H4K16ac, H3K27me3 and H3K9me3 across genic region. The theoretical estimation in males was inferred assuming no dosage changes in females. f, Density distribution of the ratios (female/male) of histone modification abundances between the two sexes in different genomic regions in brains of the migratory locust. The different genomic regions were classified based on the distance to the nearest genes. g, Immunofluorescence staining of H4K16ac in brains. Nuclei were stained with Hoechst 33342 staining; n = 2 independent biological replicates. h, Density distribution of the ratios (female/male) of histone modification abundances between the two sexes in the fruit fly. The average chromatin immunoprecipitation sequencing signals in 2-kb bins were compared between female and male locusts. i, Density distribution of the ratios (female/male) of histone modification abundances between the two sexes in different genomic regions in 2–4 h embryos of the fruit fly. The different genomic regions were classified based on the distance to the nearest genes.
We then profiled the genomic distributions of H4K20me1, H4K16ac, H3K27me3 and H3K9me3 to determine whether these chromatin modifications are involved with dosage compensation in locusts. H4K16ac was more prevalent in the genic region compared to H4K20me1, H3K27me3 and H3K9me3 (Fig. 5c). In autosomes, the equal genic and intergenic signals between female and male locusts for these four chromatin marks corresponded to the balanced autosomal gene expression in brains (Fig. 5d). However, within the genic region of the X chromosome, only the density of female/male enrichment ratios of H4K16ac signals centered around 1, consistent with its role in complete dosage compensation. All four histone modifications showed similar levels between autosomal and X-linked genes across genic regions in females (Fig. 5e). To account for the difference in chromosome numbers between females and males, we estimated male data (the abundance of histone modification in male brains) theoretically assuming no dosage changes in females. As expected, the H4K16ac levels were comparable between the autosomal and X-linked genes in males, aligning with the well-recognized role of H4K16ac in establishing dosage compensation in heterogametic organisms22. In fact, the enrichment levels of H4K16ac on X-linked genes in males were higher than those theoretically estimated for male data. Different from the widespread distribution of H4K16ac across the entire gene body, H4K20me1 localized mainly to the 5′ end of the gene body. However, the H4K20me1 level of X-linked genes in males was more depleted than that of the theoretically estimated male data. In fruit flies, the absence of Sex-lethal (SXL) expression in males permits MSL complex assembly, leading to H4K16ac enrichment on the X chromosome for dosage compensation23. Despite the close association between H4K20me1 and MSL complex, we found no significant differences in RNA and protein expression of SXL and MSL subunits between females and males, indicating an SXL-independent initiation of dosage compensation in locusts (Supplementary Figs. 23 and 24 and Supplementary Note 5). Overall, the depletion of H4K20me1 and the enrichment of H4K16ac suggest that they are connected functionally with maintaining balanced expression of the X chromosome in the somatic organs of male locusts.
Different from H4K20me1, H3K27me3 and H3K9me3, levels of H4K16ac decreased with the increase of the distance to the nearest gene in the intergenic region on the X chromosome (Fig. 5f), indicating a distance-dependent dosage effect of H4K16ac and partial dosage compensation. Different from the fruit fly24, we did not detect a dominant immunofluorescence signal of H4K16ac across the entire male X genome (Fig. 5g). To further confirm the uniqueness of distance-dependent H4K16ac enrichment in the large genome of locusts, we analyzed H4K16ac profiling data from the fruit fly25. In contrast to the locust genome, we observed complete dosage compensation in both genic and intergenic regions of the compact genome of the fruit fly (Fig. 5h). As expected, the distance-dependent H4K16ac enrichment was not observed on the X chromosome of the fruit fly (Fig. 5i). Therefore, the dosage effects of H4K16ac, initiated from genic region, faded gradually during subsequent spreading into intergenic regions, which constrain the spreading of dosage effects in locusts.
Dosage compensation on translocated X-linked genes
By examining the conservation of X-linked genes across insects at order level, we found that the gene configuration of the locust X chromosome is the result of extensive interchromosomal gene exchanges through drastic genome rearrangement (Supplementary Note 6 and Supplementary Figs. 25–27). To further investigate the formation of X-linked genes of the migratory locust within Orthoptera, we generated a chromosome-level genome of the desert locust (Schistocerca gregaria (SG), Caelifera, Acrididae). We determined the pairwise chromosome associations of the two locusts, the pygmy grasshopper (Zhengitettix transpicula (ZT), Caelifera, Tetrigidae) and the pygmy mole cricket (Xya riparia (XR), Caelifera, Tridactyloidea), which belongs to a basal taxon of Caelifera. The chromosomes of the migratory locust are identical to those of the desert locust but exhibit one-to-several or one-to-zero correspondence with those of the pygmy grasshopper and the pygmy mole cricket, demonstrating that genome size expansion accompanies large-scale chromosome rearrangement during the early diversification of Caelifera species (Fig. 6a and Supplementary Figs. 28–30). The X-linked genes of the migratory locust have largely persisted on the X chromosome since the emergence of Caelifera (Fig. 6b), although it cannot be concluded whether the X chromosome of the pygmy mole cricket represents the ancestral X chromosome of Caelifera or has undergone a chromosome fusion event between an autosome and a sex chromosome. To investigate the chromosomal rearrangement of X-linked gene of the migratory locust, the one-to-one orthologs among the four species were divided into the five gene categories: ancient autosome (LMaSGaXRaZTa), ancient X (LMxSGxXRxZTx), ancient AtoX (translocated from Autosomes to X chromosome before the divergence of two locust species, LMxSGxXRaZTa), ancient XtoA (LMaSGaXRxZTx) and recent AtoX (LMxSGaXRaZTa). Compared with the ancient AtoX and ancient X categories, the lower ratios of female/male in H4K20me1 signals showed insufficient depletion of H4K20me1 in the recent AtoX category. Furthermore, the recent AtoX category showed a higher ratio of female/male in H4K16ac signals than the ancient AtoX and ancient X categories (Fig. 6c). This suggests an incomplete recovery of dosage compensation of recently translocated X-linked genes in the migratory locust.
Fig. 6: Dosage compensation turnover on X-linked gene derived from autosomes.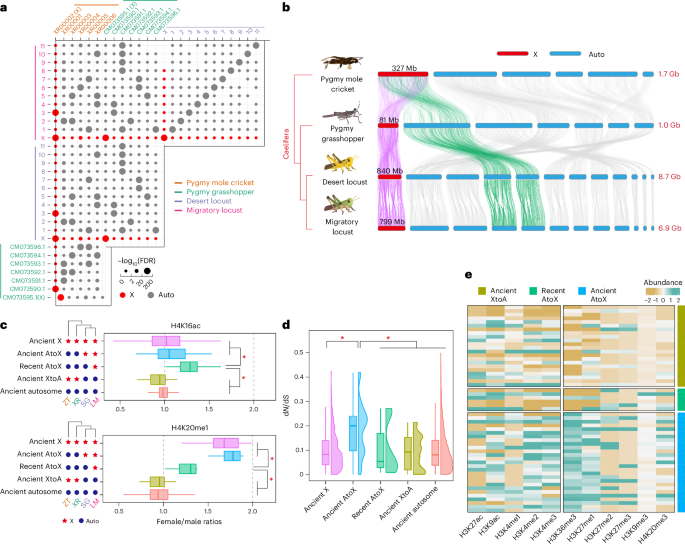
a, Pairwise dotplots showing the significance of chromosome–chromosome associations among the migratory locust, the desert locust, the pygmy grasshopper and the pygmy mole cricket. b, One-to-one ortholog linking among the chromosomes of four orthopteran species. Vertical lines connect orthologs across the four species. Only connections between chromosome pairs with significantly associations are shown. c, Ratios (female/male) of genic H4K16ac and H4K20me1 signals between the two sexes. Reads per kilobase million values were used to determine the histone modification signals. The one-to-one orthologs of the migratory locust were divided into the six gene categories: ancient autosome (LMaSGaXRaZTa, n = 4,661), ancient X (LMxSGxXRxZTx, n = 314), ancient AtoX (LMxSGxXRaZTa, n = 27), ancient XtoA (LMaSGaXRxZTx, n = 22) and recent AtoX (LMxSGaXRaZTa, n = 6); n, number of one-to-one orthologs. The recent XtoA category was not included due to the absence of any ortholog. Boxplots indicate the median (center line), the first and third quartiles (box limits), and whiskers extending to 1.5× the interquartile range. The P values for comparisons of recent AtoX with ancient X, ancient AtoX, ancient XtoA and ancient autosomes were (0.0151, 0.0011), (0.0403, 0.0017), (0.0023, 0.0017) and (0.0017, 0.0011) for H4K16ac and H4K20me1, respectively. *P < 0.05. d, dN/dS comparison in the five gene categories. dN/dS, the ratio of nonsynonymous substitutions per nonsynonymous site (dN) to synonymous substitutions per synonymous site (dS). Boxplots indicate the median (center line), the first and third quartiles (box limits), and whiskers extending to 1.5× the interquartile range. The P values for comparisons of ancient AtoX with ancient X, recent AtoX, ancient XtoA and ancient autosomes were 2 × 10⁻⁶, 0.0359, 0.0002 and 2 × 10⁻⁶, respectively; *P < 0.05. e, Heatmap showing abundance of histone modification signals for the recent AtoX, ancient XtoA and ancient AtoX categories.
Compared to the ancient X and the two autosomal categories, the ancient AtoX category, but not the recent AtoX category, had significantly higher dN/dS ratios (Fig. 6d), suggesting that adaptive evolution is more likely to have affected the ancient AtoX category. Accordingly, the ancient AtoX category displayed a broader range and higher levels of histone modification than the recent AtoX category (Fig. 6e). This implies that X-linked translocations have the potential to accumulate sequence divergence or to maintain mutations that cannot be effectively eliminated by recombination, ultimately contributing to gene function innovation over time. In the recent AtoX category, several genes, including Oat and msps, were reported previously to be associated with functions that harm males or benefit females26,27. Therefore, sexually antagonistic selection promotes the relocation of female-related genes from autosomes to X chromosome in locusts (Supplementary Note 7). Consequently, these genes can be repressed by meiotic sex chromosome inactivation, facilitating to mitigate female antagonism and to increase male fitness during spermatogenesis. Therefore, the translocated X-linked genes in the migratory locust are likely to be convergently recruited to the X chromosome and subject to relocation of dosage compensation due to the need to suppress their functional roles favoring females during spermatogenesis. Taken together, the recent AtoX category showed distinct differences in histone modification, suggesting a lag in the relocation of dosage compensation for the X-linked genes that were recently translocated autosomes in the migratory locust.