
The scope of CattleCA
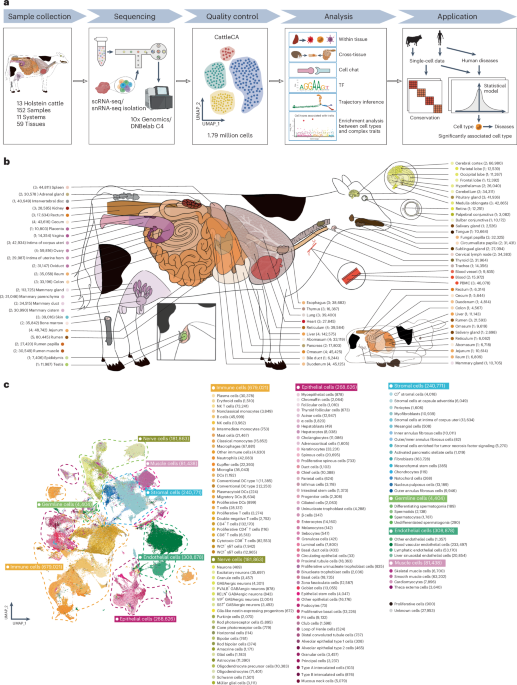
After removing low-quality cells and doublets (Methods, Supplementary Fig. 1 and Supplementary Tables 1 and 2), 1,506,438 single cells and 287,416 single nuclei (hereinafter referred to as cells) from one fetus, four calves and ten adults, including 234,802 from males and 1,559,052 from females, were used for the subsequent analyses (Supplementary Fig. 2 and Supplementary Table 3). The average numbers of expressed genes and read counts were 1,783 and 5,752, respectively, across 59 tissues (Supplementary Fig. 3). By integrating all high-quality cells in tissues using Harmony15 (Supplementary Figs. 4, 5 and 6c,d), we annotated 131 cell types based on canonical marker genes, representing seven distinct cell lineages: immune (n = 679,021), endothelial (n = 308,878), epithelial (n = 268,626), stromal (n = 240,771), nerve (n = 182,450), muscle (n = 81,438) and germline (n = 4,404) cells (Fig. 1c, Supplementary Fig. 6a and Supplementary Tables 4 and 5). These cells clustered well based on cell lineage types rather than processing methods, sequencing platforms and tissue types (Fig. 1c, and Supplementary Fig. 6b–d), with cell type abundance ranging from 33 for circulating epithelial cells to 233,497 for blood vascular endothelial cells (Fig. 1c). On average, 12 distinct cell types were identified per tissue, ranging from seven in the oviduct to 21 in the ileum (Supplementary Figs. 7 and 8, and Supplementary Table 6). Among the 131 annotated cell types, 67 were observed only in one tissue type, whereas immune, endothelial and epithelial cells were found across 58, 49 and 41 tissues, respectively (Supplementary Figs. 7 and 8, and Supplementary Table 6). For instance, blood vascular endothelial cells were ubiquitously present in 45 tissues, whereas alpha and beta cells were exclusively detected in the pancreas (Supplementary Fig. 9). Furthermore, cell cycle analysis indicated that cells from the germline lineage were predominantly enriched in the G2/M phase, reflecting their active growth and preparation for DNA replication. Conversely, epithelial, muscle, stromal and endothelial cells were primarily enriched in the G0/G1 phase, indicating a quiescent state with no active division (Supplementary Fig. 6e and Supplementary Table 7). We offer a comprehensive resource of TF and cellular communication regulation across several tissues, cell types and sexes in cattle (Extended Data Figs. 1 and 2, Supplementary Fig. 10 and Supplementary Note).
Cellular heterogeneity in mammary glands and testis
To study cellular heterogeneity in tissues, we took mammary glands as an example because of their importance in milk production. We categorized a total of 2,670 mammary epithelial cells into eight distinct clusters, including six luminal secretory cell subtypes (LumSec, ME0–5), characterized by high expression of ELF5 and LTF; a luminal hormone-responsive cell cluster (LumHR, ME6), marked by PGR and ESR1 expression; and a basal-myoepithelial cell cluster (ME7), defined by MYLK and KRT17 expression (Fig. 2a,b). These cell clusters exhibited distinct spatial distribution patterns and functional characteristics in mammary glands (Fig. 2b,c). Among luminal secretory cells, ME0–3 were strongly associated with milk biosynthesis, as indicated by high lactation scores16 (Fig. 2d and Supplementary Table 8). Genes upregulated in ME0, including HSPH1, HSPA1A and JUN, were significantly enriched in the regulation of ATP-dependent activity, heat response and DNA-templated transcription (Fig. 2b). Moreover, both ME0 and ME2 were enriched for immune-related genes (for example, PIGR, LPO and SPP1), suggesting their potential involvement in immune regulation under the stress associated with lactation17 (Fig. 2e). ME1 and ME6 were significantly associated with milk (MY), fat (FY) and protein (PY) yield, based on candidate genes identified through GWAS in 16,188 Holstein cows using scPagwas18 (Fig. 2f). LumHR cells exhibited high expression of genes encoding hormone receptors for estrogen, progesterone, prolactin and growth factors (ESR1, PGR, PRLR and GHR), suggesting their potential roles in hormonal and growth factor signaling. As a hormone-responsive epithelial cell type, ME6 might promote cell adhesion and signal transmission, ultimately supporting the overall function of the mammary gland during lactation19 (Fig. 2g–i). Furthermore, ME7 was identified as a potential responder to oxytocin, with high expression of genes involved in the oxytocin signaling pathway, including OXTR and PLCB1, coordinating contractile processes within the mammary gland for milk ejection20 (Fig. 2j). These findings provide insights into the cellular complexity of the mammary gland during lactation. Additionally, we highlight bovine spermatogenesis and the evolutionary conservation of key TFs of spermatogenesis in mammals (Supplementary Fig. 11, Extended Data Fig. 3 and Supplementary Note).
Fig. 2: Heterogeneity of mammary epithelial cells and the relationship with lactation in dairy cows.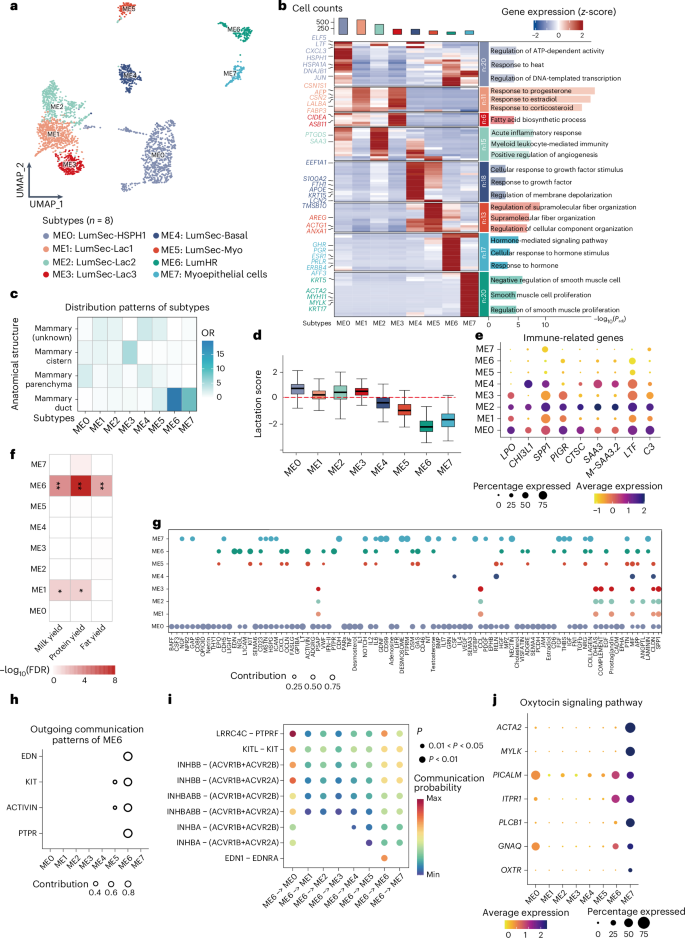
a, UMAP plot displaying the subtypes of mammary epithelial cells. b, Expression heatmap for the top 120 DEGs in eight mammary epithelial subtypes, with cell count (top), selected marker genes (left) and significantly enriched Gene Ontology (GO) terms for the clustered module (right). c, Heatmap showing the odds ratios (ORs) of mammary epithelial cell subtypes in each anatomical structure of the mammary gland. d, Box plot showing the lactation gene signature scores for the epithelial cell subtypes in the mammary gland (n = 4). The y axis represents the module score derived from genes associated with lactation-related processes; the x axis represents cell subtypes. The central band in the box plot represents the median, the box boundaries represent the 25% to 75% percentiles, and the whiskers extend 1.5 times the interquartile range (IQR). The red dashed line indicates the baseline lactation score (0). e, Expression levels of immune genes in different mammary epithelial cell subtypes. Dot size represents the expressed percentage; the color represents the average expression of genes in each subtype. f, Heatmap showing the mammary epithelial cell subtypes significantly associated with MY, FY and PY. *FDR < 0.05, **FDR < 0.01. g, Outgoing signaling pathways in mammary epithelial cell subtypes. Dot size represents the percentage contribution. h, Specific outgoing communication signaling patterns in ME6. Dot size represents the percentage contribution. i, Specific ligand–receptor pairs in ME6-specific outgoing communication pathways. Dot size represents the P significance level; dot color represents the maximum communication probability. j, Expression levels of genes in the oxytocin signaling pathway in different mammary epithelial cell subtypes. Dot size represents the expressed percentage; dot color represents the average expression of genes in each subtype.
Antigen-presenting immune cell heterogeneity
A total of 777,873 immune cells from 58 tissues (excluding the retina) were identified and annotated into 29 cell types (Fig. 3a). These immune cells were clustered according to five cell lineages (T and natural killer (NK) cells, myeloid cells, mast cells, plasma cells and neutrophils) rather than tissue types, suggesting that cells in the same lineage exhibit high transcriptional similarity (Fig. 3b). However, some immune cell types also displayed strong tissue specificity. For example, microglia in the brain formed a distinct transcriptional cluster separating from the broader myeloid lineage (Fig. 3b).
Fig. 3: Heterogeneity of immune cells across cattle tissues.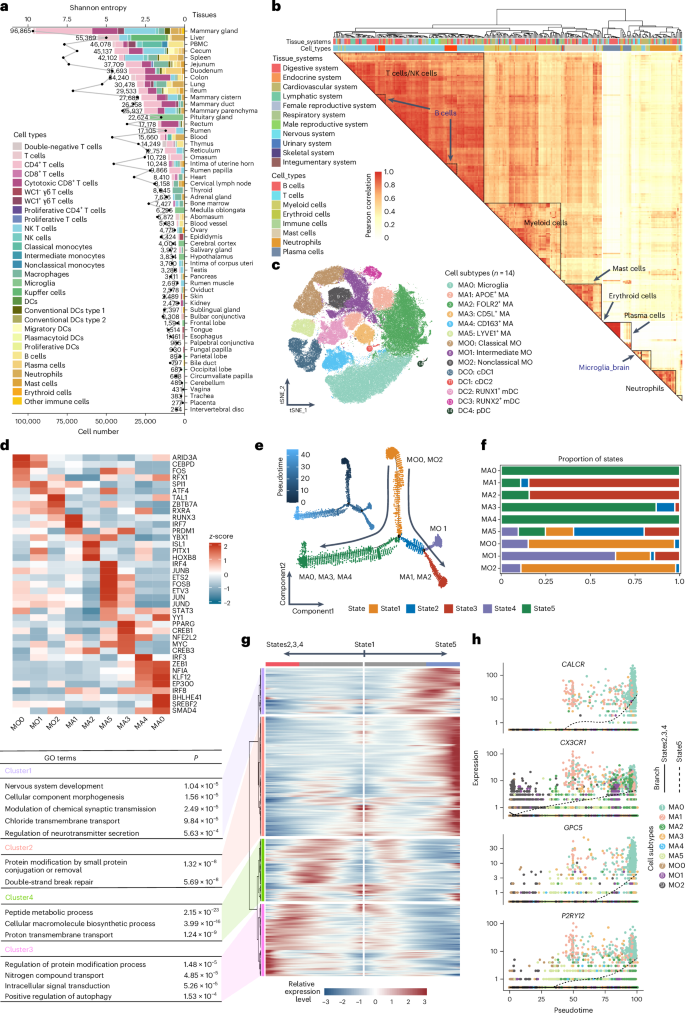
a, Bar chart displaying the number and proportion of 29 immune cell types in 58 tissues. The scatter plot represents the Shannon entropy values of immune cells in each tissue, with higher values indicating higher diversity. b, Heatmap showing the Pearson correlation of gene expression levels for each immune cell type, calculated based on the top 1,000 genes with the largest s.d. c, t-distributed stochastic neighbor embedding (t-SNE) visualization of annotated cell subtypes of myeloid cells, with cells color-coded according to subtype. d, Heatmap highlighting the average regulatory activity z-score of key TFs in 247 TFs that regulate the differentiation and maintenance of APC subtypes. e, Pseudotime trajectory analysis of monocyte and macrophage subtypes, with cell states colored on the trajectory tree. f, Statistical analysis of monocyte and macrophage subtype composition in each state. g, Heatmap showing the changes in gene expression of representative DEGs (q < 1 × 10⁻⁴) in pseudotime series, and GO enrichment analysis of DEGs reclustered into four clusters (bottom left). h, Representative pseudotime trajectory of marker genes in microglia across different states.
As antigen-presenting cells (APCs) are central to adaptive immunity by presenting antigens to lymphocytes, we focused on 169,610 myeloid cells across 44 tissues and annotated them into six macrophage subtypes (MA0–5), three monocyte subtypes (MO0–2) and five dendritic cell (DC) subtypes (DC0–4) (Fig. 3c and Extended Data Fig. 4a). A total of 135,186 macrophages were identified in 40 tissues, making them an appropriate model for exploring cellular heterogeneity across tissue microenvironments. Macrophage subtypes exhibit distinct patterns of tissue distribution, TF regulation and metabolic characteristics (Extended Data Figs. 4 and 5). IRF7 (ref. 21) and IRF8 (ref. 22) might regulate MA1, which was preferentially distributed in the intestine and might participate in sugar metabolism and fatty acid elongation, suggesting the strongest major histocompatibility complex class II antigen-presenting score (APS) among all the macrophage subtypes (Fig. 3d, Extended Data Figs. 4b–d and 5a–c and Supplementary Table 9). In contrast, MA4 in the liver showed the weakest APS (Extended Data Fig. 5c). These findings were consistent with the notion that the intestine has a high immune vigilance because of constant exposure to microbial antigens23, while the liver, a site of immune tolerance, exhibits a lower antigen-presenting activity to prevent excessive immune activation24. The pseudotime trajectory analysis revealed a separation of macrophage populations that aligns with known developmental stages in humans and mice25: one branch progresses toward an inflammatory phenotype, which is consistent with monocyte differentiation, while the other maintains markers associated with tissue-resident macrophages, which might be derived from embryonic progenitors (Fig. 3e–h). Additionally, TF analysis revealed that distinct TFs associated with monocyte recruitment and differentiation, such as SPI1 (ref. 26) and IRF7 (ref. 21), were strongly expressed in the monocyte-derived branch, whereas BHLHE41 (ref. 27) and IRF8 (ref. 22), which are responsible for tissue-resident macrophages, were more active in the other branch (Supplementary Fig. 12). We also provide insights into the heterogeneity and dynamics of B cell differentiation (Extended Data Fig. 6 and Supplementary Note).
Epithelial cells interact with immune cells in the intestine
We analyzed 278,584 epithelial cells across 41 tissues, identifying 50 subtypes (Supplementary Fig. 13a and Supplementary Table 10). Although most subtypes were tissue-specific, keratinocytes (36,114), spinous cells (22,672), basal cells (19,283) and goblet cells (GCs) (13,055) exhibited the highest cell counts and were identified in more than six tissues (Supplementary Fig. 13a). Cell types with similar biological functions were clustered together, such as chief cells, parietal cells, isthmus cells, mucous neck cells and pit cells, all of which have the function of secreting gastric protease and promoting digestion (Supplementary Fig. 13b). Additionally, three regions of the forestomach (rumen, reticulum and omasum) and six regions of the intestine (duodenum, ileum, jejunum, colon, cecum and rectum) were also clustered together (Supplementary Fig. 13c). Because of the importance of epithelial cells to the digestive system, we scrutinized 152,009 epithelial cells across 14 digestive tissues, uncovering eight cell-to-tissue modules with distinct biological functions and TF regulation (Fig. 4a). We further analyzed the cellular heterogeneity of the bovine forestomach and abomasum, provided evidence supporting the multi-origin hypothesis that the forestomach originates from the esophagus while the abomasum originates from the duodenum, and emphasized the critical role of rumen spinous cells in fatty acid absorption (Extended Data Figs. 7 and 8 and Supplementary Note).
Fig. 4: Epithelial cell heterogeneity and the interaction with immune cells.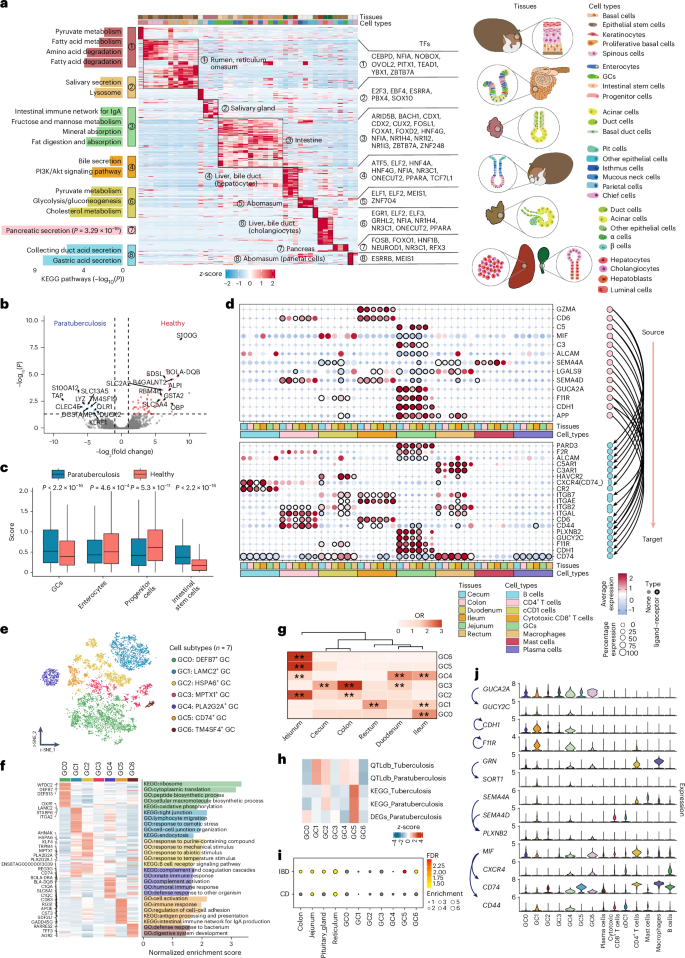
a, Expression heatmap for the top 50 upregulated DEGs in 24 epithelial cells of 15 selected gastrointestinal tissues, showing significant Kyoto Encyclopedia of Genes and Genomes (KEGG) pathways for the clustering module (left), specific TFs (middle) and corresponding tissue anatomical structures and cellular composition (right). b, Volcano plot illustrating the DEGs between paratuberculosis-seropositive and healthy cattle. DEGs were identified based on FDR < 0.05 and log2(fold change) > 1 using edgeR’s two-sided exactTest. c, Box plot showing the module scores of 17 disease-associated and 56 health-associated upregulated genes in epithelial cells of the intestine (n = 5), calculated using the AddModuleScore of Seurat. The central band in the box plot represents the median, the box boundaries represent the 25% to 75% percentiles, and the whiskers extend 1.5 times the IQR. A two-sided Wilcoxon rank-sum test was used. d, Bubble plot showing ligand–receptor pairs between GCs and immune cells, which were shared in at least four intestinal segments. e, t-SNE visualization of seven GC subtypes. Cells are color-coded according to cell subtype. f, Heatmap showing the top 20 upregulated DEGs and their markers for each GC subtype. The bar chart displays their GO terms and KEGG pathways using single-sample gene set enrichment analysis (GSEA). g, Heatmap representing the tissue distribution of GC subtypes; ORs were calculated and used to indicate preferences. **OR > 1.5 and FDR < 0.01. h, Heatmap displaying the signature scores of tuberculosis and paratuberculosis candidate genes from the Animal Quantitative Trait Loci (QTL) and KEGG databases across GC subtypes. i, Scatter plot highlighting tissues and GC subtypes associated with human IBD and CD using GWAS enrichment analysis with LDSC. j, Violin plot representing the expression of key ligand–receptor genes in GC subtypes and immune cells.
Bovine paratuberculosis, a chronic and severe enteritis, causes notable economic losses to the cattle industry annually28. To study the complex dynamics between intestinal epithelial and immune cells during disease progression, we analyzed transcriptomic data from five paratuberculosis-seropositive cattle and three healthy controls29 (Fig. 4b) and found that 17 upregulated DEGs in the diseased group exhibited significantly higher signature scores in GCs, suggesting a key role of GCs in the progression of intestinal inflammation (Fig. 4c). We observed significant ligand–receptor pairs shared between GCs and immune cells across six different intestinal segments (Fig. 4d and Supplementary Table 11). For instance, GCs communicate internally through the GUCA2A–GUCY2C ligand–receptor pair and interact with immune cells through pathways such as APP–CD74 and MIF–CD74_CXCR4. Furthermore, we classified GCs into seven subtypes (GC0–6), each with distinct biological functions and tissue distribution patterns (Fig. 4e–g). For instance, GC1, primarily found in the ileum and rectum, might participate in tight junctions, while GC5, located in the jejunum, might be involved in immune responses. Additionally, we found that the marker genes of GC5 were significantly overrepresented in 529 genes associated with tuberculosis and paratuberculosis (Fig. 4h and Supplementary Table 12). Using one-to-one orthologous genes between cattle and humans, we observed that the heritability of human inflammatory bowel disease (IBD) and Crohn’s disease (CD) was significantly enriched in genes with specific expression in the jejunum and reticulum, particularly in GC5 (Fig. 4i). Cellular communication analysis showed that GC5 exhibited a dysregulation in certain communication pathways, such as the CDH, JAM, GRN, MIF and SEMA4 signaling pathway (Supplementary Fig. 14 and Supplementary Table 13). Dysregulation of adhesion molecules like CDH1 (ref. 30) and F11R31 in GC5 might contribute to epithelial shedding and increased intestinal permeability, while upregulation of antigen-presenting genes like CD74 might promote antigen recognition and presentation32, which might collectively influence the progression of intestinal inflammation (Fig. 4j). These findings provide supportive evidence for the potential communication between GCs and immune cells.
The potential role of hepatocytes in milk production
As the liver has a crucial role in energy metabolism during lactation in dairy cows33, we annotated a total of 18,205 hepatocytes from the liver and bile duct into ten subtypes (HPE0–9; Fig. 5a,b). These subtypes aligned well with known liver architecture in both cattle and other animals like humans and mice34. The observed spatial distribution of hepatocyte subtypes along the pericentral to the periportal axis was consistent with well-established liver zonation principles (Fig. 5c), where hepatocytes in different zones exhibit distinct metabolic functions (Fig. 5d). For example, enrichment of mammalian target of rapamycin signaling, ABC transporters and bile acid biosynthesis pathways in HPE0–3 corresponded to the known pericentral zone, which might be responsible for drug metabolism and bile acid synthesis. Similarly, HPE4–6 might be involved in fatty acid metabolism, glycolysis and gluconeogenesis, which was in line with the metabolic functions typically associated with the interzonal and periportal regions. Furthermore, enrichment of lactation-related genes in HPE4–7 suggested species-specific adaptations in dairy cattle and the liver’s important role in supporting high metabolic demands for milk production (Fig. 5e). In addition, HPE2 was significantly enriched in GO terms related to gastrulation, digestive system development and regionalization, suggesting its potential role in developmental stemness and as the main source of new hepatocytes in steady-state tissue renewal35 (Fig. 5f). We further observed the activation of key genes involved in lipid localization, lipid transport, protein hydrolysis regulation and immune response throughout hepatocyte development (Fig. 5g,h). Cattle hepatocytes showed pronounced enrichment in tryptophan metabolism, fatty acid metabolism and peroxisome proliferator-activated receptor (PPAR) signaling pathways, compared to those of humans, underscoring their specialized role in lactation (Fig. 5i,j).
Fig. 5: Heterogeneity of hepatocytes and its role in lactation.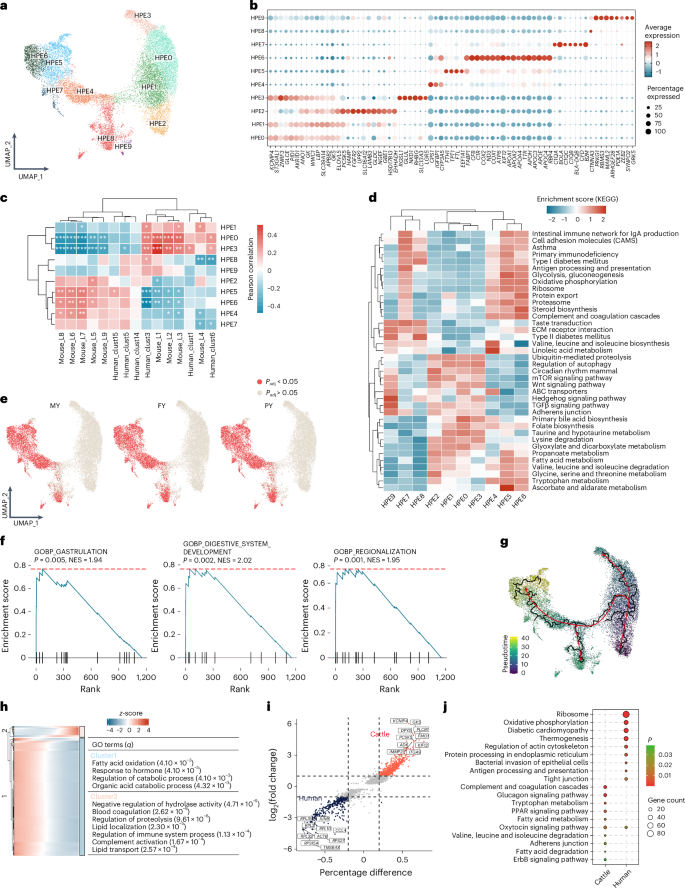
a, UMAP plot of ten hepatocytes subtypes (HPE0–9), with cells color-coded according to subtype. b, Bubble plot displaying the standardized expression of the marker genes of each cell subtype. c, Pearson correlation of hepatocyte subtypes between cattle, humans and mice, calculated based on 92 spatial localization marker genes in human and mouse hepatocytes. A two-sided Wilcoxon rank-sum test was used. *Padj < 0.05, **Padj < 0.01, ***Padj < 0.001. d, Heatmap showing the GO terms and KEGG pathways of upregulated DEGs from each hepatocyte subtype using single-sample gene set variation analysis. e, UMAP plot displaying key cell types identified using GWAS enrichment analysis with scPagwas, integrating GWAS data with MY, FY and PY. The P value was calculated using a two-sided hypergeometric test, adjusted using multiple comparisons (FDR). f, GSEA of GO terms was performed using the fgsea package. Genes were ranked according to the log2(fold change) of DEGs in HPE2; a one-sided permutation test with 10,000 iterations was used to calculate the P values. g, UMAP plot depicting the developmental trajectory of hepatocyte subtypes over a pseudotime series. h, Heatmap showing the changes in gene expression of representative DEGs (q < 1 × 10⁻⁴) in the pseudotime series, and GO enrichment analysis of DEGs reclustered into two clusters (bottom left). i, Volcano plot illustrating the DEGs between cattle and human hepatocytes. j, GO terms of DEGs between cattle and human hepatocytes. The P value was calculated using a one-sided hypergeometric test and adjusted for multiple comparisons (FDR). ECM, extracellular matrix; NES, normalized enrichment score; TGFβ, transforming growth factor beta.
Cellular basis and mechanisms underlying monogenic disorders
To explore whether CattleCA could serve as a powerful resource for the dissection of the cellular basis and mechanisms underlying monogenic conditions in cattle, we compiled 183 causal genes associated with 145 bovine disorders from the Online Mendelian Inheritance in Animals database36 and divided them into ten trait domains based on their phenotypic manifestations (Supplementary Table 14). We detected 2,677 cell-type-specific genes (z-score > 0.75) across 129 distinct cell types (excluding PVALB+ GABAergic neurons and proliferative cells) (Fig. 6a). Our enrichment analysis revealed significant overlaps between cell-lineage-specific genes and the causal genes of disorders. For instance, muscle-cell-specific genes were significantly enriched with muscle disorder genes (false discovery rate (FDR) < 0.05), germline cells with reproduction disorders and epithelial cells with skin disorders (Fig. 6b).
Fig. 6: Monogenic disorders related to cell types.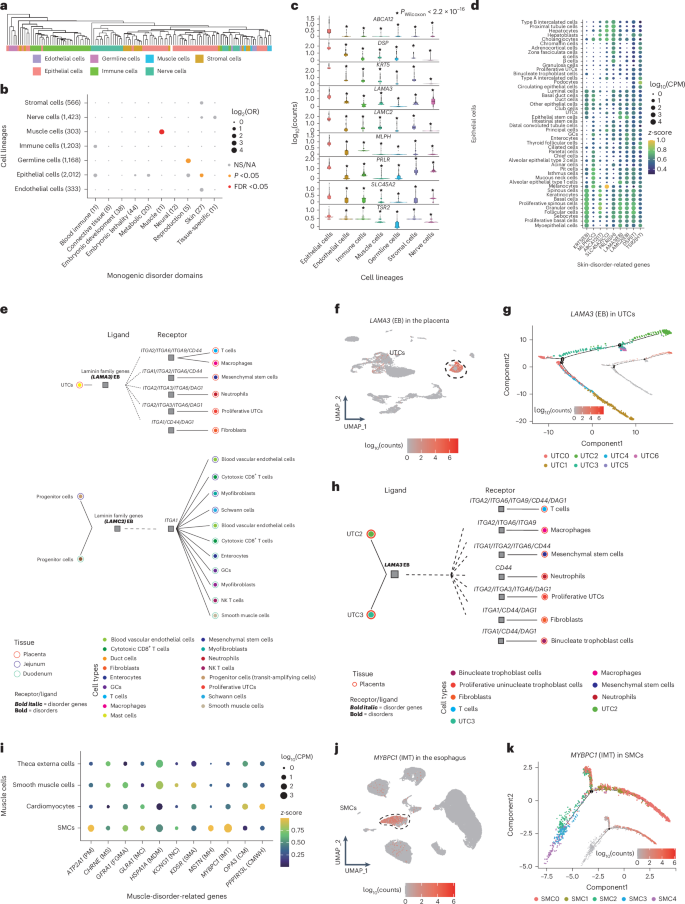
a, Cell type correlation based on the expression levels of highly expressed genes (z-score > 0.75) specific to each of the 129 cell types using Euclidean distance. b, Correlations between seven cell lineages and ten disorder domains. Dot size represents log2(OR) values; the color represents the significant levels of a two-sided Fisher’s test. c, Expression level of nine epithelium-specific skin disorder genes in different cell lineages. The star above the violin represents a significant expression difference between this cell lineage and epithelial cells based on a two-sided Wilcoxon rank-sum test. The central band in the box plot represents the median, the box boundaries represent the 25% to 75% percentiles, and the whiskers extend 1.5 times the IQR. d, Expression levels of nine epithelium-specific skin disorder genes in different epithelial cell types. Dot size represents log10 counts per million (CPM) values and the color represents the z-score of genes in each cell type. e, Putative cellular communication between epithelial cells and other cell types implicating skin disorder genes. Cell types (inner color) in different tissues (outer color) are connected by putative interactions (dotted lines) between a ligand (left square) expressed in one epithelial cell and a receptor (right square) expressed in the other cell types. Bold italic indicates a skin-disorder-related gene. f, The expression distribution of LAMA3 in the placenta primarily occurs in UTCs; it is associated with the skin disorder EB. g, Reclustering and trajectory analysis of UTCs in the placenta. The distribution of LAMA3 expression (log10(CPM)) in different cell subtypes through the trajectory line is shown. h, Putative cellular communication between UTC subtypes and other cell types in the placenta. i, Expression levels of muscle disorder genes in different muscle cell types. j, Expression distribution of MYBPC1 in the esophagus. k, Reclustering and trajectory analysis of SMCs in the esophagus. The distribution of MYBPC1 expression (log10(CPM)) in different cell subtypes through the trajectory line is shown.
Nine of 27 genes related to skin disorders exhibited significantly higher expression in epithelial cells compared to other cell lineages (Fig. 6c,d and Extended Data Fig. 9a). To explore the cell–cell interaction of nine epithelium specifically expressed disease genes, we performed cellular communication analysis, identifying laminin, encoded by LAMA3 and LAMC2, as a key ligand in uninucleate trophoblast cells (UTCs) (found in the placenta) and progenitor cells (present in the jejunum and duodenum), respectively (Fig. 6e and Supplementary Fig. 15). LAMA3 showed high expression in placental UTCs, while LAMC2 exhibited elevated expression in intestinal progenitor cells (Fig. 6f and Extended Data Fig. 9b). LAMA3 and LAMC2 have crucial roles in regulating skin strength and resiliency37, with mutations disrupting laminin assembly and leading to epidermolysis bullosa (EB) in cattle38. A previous study also reported that laminin deficiency can affect trophoblast differentiation and embryonic development39. Trajectory analysis of UTCs revealed specific expression of LAMA3 toward the end of UTC differentiation (Fig. 6g and Extended Data Fig. 9c). Furthermore, we annotated UTCs into seven subtypes (UTC0–6; Extended Data Fig. 9d). Among them, LAMA3 was predominantly expressed in UTC2 and UTC3 (Fig. 6g and Extended Data Fig. 9c). Notably, UTC2 and UTC3, in which LAMA3 has an important role as a ligand-encoding gene, exhibited stronger cellular communication with other cell types in the placenta compared to other five subtypes, indicating a potential correlation between EB and UTC2/UTC3 (Fig. 6h, Supplementary Fig. 16 and Extended Data Fig. 9e). Furthermore, the marker genes of UTC2 and UTC3 were significantly enriched in several membrane pathways, including the basement membrane, the sarcolemma and the apical plasma membrane (Extended Data Fig. 9f). These pathways regulate cell–cell adhesion and affect the structure and stability of the basement membrane zone, which is the key pathogenic mechanism underlying EB40. In addition, LAMA3, positioned within these pathways, provides a compelling hypothesis that LAMA3, by participating in membrane function as a ligand-encoding gene in UTC2 and UTC3, may potentially contribute to EB in cattle (Supplementary Table 15). Furthermore, we observed the specific cellular gene expression patterns for muscle, reproduction and blood/immune disorders (Fig. 6i–k, Supplementary Fig. 17 and Supplementary Note).
Cellular basis and mechanisms underlying complex traits
To explore whether CattleCA could contribute to unraveling some of the cellular basis and mechanisms underlying complex traits in cattle, we collected GWAS summary statistics for 55 complex traits, representing milk production (n = 30), male fertility (n = 5), coat color (n = 6), IgG (n = 10), body conformation (n = 3) and health traits (n = 1). To prioritize the cell types involved in these complex traits, we conducted a trait–cell type enrichment analysis using scPagwas18 and revealed certain associations between cell lineages and complex traits. For instance, nerve cells were associated with milk production and germline cells with sperm traits (Fig. 7a and Supplementary Fig. 18).
Fig. 7: Enrichment between cell types and complex traits.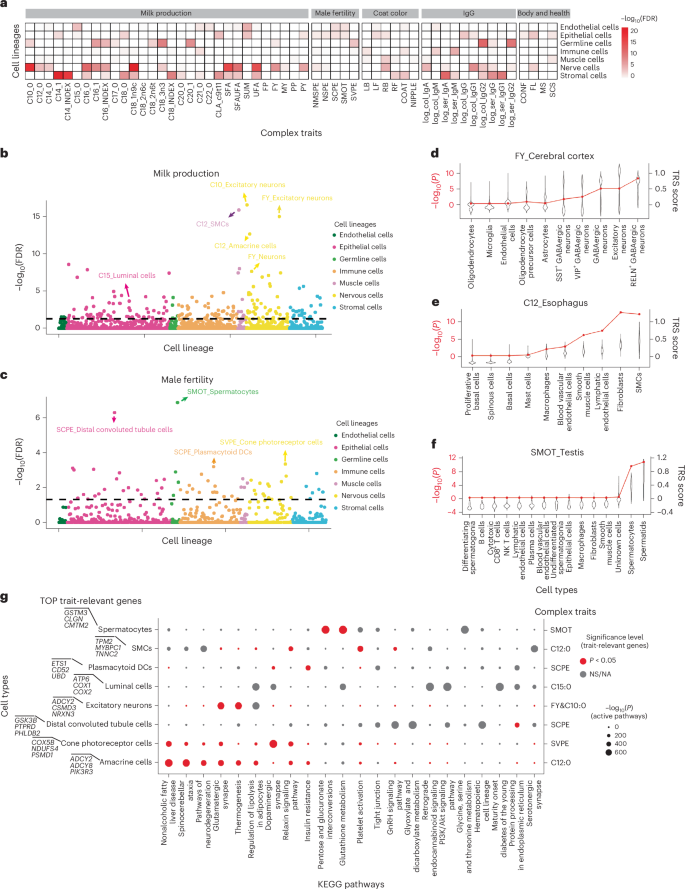
a, Correlations between cell lineages and complex traits. The heatmap represents the significant level of each cell lineage with traits. Top, The gray squares represent trait groups. b,c, Correlations between milk production (b) and male fertility (c) traits and cell types. Each circle represents a cell type–trait association. The x axis represents cell lineages sorted alphabetically. d–f, Correlation between cell types and traits in tissues. d, Cerebral cortex. e, Esophagus. f, Testis. The violin plot presents the TRS for each cell type with the corresponding trait. The red line represents the significance level (−log10(P)) for each cell type with the corresponding trait under a two-sided hypergeometric test. g, Active KEGG pathways in the top significant trait-relevant cell types. Dot size represents the significance level (−log10(P)) of pathway activity; the dot color represents the significance level (FDR) after multiple comparisons of the enrichment between active pathway genes and top trait-relevant genes in the given cell type.
For milk production traits, the most significantly associated cell types were neurons. Excitatory neurons, specifically, exhibited significant associations with milk FY (P = 8.25 × 10⁻¹⁹) and capric acid (C10:0; P = 1.51 × 10⁻²⁰), alongside amacrine cells displaying associations with lauric acid (C12:0; P = 4.3 × 10⁻¹⁶; Fig. 7b). This finding is consistent with our previous observation at the bulk tissue level in cattle, where a strong association between neurobiology and milk production traits was noted41, and aligns with previous research in humans suggesting reciprocal regulation between neuronal activity and lipid metabolism42. Additionally, we observed that excitatory neurons in the cerebral cortex and amacrine cells in the retina exhibited significant associations and high trait-relevant scores (TRS) for FY (P = 8.87 × 10⁻⁶), C10:0 (P = 8.75 × 10⁻⁶) and C12:0 (P = 1.59 × 10⁻²) compared to other cell types, underscoring the important roles of these two tissues in regulating milk fat content (Fig. 7d and Supplementary Fig. 19a–d). Furthermore, skeletal muscle cells (SMCs) showed a significant association with C12:0 (P = 9.14 × 10⁻²⁰; Fig. 7b), which is consistent with their pivotal role in fatty acid use and intracellular fatty acid homeostasis43. Further analysis revealed that SMCs in the esophagus (P = 6.89 × 10⁻¹³) and tongue (P = 1.03 × 10⁻¹²) showed significant associations with C12:0, indicating a prominent role for these two tissues in fatty acid regulation (Fig. 7e and Supplementary Fig. 19c). According to the pathway activity analysis conducted with scPagwas, neuronal-excitement-related and lipolysis-related pathways, like thermogenesis (P = 1.15 × 10−198), regulation of lipolysis in adipocytes (P = 2.07 × 10−207) and glutamatergic synapse (P = 2×10−197) had significant activity in excitatory neurons, amacrine cells and SMCs, respectively; the genes in these pathways had significant enrichment with fatty acid trait-relevant genes (Fig. 7g and Supplementary Fig. 19f). In addition, we observed that luminal cells, closely related to lactation and milk production traits16, exhibited a particularly significant association with the production of pentadecanoic acid (C15:0) (Fig. 7b), along with active involvement in pathways regulating lipolysis in adipocytes (P = 2.11 × 10−218), PI3K/Akt (P = 1.73 × 10−292) and retrograde endocannabinoid signaling pathways (P = 3.2 × 10−286) (Fig. 7g).
For male fertility traits, the most significant association was observed between sperm motility (SMOT) and spermatocytes across 129 cell types (P = 1.11 × 10⁻⁷; Fig. 7c). Spermatocytes undergo a complex process of differentiation after meiosis, ultimately maturing into spermatids. This is a crucial step that directly affects the quality of sperm produced44. This finding was further reinforced by the significant association observed between spermatocytes in the testis and SMOT (P = 2.83 × 10⁻¹⁰) within the testis tissue level, with the function of active pathways in spermatocytes primarily focused on nutrient metabolism (Fig. 7f,g). These pathways also had significant enrichment with SMOT-relevant genes of spermatocytes, indicating their potential association with sperm production and maturation (Fig. 7g). Additionally, plasmacytoid DCs derived from peripheral blood mononuclear cells (PBMCs) were significantly associated with semen concentration per ejaculate trait (P = 2.06 × 10⁻⁵ in the global atlas; P = 7.31 × 10⁻⁴ in PBMCs; Fig. 7c and Supplementary Fig. 19e), which is consistent with our previous findings regarding the involvement of immune cells in male fertility traits41. This aligns with reports in humans indicating a significant association between DC abundance and sperm quality, suggesting a potential contribution of DC-mediated immune responses suboptimal to male fertility or infertility45. Pathway analysis revealed significant activity in distal convoluted tubule cells predominantly involving the regulation of the hypothalamic gonadotropin-releasing hormone (GnRH) signaling pathway (P = 8.83 × 10−250; Fig. 7g). Furthermore, signal transduction pathways, like the dopaminergic synapse, had significant activity in cone photoreceptor cells (P = 5.59 × 10−265; Fig. 7g). Additionally, the cell types most associated with coat color were type B intercalated cells, luminal cells and amacrine cells; for IgG levels, they were type B intercalated cells, CD8+ T cells and SMCs; and for body and health, they were chondrocytes, epithelial stem cells and amacrine cells (Extended Data Fig. 10). In summary, the association of specific cell types with complex traits provides a cellular perspective for pinpointing the genetic regulatory mechanisms underlying important cattle traits.
Comparison of cross-species cell transcriptome similarity
We analyzed the public single-cell transcriptome datasets from 30 human tissues (Supplementary Table 16) and found considerable conservation at cellular expression, TF regulation and communication between cattle and humans, offering insights into cross-species similarities (Fig. 8a–g, Supplementary Figs. 20–24 and Supplementary Note).
Fig. 8: Cross-species comparisons and disease associations.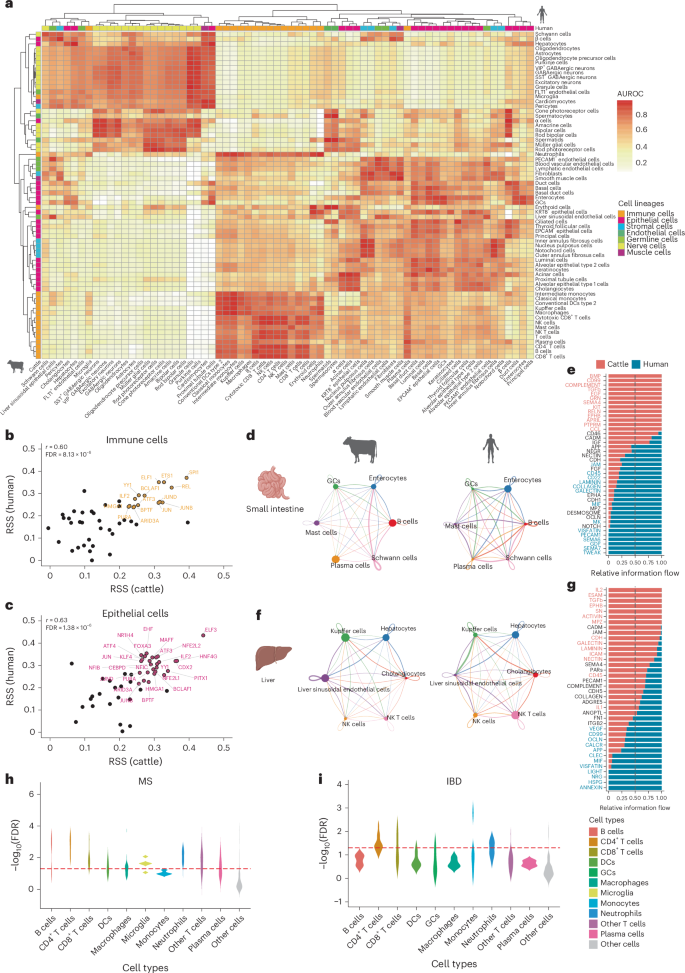
a, MetaNeighbor area under the receiver operating characteristic (AUROC) values calculated using shared genes of the same cell types in cattle and humans. b,c, Regulon specificity score (RSS) of TFs in immune (b) and epithelial (c) cells. The scatter plot represents TFs that were identified in both cattle and humans; the x axis shows the RSS of each TF in cattle and the y axis shows the RSS in humans. Representative TFs were considered significant (RSS > 0.25) and are color-labeled. The r represents the Pearson correlation coefficient (PCC) measuring the linear association of RSS values between the two species. The corresponding P value was calculated based on a two-sided t-test and adjusted for multiple comparisons (FDR). d–g, Cellular communication in the small intestine (d,e) and liver (f,g) between cattle and humans. The network diagram shows the analysis of cellular communication between cattle and humans; the column stacking diagram represents the proportion of the two species in the signaling pathway. Red represents pathways significantly upregulated in cattle, while blue represents pathways significantly upregulated in humans; black represents pathways that are not significant in either cattle or humans. h,i, Heritability enrichment of cell types for orthologous marker genes with MS (h) and IBD (i). The y axis represents the significance level (−log10(P)) of heritability enrichment and the x axis represents all cell types identified in the corresponding cattle tissue. P values were derived from the heritability enrichment analysis and adjusted for multiple comparisons (FDR). The red dashed line represents the significance threshold of FDR = 0.05. The figure was created with BioRender.com.
To explore whether the CattleCA resource can contribute to the explanation of genetic and cellular mechanisms underlying complex human traits and diseases, we analyzed the heritability enrichment of 43 human traits and diseases using linkage disequilibrium score regression (LDSC) on the orthologous marker genes across 49 cattle tissues. Significant enrichment of heritability for human complex traits and diseases was found in corresponding tissues in cattle (Supplementary Fig. 25a). For instance, the orthologous marker genes in cattle jejunum, colon and reticulum showed significant enrichment of heritability for human IBD and celiac disease, while markers in the blood, cecum, ileum and pituitary gland showed enrichment for multiple sclerosis (MS) (FDR < 0.05).
We analyzed four diseases—MS, IBD, rheumatoid arthritis (RA) and celiac disease—because of their significant heritability enrichment and the potential links in their mechanisms of onset and progression in humans and cattle46. We calculated the heritability enrichment for these conditions across seven tissues by extending the categories of orthologous marker genes to cell types. Remarkably, certain cell types showed significant heritability enrichments, enhancing our understanding of their genetic and molecular basis. For instance, CD4+ T cells exhibited substantial heritability enrichment for MS and RA, while CD8+ T cells showed enrichment for CD and IBD (Fig. 8h,i and Supplementary Fig. 25b,c). Moreover, several cell types displayed significant heritability enrichments for diseases that have not been extensively studied. For example, microglia in the pituitary gland showed significant enrichment for MS (Fig. 8h), while differentially expressed genes (DEGs) in pituitary microglia were enriched in glycerophospholipid and ether lipid metabolism (Extended Data Fig. 4d), suggesting that alterations in lipid metabolism pathways in microglia may contribute to the pathogenesis of MS47. Additionally, GCs in the colon were significantly enriched for IBD (Fig. 8i) and had strong communication with immune cells (Fig. 4d,h–j), suggesting their potential protective roles in the intestinal epithelial barrier.