
Processed datasets
Public datasets were collected and analyzed independently. We utilized DNAm arrays from the Illumina EPIC platform, including GSE135063, GSE272137, GSE213478, GSE151407, and CPTAC [5, 6, 14,15,16]. Instead of processing the original signal intensities, we directly downloaded the β ratio matrix and examined the processing pipelines. The main objectives were: (1) to obtain consensus features before and after metabolic surgery; (2) to evaluate features and generate weights; and (3) to apply generalized signatures to cancer.
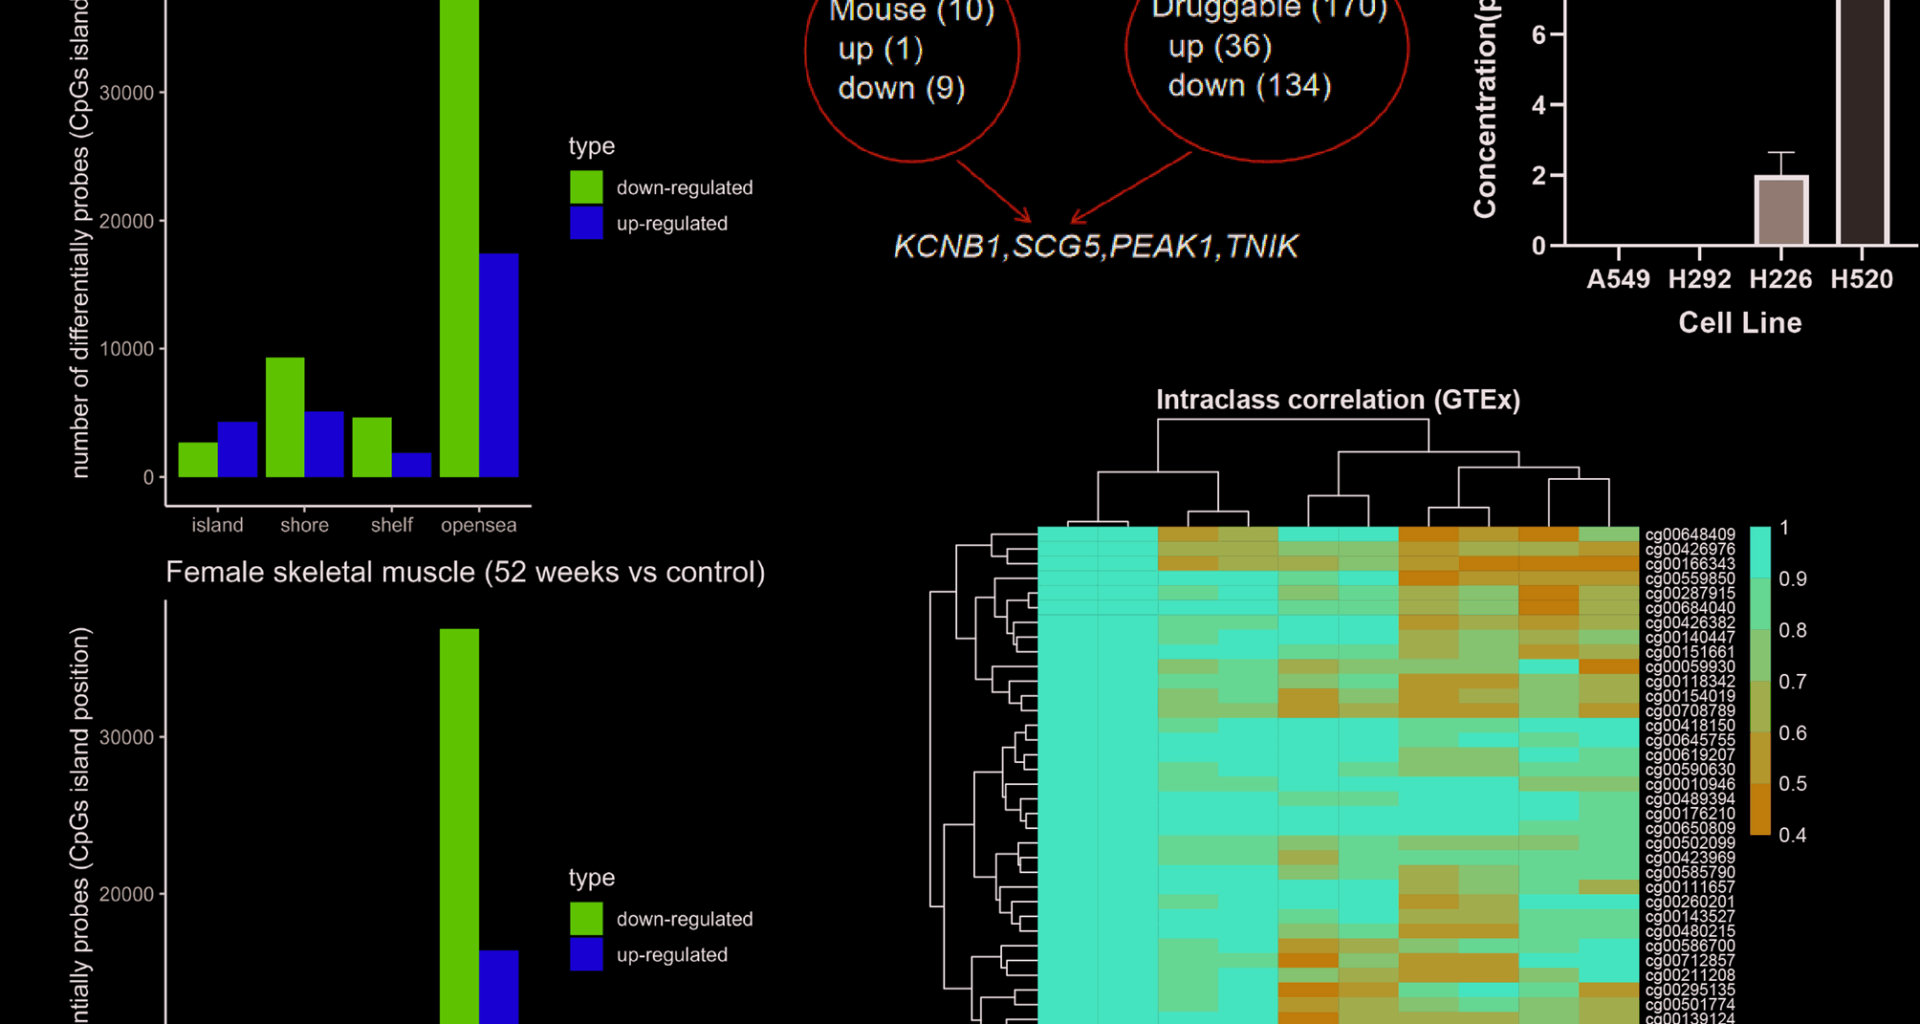
The training data included paired samples from GSE135063 (n = 32) and GSE272137 (n = 26), encompassing both genders and collected before and after bariatric surgery. Note that the samples in this study remained obese at 52 weeks postoperatively and were all of white European descent. Further probe evaluation was conducted using GSE213478 (n = 650) and GSE151407 (n = 6). We excluded genital organs, retaining breast, colon, kidney, lung, skeletal muscle, and whole blood samples in GSE213478. For GSE151407, six samples including control and duplicate were used.
Quantification was performed using the β value, which ranges between 0 and 1. It was calculated as “M/(U + M),” where M represents the methylated signal, and U represents the unmethylated signal. Samples with more than 80% missing data will be excluded, and missing values will be imputed using the nearest neighbors method. We utilized the R package CHAMP (version 2.28.0) for probe annotation and subsequent analysis [17]. Probe categories included “1st Exon,” “TSS200,” “TSS1500,” “body,” “UTR,” or “IGR.” Meanwhile, probes could also be annotated as “island,” “shore,” “shelf,” or “open sea” using the UCSC browser as a reference. For differential analysis of DNAm sites, we utilized M-value transformation, defined as the log2 ratio of methylated probe intensity to unmethylated probe intensity:
$$\:\left(\text{M}=\text{l}\text{o}\text{g}2\frac{{\upbeta\:}}{1-{\upbeta\:}}\right)$$
CPTAC source files and usage
To meet the need for DNAm data in adjacent normal tissues, five items including lung squamous carcinoma (LSCC), lung adenocarcinoma (LUAD), head and neck squamous carcinoma (HNSCC), clear cell renal cell carcinoma (ccRCC) and pancreatic ductal adenocarcinoma (PDAC) were considered in this study. The following files were downloaded from CPTAC Pan-Cancer Data (https://pdc.cancer.gov/pdc/cptac-pancancer): “methylation array – Methylation_WashU_v1”, “mutation data – Mutation_BCM_v1”, “CNV data – CNV_WGS_WashU_v1”, “clinical and other characteristics – Clinical_meta_data_v1”.
In terms of clinical data, our focus was on body mass index (BMI), age, tumor mutation burden (TMB), and chromosome instability (CIN) score. The CIN score encapsulates the aggregate impact of copy number variations across all chromosomes [18]. Chromosome calling fragments using genome-wide data from the BIC-seq2 pipeline, with the final total score summed across chromosomes. Additionally, mutations were somatic variants, and could be depicted using the file “Mutation_Broad_WashU_union_v1.”
Consulted mouse phenotypic and druggable genome resources
The downstream analysis of DNAm probes was gene-centric, involving a total of 600s coding genes. We searched for one-to-one human homologs in mouse, specifically designating the C57BL strain. For mouse knockout phenotypes, we focused on the “growth/size/body region phenotype” (MP:0005378) and “adipose tissue phenotype” (MP:0005375) semantics [19]. As previously described, dysregulation of skeletal muscle and adipose tissues may lead to cancer cachexia [1]. Parameters measured included “Body length,” “Fat/Body weight,” “Fat mass,” “Lean mass,” “Lean/Body weight,” and “Weight.” Genes that showed discordant phenotypes, such as increased fat but decreased lean body mass, were excluded. For this, we emphasize that it is a simplified screening, given that opposite effects can occur in different tissues. Only concordant genes were considered, and the same criteria were applied to the probe filter. Druggability was referenced by Jiang et al., who reported that the majority of recurrent mutations had been targeted by small-molecules or approved drugs [20].
Correlation and consistency evaluation
Intra-class correlation coefficients were used to reflect the clustering of variables within groups. For two variables in the same group, inter-class correlation was applied, while consistency for univariate data was measured by the change rate. The intra-class correlation was calculated through the random-effects analysis of variance, as described by Cao et al. [21]. Spearman’s inter-class correlation is more applicable to nonnormal data [22]. Consistency assumes that the control and replicate values are identical. The change rate was calculated as the ratio of the absolute difference to the base value, which was derived from the control or replicate. The formula is as follows:
$$\:\text{c}\text{h}\text{a}\text{n}\text{g}\text{e}\:\text{r}\text{a}\text{t}\text{e}=\left(\frac{\left|{{\upbeta\:}}_{\text{c}\text{o}\text{n}\text{t}\text{r}\text{o}\text{l}}-{{\upbeta\:}}_{\text{r}\text{e}\text{p}\text{l}\text{i}\text{c}\text{a}\text{t}\text{e}}\right|}{\text{b}\text{ase\:}\text{v}\text{alue}}\right)\times\:100\text{\%}$$
The criterion for DNAm probe filtration was an intraclass correlation coefficient exceeding 0.4 within Genotype-Tissue Expression (GTEx) samples. GTEx data included both male and female tissues, and the candidate probes were also affected by male/female factors. Next, we used replicates to assess consistency, finding fewer than one hundred probes that changed by more than 100%, primarily those with low β values. In summary, the evaluation results indicate that the candidate probes are reproducible but require further refinement.
Generalized linear regression
Determination of individual probes may be difficult in some tissues, so it is more robust to employ pathway enrichment. Although training and test set crossovers are commonly used in machine learning, the real situation exists where the weights and the purpose of the training are not well defined. In this study, we assume equal weighting across datasets and require that the scores fall within a specific range. The enrichment score is determined by the individual’s weights and β value with the following formula:
$$\:\text{S}\text{c}\text{o}\text{r}\text{e}={w}_{1}{{\upbeta\:}}_{i1}+\dots\:+{w}_{k}{{\upbeta\:}}_{ik}$$
The generalized elastic net includes L1-norm and L2-norm penalties to compute weights. For each DNAm probes were employed via R package gelnet (version 1.2.1) [23]. The package relied on graph laplacian, which assigns similar but not same weights to the given genes, and may help to compress the quantiles (i.e. preferring L2-norm penalties). In contrast to this, penalized likelihood methods (e.g., LASSO) make the coefficients inflated, according to our calculations.
Differential analysis
Differential DNAm probe analysis was performed using the champ.DMP function, with statistical testing conducted via eBayes. Specifically, the log fold change for DNAm probes was set at 0.1. Additionally, a nonparametric Wilcoxon test was used to identify mutations affecting the scores; mutations were grouped into binary variables, i.e., mutant and wild types. Non-synonymous mutations were classified as mutant types.
Co-methylated blocks on chromosome 19
This exploratory analysis focused on co-methylated blocks. The R package EnMCB (version 1.16.0) was adapted for use on the EPIC platform (Supplementary file), utilizing the original manufacturer’s annotated version of ilm10b4.hg19 [24]. Two moderately correlated DNAm probes, which were adjacent, were retained, and could ultimately be merged into a single boundary. The modified “IdentifyMCB_parallel” function parameters were set to (method = c(“spearman”), CorrelationThreshold = 0.4 or 0.6, PositionGap = 1000, platform = “Illumina Methylation EPIC”). Also, the above human genome used the hg19 version.
The example provided here pertains to CPTAC data, where samples were identified as co-occurring gain genes within the 19q12-13.12 region (chr19:28493000–37754420) [25]. A sample was amplified if all genes coding for the region met the conditions, i.e., a log2 copy ratio greater than 0.2. Conversely, samples in the ccRCC cohort did not satisfy the calling conditions. Also, gain genes were best excluded from the list of deletions.
Cell culture and SCG5 assay
H292, A549, and H226 cell lines were cultured in 1640 medium with 10% serum, while H520 was in DMEM with 10% serum. After 48 h for H292 and A549, and 72 h for H226 and H520, supernatants were collected, centrifuged at 2000 rpm for 20 min, and the clear supernatant was saved as samples.
To evaluate the protein level of SCG5, the enzyme linked immunosorbent assay (ID: E9861h) from EIAab company was used for the experiments. Reagent and sample equilibration, preparation of reagent A, B and washing work solution. Add standards or samples to 96-well plate with preincubated primary antibody, make replicates. Incubate with plate sealer at 37 °C for 2 h. Discard liquid, add reagent A, incubate at 37 °C for 1 h. Wash with working solution, pat dry, add reagent B, incubate at 37 °C for 1 h. Discard liquid, wash plate. Add reaction solution, incubate at 37 °C for 10–20 min protected from light. The final absorbance at 450 nm was measured within 15 min after adding the termination solution. Experiments were conducted in triplicate, and recorded in mean values ± SEM.
Statistical information
P-values were two-sided, and multiple corrections were applied using the Benjamini & Hochberg method. Values less than 0.05 were considered significant. Heatmaps were generated using the R package pheatmap, and all analyses were conducted using R software 4.2.2 version.