
GWAS identifies SBRR1 tightly associated with ShB resistance
To investigate resistance to R. solani in rice, we evaluated ShB resistance of 178 commercial rice cultivars from various regions of China, Japan and South Korea by artificial inoculation in the field (Supplementary Table 1). These cultivars showed disease scores ranging from 4.15 to 7.47, with most of them (78.09%) showing susceptibility and only 1.69% exhibiting moderate resistance (Extended Data Fig. 1a). We conducted a genotyping-by-sequencing analysis and identified a total of 109,444 high-quality single-nucleotide polymorphisms (SNPs) covering the whole rice genome. Structural analysis suggested that these varieties could be divided into two subpopulations, corresponding to indica and japonica subspecies (Extended Data Fig. 1b–e). In order to systematically survey ShB resistance genes, we then performed a GWAS for ShB resistance using the general linear model (GLM) approach controlling population structure and identified 48 SNPs that exceeded the suggestive significance threshold of association (P < 3.2 × 10⁻⁵; Fig. 1a and Supplementary Table 2). These significant SNPs correspond to seven regions located on chromosomes 1, 2, 4, 7, 8 and 11 (Supplementary Table 2).
Fig. 1: Identification of natural variations in SBRR1 that are significantly associated with ShB resistance in rice using GWAS.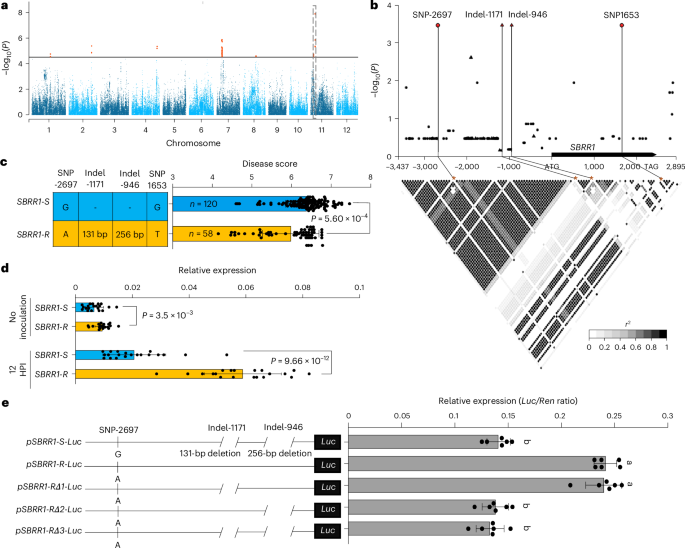
a, Manhattan plot of the GWAS. The horizontal line depicts the Bonferroni-adjusted significance threshold (P = 3.2 × 10⁻⁵). The dotted box indicates the location of the two most significant SNPs. b, SBRR1 (ShB resistance RLK 1) -based association mapping and pairwise LD (linkage disequilibrium) analysis. Triangles denote Indels (insertions/deletions) and dots represent SNPs. The lead SNPs/Indels are highlighted in red. The SNPs/Indels showing strong LD with the lead SNPs/Indels are connected to the pairwise LD diagram with solid lines and highlighted with asterisks. c, ShB resistance levels of SBRR1-S and SBRR1-R haplotypes. n denotes the number of genotypes belonging to each haplotype group. The disease score distribution of each haplotype group is displayed as a bar plot. d, Comparison of SBRR1 expression between SBRR1-R and SBRR1-S varieties (n = 20). SBRR1 expression levels were determined for 20 SBRR1-S and 20 SBRR1-R varieties with and without R. solani infection. HPI, hours post inoculation. e, Transient expression assay for promoter activity in rice protoplasts. Left panel: schematic representation of different promoter versions for the reporter construct. Right panel: luciferase reporter assay (n = 6). pSBRR1-S and pSBRR1-R indicate SBRR1 promoter from ZD88 (Zhendao 88) and XWX7 (Xiangwanxian 7) varieties, respectively. Data in c–e are presented as means ± standard deviation (s.d.). Statistical significances in c and d were determined by a two-sided Student’s t-test. Different lowercase letters in e indicate a significant difference (P < 0.05) based on one-way analysis of variance (ANOVA) with Duncan’s multiple range test.
The two most significant (P = 1.3×10⁻⁸) SNPs, S94780 and S94782, and three other significant SNPs (S94831, S94832 and S94833) are localized on chromosome 11 in a linkage disequilibrium (LD) block (191 kb) (Fig. 1a, Supplementary Fig. 1a,b, Supplementary Table 1 and Supplementary Note 1). In this block, LOC_Os11g10290, encoding a G-type LecRLK (lectin receptor-like kinase) protein, was identified as the most likely candidate and named ShB Resistance RLK1 (SBRR1) hereafter (Supplementary Fig. 1c,d and Supplementary Note 1). Further, we resequenced the SBRR1 alleles (chromosome 11: 5586341–5592553 bp), including a 3,341-bp promoter region, a 96-bp 5′ untranslated region (UTR), a 2,463-bp coding region, a 143-bp 3′ UTR and a 150-bp downstream sequence from 20 relatively susceptible (disease score >6.5) and 20 relatively resistant (disease score <5.5) varieties then performed a gene-based association mapping (Supplementary Table 3). We identified one variant (SNP1653 or S94780 mentioned above) in the coding region and three variants (SNP-2697 or S94782 mentioned above, indel (insertion/deletion) −1,171 (a 131-bp insertion) and indel-946 (a 256-bp insertion)) in the promoter region that were significantly associated with ShB resistance (Fig. 1b). Based on the four significantly associated variants, two haplotypes of SBRR1 were further identified, and one of them (haplotype ‘A—131 bp—256 bp—T’) showed significantly lower ShB disease scores than the other haplotype (‘G— – — – — G’), which were hereafter named SBRR1-R and SBRR1-S, respectively (Fig. 1c and Supplementary Table 1).
As the three promoter variants may affect expression whereas SNP1653 located in the coding region does not cause an amino acid change, we measured SBRR1 RNA expression levels for the 20 SBRR1-S and 20 SBRR1-R varieties before and after R. solani inoculation. Expression of SBRR1-R was significantly higher than that of SBRR1-S before inoculation, and SBRR1-R was more strongly induced than SBRR1-S, reaching a level 2.8-fold as high as that of SBRR1-S 12 h post-inoculation (HPI) (Fig. 1d and Supplementary Table 4). We further confirmed the differences between SBRR1-S and SBRR1-R promoters by conducting a transient expression assay in rice protoplasts using a luciferase reporter gene (LUC) driven by SBRR1-S promoter (from Zhendao 88, ZD88), SBRR1-R promoter (from Xiangwanxian 7, XWX7) and three SBRR1-R variant promoters containing deletions in the two indel regions of the SBRR1-R promoter. The SBRR1-R promoter more effectively promoted LUC expression than the SBRR1-S promoter by nearly twofold (Fig. 1e). Furthermore, the higher LUC expression level from the SBRR1-R promoter was abolished by deletion of the 256-bp fragment (indel-946), but not indel-1171, indicating the importance of the 256-bp insertion in the higher expression of SBRR1-R. Together, these results suggest that the SBRR1-R allele may be an elite allele conferring ShB resistance.
SBRR1 kinase phosphorylation is required for ShB resistance
To validate the involvement of SBRR1 in rice ShB resistance, we evaluated the phenotypes of a T-DNA insertion mutant sbrr1, SBRR1 knockout lines (sbrr1-ko1/2/3) and overexpression lines (SBRR1-OE1/2/3), and we confirmed that SBRR1 positively regulates ShB resistance (Fig. 2a,b, Extended Data Fig. 2, Supplementary Fig. 2–4 and Supplementary Note 2). As an annotated kinase, we also confirmed that SBRR1 kinase activity is required for its resistance (Fig. 2c,d and Supplementary Note 3). In a Phos-tag SDS-PAGE (sodium dodecyl sulfate polyacrylamide gel electrophoresis) assay using SBRR1-OE plants, we found a clear bandshift for SBRR1 protein representing phosphorylated SBRR1 at 12 HPI with R. solani; this bandshift reached the highest level (approximately fourfold) at 18 HPI compared to 0 HPI in SBRR1-OE plants but was not detected in wild type (WT), indicating that phosphorylation of SBRR1 is induced by pathogen attack (Fig. 2e and Extended Data Fig. 3a–c).
Fig. 2: Transgenic verification of SBRR1 function in ShB resistance and requirement of kinase activity for SBRR1 function.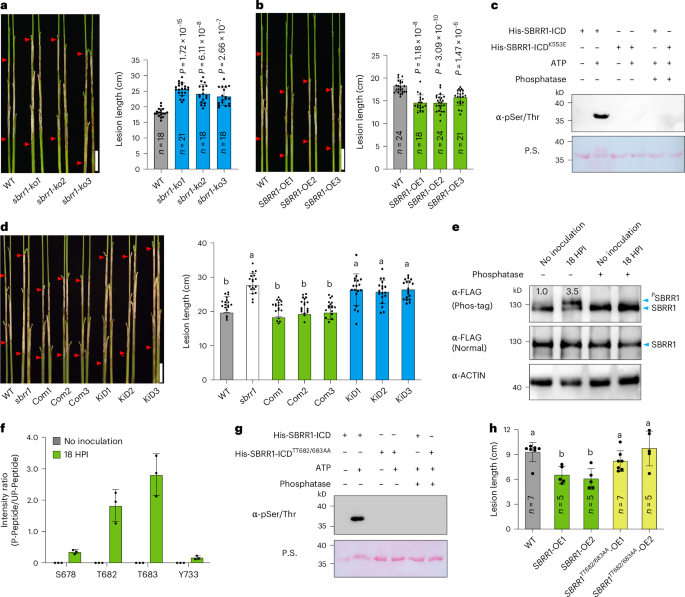
a, ShB disease severity of SBRR1 knockout lines (sbrr1-ko1/2/3, T2 generation) 14 days after R. solani inoculation in a greenhouse. b, ShB resistance of SBRR1 overexpression lines (SBRR1-OE1/2/3, T3 generation). c, Immunoblotting assay using a pSer/Thr antibody to detect autophosphorylation of His-SBRR1-ICD (ICD, intracellular domain) and His-SBRR1-ICDK553E. Ponceau S stains His-SBRR1-ICD and His-SBRR1-ICDK553E proteins. P.S., Ponceau S staining. d, Complementation by WT (Com, T3 generation) and kinase-dead (KiD, T3 generation) constructs for the susceptible phenotype of the sbrr1 mutant (n = 18). e, Comparison of phosphorylation levels of SBRR1 protein in SBRR1-OE1 with or without R. solani infection. Total protein was fractionated in SDS-PAGE (sodium dodecyl sulfate polyacrylamide gel electrophoresis) containing Phos-tag or normal SDS-PAGE. ACTIN was used as a loading reference. f, LC-MS/MS (liquid chromatography-tandem mass spectrometry)-detected intensity ratios of phosphorylated (P-peptide) to un-phosphorylated peptide (UP-peptide) at S678/T682/T683/Y733 sites of SBRR1 protein in SBRR1-OE1 line with or without R. solani infection (n = 3). g, Immunoblot assay using a pSer/Thr antibody to detect autophosphorylation of His-SBRR1-ICDTT682/683AA. P.S., Ponceau S staining. h, ShB resistance of SBRR1TT682/683AA-OE lines (T2 generation) at 7 days after inoculation. Data in a, b, d, f and h are presented as means ± s.d. Statistical significances in a and b were determined by a two-sided Student’s t-test. Different lowercase letters in d and h indicate significant differences (P < 0.05) based on one-way ANOVA with Duncan’s multiple range test. Phosphatase in c, e and g indicates calf intestinal alkaline phosphatase. Scale bar (a, b and d), 5 cm. The in vitro and in vivo phosphorylation assays were done independently three times.
We next used liquid chromatography-tandem mass spectrometry (LC-MS/MS) to detected amino acid residues phosphorylated upon R. solani infection. We found phosphorylation of SBRR1 residues S678, T682, T683, and Y733 in SBRR1-OE plants upon inoculation with R. solani; importantly, no phosphorylation of these residues was detected without R. solani infection. In particular, the phosphorylation levels of T682 and T683 were most notable, showing ratios (counts of phosphorylated peptide/unphosphorylated peptide detected in MS) of 1.8 and 2.8, respectively (Fig. 2f and Supplementary Fig. 5). We noticed that both T682 and T683 are located in the kinase activation loop of SBRR1, and in general, phosphorylation of one to three residues in the activation loop is required for kinase activity24,25. To evaluate the effects of T682 and T683 phosphorylation to SBRR1 kinase activity, we mutated both residues from threonine to alanine (TT682/683AA) and found that the His-SBRR1-ICDTT682/683AA (ICD, intracellular domain) protein completely abolished SBRR1 autophosphorylation (Fig. 2g and Extended Data Fig. 3d), suggesting that the phosphorylation of TT682/683 is essential for SBRR1 kinase activity. To extend these findings in vivo, we generated transgenic rice plants overexpressing SBRR1TT682/683AA under control of the 35S promoter (Extended Data Fig. 3e). We found that SBRR1TT68/2683AA-OE plants did not improve ShB resistance compared with WT, showing significantly lower resistance than SBRR1-OE plants (Fig. 2h). Taken together, these data confirm that the kinase activity of SBRR1 and phosphorylation of TT682/683 are required for SBRR1-mediated ShB resistance.
SBRR1-R is an elite allele mainly present in indica rice
To confirm the variation in the promoter region causes the difference in resistance between SBRR1-R and SBRR1-S, we transformed the sbrr1 mutant with elite promoter (EPro) construct pSBRR1XWX7:SBRR1DJ (SBRR1-R promoter from XWX7 driving SBRR1-S coding region from Dongjin (DJ)). The three EPro lines showed significantly higher inducible SBRR1 transcript levels, reaching levels approximately threefold as high as that of WT DJ after R. solani inoculation, indicating that the SBRR1-R promoter from XWX7 indeed more strongly responded to R. solani infection than the SBRR1-S promoter (Fig. 3a). When assessed for their resistance to R. solani, we found that the three EPro lines all showed lesion lengths (~15.22–15.70 cm) significantly shorter than WT (18.76 cm) and the sbrr1 mutant (23.84 cm) (Fig. 3b). The resistance phenotype in field test is consistent with that in greenhouse and no visible changes in major agronomic traits were found in the EPro transgenic lines compared with WT (Extended Data Fig. 4). Together, these data confirm that the natural variation in the promoter region accounts for stronger resistance of the SBRR1-R elite allele.
Fig. 3: ShB resistance function, geographic distribution and molecular evolution of elite SBRR1-R.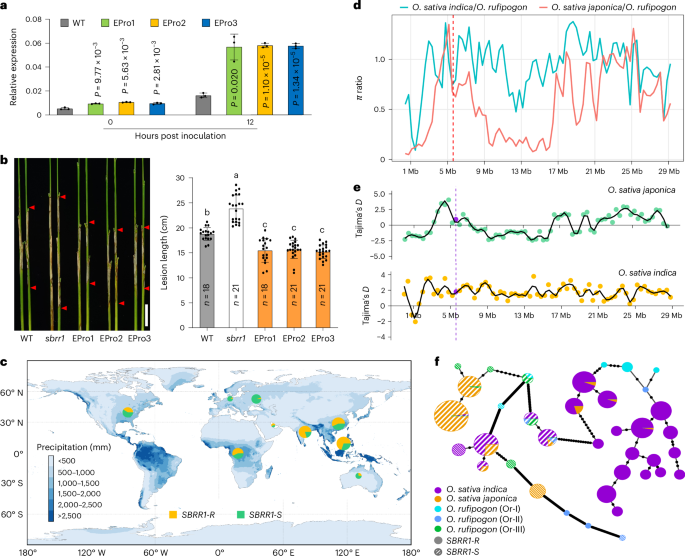
a, Expression levels of SBRR1 in EPro lines (pSBRR1XWX7:SBRR1DJ, EPro1/2/3, T3 generation) (n = 3). b, ShB resistance of EPro lines. Data in a and b are presented as means ± s. d. Statistical significance in a was determined by a two-sided Student’s t-test. Different lowercase letters in b indicate a significant difference (P < 0.05) based on one-way ANOVA with Duncan’s multiple range test. Scale bar, 5 cm. c, Geographic distributions of SBBR1-R and SBRR1-S among 2,478 cultivated rice varieties. Orange and green circles indicate SBRR1-R and SBRR1-S, respectively. d, The relative ratio of nucleotide diversity of cultivated rice to common wild rice in the whole rice chromosome 11. The dotted red line indicates the SBRR1 locus. The ratios of nucleotide diversity of japonica/O. rufipogon and indica/O. rufipogon are shown. The ratio in SBRR1 is higher than in flanking regions for japonica/O. rufipogon, whereas the ratio in SBRR1 is notably lower than in flanking regions for indica/O. rufipogon. e, The Tajima’s D analysis in the whole chromosome 11 of cultivated rice. Purple line and dots indicate the SBRR1 locus. The estimated Tajima’s D values for the SBRR1 locus are substantially positive in indica but near zero in japonica. f, Haplotype network of SBRR1 generated using the coding and upstream 1.5-kb sequences of SBRR1 from cultivated rice varieties and common wild rice. Black spots on the lines indicate mutational steps between two haplotypes.
After a comprehensive survey, we found differential presence of SBRR1-R in indica and japonica rice varieties (Supplementary Figs. 6 and 7a,b, Supplementary Tables 5 and 6 and Supplementary Note 4). Geographic distribution analysis showed that the SBRR1-R allele is mainly present in Southeast Asia, East Asia, South Asia and Africa, all of which have favorable temperature and humidity conditions for ShB disease development during rice growing periods (Fig. 3c).
To further probe the molecular evolution of SBRR1-R, we analyzed the relative ratio of nucleotide diversity in indica to wild rice and observed that it is notably lower in the SBRR1 locus than in flanking regions (Fig. 3d and Supplementary Table 7) and that the estimated Tajima’s D values for the SBRR1 locus are substantially positive in indica (Fig. 3e). These results suggest that SBRR1 might have experienced a balancing selection during indica rice domestication. By contrast, the locus of SBRR1 followed a neutral evolution during japonica rice domestication (Fig. 3d,e and Supplementary Table 7). Notably, we found that the SBRR1 allele was diverged in the common wild rice (Supplementary Table 9). Up to 71.43% of O. rufipogon I (Or-I, the progenitor of indica) varieties contained the SBRR1-R allele, whereas all sampled O. rufipogon III (Or-III, the progenitor of japonica) contained the SBRR1-S allele. Both phylogenetic data and haplotype network analysis results using 37 SBRR1 haplotypes revealed that the indica varieties containing SBRR1-R and the japonica varieties containing SBRR1-S had the closest relationship with Or-I and Or-III types of wild rice, respectively (Fig. 3f and Supplementary Fig. 7c), suggesting that SBRR1-R and SBRR1-S alleles are derived from Or-I and Or-III, respectively. Together, we conclude that the SBRR1-R allele originated from wild rice Or-I and then was inherited by most indica varieties located in the regions with more favorable conditions for R. solani infection.
SBRR1-R allele shows great potential for breeding
Because the SBRR1-R allele is almost absent in japonica rice cultivars, which are increasingly spreading toward south China due to the large demand of japonica rice, we tested the breeding potential of SBRR1-R in japonica rice against ShB. Based on the sequence variations in the promoter region between SBRR1-R and SBRR1-S, we developed a diagnostic marker for SBRR1-R (Extended Data Fig. 5a). Via marker assisted selection, we transferred SBRR1-R from YSBR1, a rice variety containing the SBRR1-R allele showing relatively high resistance to ShB10,26, into two widely planted japonica cultivars, Taigeng 394 (TG394) and Xudao 3 (XD3) separately (Extended Data Figs. 2a,b and 5a,b). At the BC5F5 generation, we obtained near-isogenic lines TG394-SBRR1R and XD3-SBRR1R carrying SBRR1-R in the TG394 and XD3 backgrounds, respectively (Extended Data Fig. 5b). TG394-SBRR1R showed significantly higher ShB resistance than WT TG394, with a 24.4% reduction in lesion length (19.3 versus 14.6 cm) in greenhouse assays (Fig. 4a). Similarly, XD3-SBRR1R also displayed significantly enhanced ShB resistance compared with XD3, with a 22.0% reduction in lesion length and no differences in main agronomic traits (Extended Data Fig. 5c,d).
Fig. 4: SBRR1-R significantly reduces grain yield losses caused by ShB in field test.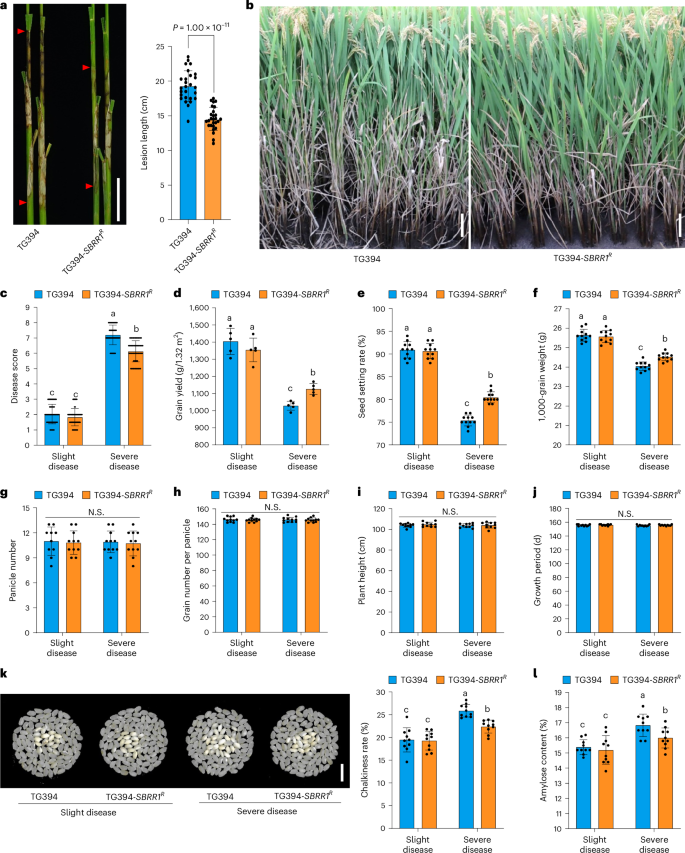
a, ShB lesions of TG394-SBRR1R (TG394, Taigeng 394) and TG394 measured 14 days after R. solani inoculation in greenhouse (n = 27). b, ShB phenotypes of TG394-SBRR1R and TG394 under severe disease conditions in the field. c–l, Comparison of disease score (c, n = 60), grain yield (d, n = 5), seed setting rate (e, n = 11), 1,000-grain weight (f, n = 11), panicle number (g, n = 11), grain number per panicle (h, n = 11), plant height (i, n = 10), growth period (j, n = 10), chalkiness rate (k, n = 10) and amylose content (l, n = 10) of TG394-SBRR1R and TG394 under slight and severe disease conditions in the field. Data in a and c–l are presented as means ± s.d. Statistical significance in a was determined by a two-sided Student’s t-test. Different lowercase letters in c–l indicate significant differences (P < 0.05) based on one-way ANOVA with Duncan’s multiple range test. N.S. indicates no significant differences. Scale bar, 5 cm in a, 5 cm in b and 1 cm in k.
Furthermore, we conducted a field test for TG394 and TG394-SBRR1R under two ShB disease conditions: slight and severe ShB diseases (Fig. 4b–l). We found that under the severe ShB disease condition, TG394-SBRR1R showed an average ShB disease score of 6.13, significantly lower than TG394 (7.22), demonstrating a considerable resistance effect for SBRR1-R in the field trial (Fig. 4b,c). In the severe ShB condition, grain yield and grain quality of TG394 and TG394-SBRR1R lines were both significantly reduced, mainly attributed to decreased seed setting rate, 1,000-grain weight, increased chalkiness rate and amylose content (Fig. 4d–i). However, the TG394-SBRR1R line had significantly lower yield loss than TG394 upon severe ShB disease occurrence: TG394 yield was reduced from 1,404.0 g/1.32 m2 to 1,028.5 g/1.32 m2 (26.75% drop) and TG394-SBRR1R yield from 1,354.3 g/1.32 m2 to 1,126.6 g/1.32 m2 (16.82% drop). Comparatively, the SBRR1-R allele rescued 9.54% (98.1 g per 1.32 m2) of the 26.75% grain yield loss of TG394 due to reduced ShB disease severity (Fig. 4d). Further analysis showed that the rescued yield losses were mainly attributed to two yield components: seed setting rate (6.75%) and 1,000-grain weight (2.00%) (Fig. 4e,f). TG394-SBRR1R also displayed significantly lower loss in grain quality than TG394, including lower chalkiness rate (~3% reduction) and amylose content (~0.8% reduction), suggesting that SBRR1-R also contributed to retaining grain quality under severe ShB disease conditions (Fig. 4k,l). Under slight ShB disease conditions, TG394-SBRR1R showed no significant differences from TG394 in disease scores (Fig. 4c), major agronomical traits, grain yield associated traits and grain quality, indicating that SBRR1-R has no adverse impact on rice development (Fig. 4d–l and Extended Data Fig. 5d). Meanwhile, we also conducted a similar field trial using SBRR1-OE1 and WT plants and, in agreement, found that overexpressing SBRR1 rescued 13.2% of yield losses under severe disease conditions (Extended Data Fig. 6). Together, these results suggest that SBRR1-R carries great potential for rice breeding against ShB.
bHLH57 differentiates SBRR1-R and SBRR1-S expression
To investigate how the 256-bp insertion in the SBRR1-R promoter affects its higher ShB resistance (Fig. 1e), we performed a yeast one-hybrid (Y1H) screening assay using this insertion segment and identified transcription factor bHLH57 (basic helix-loop helix 57, LOC_Os07g35870) (Fig. 5a). By dividing the 256-bp region into two fragments for the Y1H assay, we further narrowed down the binding site of bHLH57 to a 121 bp region (pSBRR1-M2) that contains a ‘CACCGG’ motif putatively serving as a cis-motif for bHLH57 binding. Moreover, mutating ‘CACCGG’ to ‘AAACGG’ (pSBRR1-mutated-M2) abolished the interaction with bHLH57 (Fig. 5a). Notably, this motif is only present in the 256-bp insertion sequence of SBRR1-R but not in the SBRR1-S promoter or its coding genomic region. Furthermore, in electrophoretic mobility shift assays (EMSAs), we detected a slower migrating band for the 21-bp native probe carrying the CACCGG motif when incubated with a GST-bHLH57 (GST, glutathione S-transferase) fusion protein. Unlabeled WT competitors, but not mutated competitors, at 20-fold greatly reduced the binding to the probe, indicating specific binding to this sequence (Fig. 5b). To further confirm that bHLH57 binds to the SBRR1-R promoter in vivo, we carried out a chromatin-immunoprecipitation-quantitative PCR (ChIP-qPCR) assay using TG394-SBRR1R/bHLH57-OE plants (Supplementary Fig. 8). The results showed that bHLH57 specifically enriched the P2 fragment carrying the CACCGG motif of the SBRR1-R promoter (Fig. 5c). We next tested the effect of bHLH57 on SBRR1-R expression by conducting dual-luciferase assays in N. benthamiana. We found that addition of bHLH57 protein notably increased (by threefold) luciferase activities driven by the SBRR1-R promoter, but not by the SBRR1-S promoter (Fig. 5d), indicating that bHLH57 is able to activate SBRR1-R expression but not SBRR1-S expression. In addition, we found that bHLH57 protein was localized in the nucleus and mainly expressed in leaf sheaths and blades, which is well correlated with R. solani infection sites in rice (Extended Data Fig. 7). Together, these data indicate that bHLH57 activates SBRR1-R expression by directly binding to its 256-bp insertion sequence.
Fig. 5: bHLH57 accounts for the highly induced expression of SBRR1-R by specifically binding to its promoter.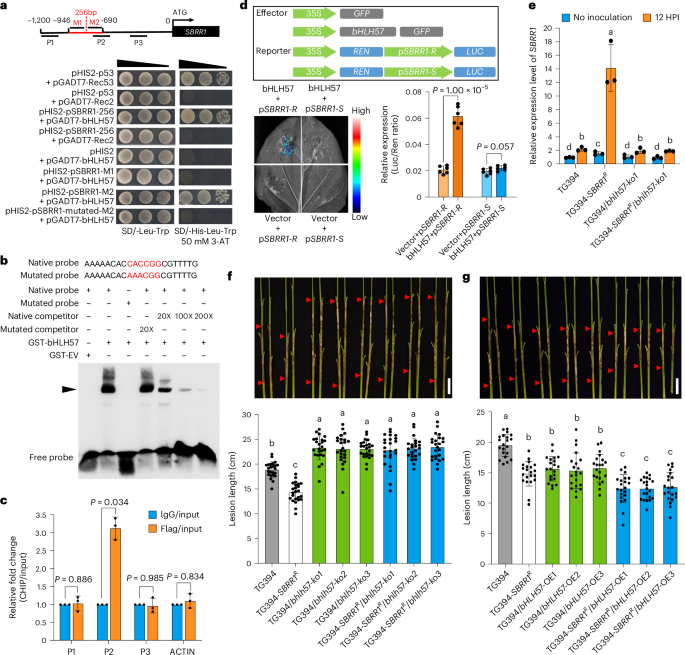
a, Y1H assay to identify potential bHLH57 (basic helix-loop helix 57) binding site. M1 and M2 represent two fragments of the 256-bp insertion. The CACCGG motif is found only in the M2 fragment. b, EMSA to confirm the direct binding of bHLH57 to CACCGG motif. GST-EV, glutathione S-transferase-empty vector. c, ChIP-qPCR assay for the enrichment of the P2 region of the SBRR1-R promoter by transcription factor bHLH57 (n = 3). Enriched values are normalized to the input. An unrelated OsActin1 intron region (ACTIN) was used as a negative control. IgG-immunoprecipitated DNA was used as a control. d, Dual-luciferase reporter assay to study the effects of bHLH57 on SBRR1-R gene expression (n = 6). 35S, cauliflower mosaic virus 35S promoter. GFP, green fluorescent protein. REN, Renilla luciferase. LUC, firefly luciferase. e, RNA expression levels of the SBRR1 gene in TG394, T394-SBRR1R and their bhlh57-ko plants (n = 3). HPI, hours post inoculation. f, ShB lesions of bHLH57 knockout lines (T1 generation) in TG394 and T394-SBRR1R backgrounds scored 14 days after R. solani inoculation in greenhouse (n = 24). g, ShB lesions of bHLH57 overexpression lines (T1 generation) in TG394 and T394-SBRR1R backgrounds scored 14 days after R. solani inoculation in greenhouse (n = 21). Data in c–g are presented as means ± s.d. Statistical significances in d and c were determined by a two-sided Student’s t-test. Different lowercase letters in e–g indicate significant differences (P < 0.05) based on one-way ANOVA with Duncan’s multiple range test. Scale bar, 5 cm in f and g. The Y1H, dual-luciferase reporter and EMSAs were done independently three times.
To determine the contribution of bHLH57 to SBRR1-R-mediated ShB resistance, we used CRISPR/Cas9 to generate bHLH57 knockout lines in TG394 cultivar (carrying the SBRR1-S allele) and its near-isogenic line TG394-SBRR1R (with the SBRR1-R allele) background separately (Supplementary Fig. 9). We found that the RNA level of SBRR1 in TG394-SBRR1R plants was about seven times of that in TG394 at 12 HPI, whereas the level in TG394-SBRR1R/bhlh57-ko plants was comparable with those in TG394 and TG394/bhlh57-ko plants (Fig. 5e), indicating that the strong induction pattern of SBRR1 expression in SBRR1-R varieties depends on bHLH57. In agreement, we found that all TG394/bhlh57-ko and TG394-SBRR1R/bhlh57-ko lines displayed lower ShB resistance than their corresponding controls (Fig. 5f), indicating that bHLH57 positively regulates ShB resistance. Importantly, the fact that TG394-SBRR1R plants showed stronger ShB resistance than TG394 plants, whereas TG394-SBRR1R/bhlh57-ko plants displayed similar susceptible levels as TG394/bhlh57-ko plants, clearly showed that SBRR1-R-mediated ShB resistance requires bHLH57 (Fig. 5f). We also generated bHLH57 overexpression lines in TG394 and TG394-SBRR1R backgrounds (Supplementary Fig. 8) and found that TG394/bHLH57-OE lines displayed enhanced ShB resistance in comparison with TG394, which is consistent with a previous report showing that bHLH57 was involved in ShB resistance27. In addition, we found that TG394-SBRR1R/bHLH57-OE plants showed stronger resistance than both TG394-SBRR1R and TG394/bHLH57-OE plants (Fig. 5g), further confirming that bHLH57 and SBRR1-R depend on each other to further enhance ShB resistance. Collectively, these data indicate that bHLH57 is a positively master regulator in the expression of elite SBRR1-R in response to R. solani infection.
SBRR1 localization aided by SIP1 is crucial for its function
We identified a SBRR1-interacting protein (named SIP1, LOC_Os03g63480) via yeast two-hybrid (Y2H) and confirmed that SIP1 is required for SBRR1-mediated ShB resistance (Fig. 6, Supplementary Figs. 10 and 11 and Supplementary Note 5). To probe how SIP1 affects SBRR1-mediated resistance, we generated SBRR1 and SIP1 proteins truncated at different regions and assessed their interaction in Y2H system. We found that the plasminogen-apple-nematode (PAN) domain in the extracellular juxtamembrane region of SBRR1 and the aspartate-proline (DP)-repeat domain of SIP1 were required for their interaction (Extended Data Fig. 8). Because DP-repeat domain has been reported to affect protein transport from endoplasmic reticulum (ER) to plasma membrane (PM)28, we hypothesized that the subcellular localization of SBRR1 might be influenced by SIP1. To test this hypothesis, we analyzed the subcellular localization of SBRR1 and SIP1 in both WT rice protoplasts and N. benthamiana leaf epidermal cells. We found that the green fluorescence of the SBRR1-GFP (GFP, green fluorescent protein) protein was present on PM, merging well with the red signals of the PM marker, and that SIP1-GFP was partially co-localized with the ER marker and the PM marker (Fig. 7a, Supplementary Fig. 12a and Extended Data Fig. 9). We then observed the localization pattern of SBRR1-GFP in the sip1-ko1 mutant and found that most SBRR1-GFP signals (~81%) were localized to ER, with only ~19% localized on PM, indicating that the sip1-ko1 mutant severely affected the PM localization of SBRR1 (Fig. 7b,c and Supplementary Fig. 12b). We further generated an SBRR1 mutant (SBRR1ΔPAN) that lacks the PAN domain and found that almost all SBRR1ΔPAN-GFP signals (~95%) were co-localized with the ER marker and only ~5% co-localized with the PM marker in WT rice protoplasts (Fig. 7d,e and Supplementary Fig. 12c), suggesting that deletion of the PAN domain caused retention of SBRR1 in ER.
Fig. 6: SIP1 physically interacts with SBRR1 and is required for SBRR1-mediated ShB resistance.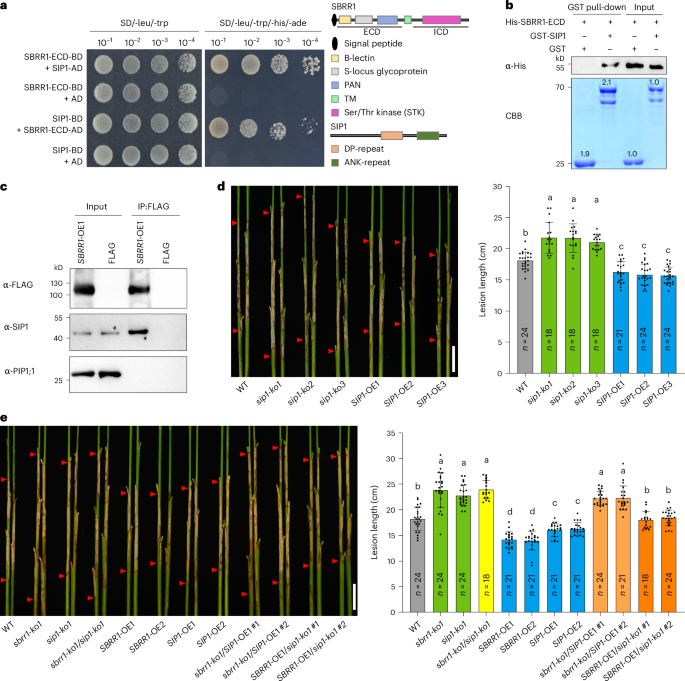
a–c, Y2H assay (a), in vitro GST (glutathione S-transferase) pull-down assay (b), and in vivo co-immunoprecipitation (Co-IP) assay using SBRR1-OE1 transgenic plants (c) for SBRR1 and SIP1 (SBRR1-interacting protein 1) interaction. ECD, extracellular domain. ICD, intracellular domain. BD, binding domain; AD, activity domain. The schematic diagram on the right side in a shows the different domains of SBRR1 and SIP1 proteins. Lower panel in b shows the protein abundance stained by CBB (Coomassie brilliant blue) in SDS-PAGE gel. FLAG, transgenic plants expressing a FLAG tag alone, and anti-PIP1;1 (plasma membrane intrinsic protein 1;1) were used as negative controls. The GST pull-down assay and Co-IP assay were performed three times independently with similar results. d, ShB lesions of SIP1 knockout and overexpression lines (T3 generation) scored 14 days after R. solani inoculation in greenhouse. e, ShB lesions of sbrr1-ko1/sip1-ko1, sbrr1-ko1/SIP1-OE1 and SBRR1-OE1/sip1-ko1 lines 14 days after R. solani inoculation in greenhouse. Data in d and e are presented as means ± s.d. Different lowercase letters in d and e indicate significant differences (P < 0.05) based on one-way ANOVA with Duncan’s multiple range test. Scale bar, 5 cm in d and e. The Y2H, pull-down and Co-IP assays were done independently three times.
Fig. 7: SIP1 is required for transport of SBRR1 to the plasma membrane.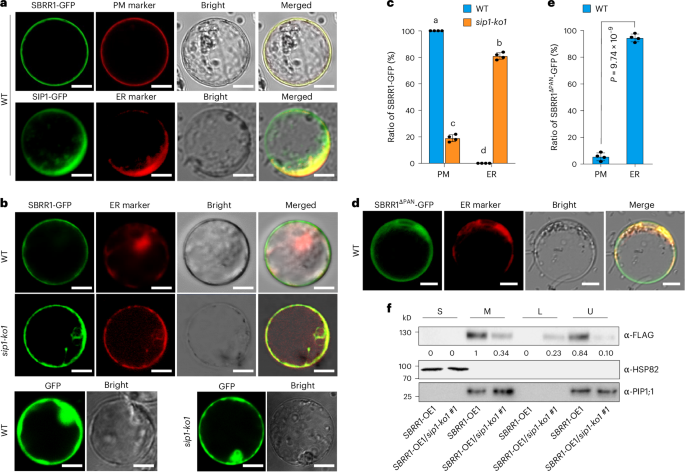
a, Subcellular localization of SBRR1 and SIP1 in WT protoplasts. b,c, Subcellular localization of SBRR1-GFP in WT and sip1-ko1 protoplasts, and its partition in PM (plasma membrane) and ER (endoplasmic reticulum). d,e, Subcellular localization of SBRR1ΔPAN-GFP (PAN, plasminogen-apple-nematode) in WT protoplasts and its partition in PM and ER. The images in a, b and d were taken under a laser scanning confocal microscope 12 h after transfection. Scale bar (a, b and d), 10 μm. The ratio of protoplasts with only PM-localized GFP signals to the total protoplasts with GFP signals was measured with 100 fluorescent cells in c and e. The protoplasts without clear PM-localized GFP signals show ER-localized GFP signals. Data in c and e are presented as means ± s.d (n = 4). Different lowercase letters in c indicate significant differences (P < 0.05) based on one-way ANOVA with Duncan’s multiple range test. Statistical significance in e was determined by a two-sided Student’s t-test. f, SBRR1 protein distribution in two-phase partitioning. S, soluble fraction; M, microsomal fraction; U, upper phase of partitioning; L, lower phase of partitioning. The blot was probed with the antibody indicated to the right of each panel. PIP1;1 (plasma membrane intrinsic protein 1;1), plasma membrane marker; HSP82 (heat shock protein 82), cytoplasmic marker. The subcellular localization and two-phase partitioning assays were done independently three times.
In addition, we performed aqueous two-phase partitioning experiments using SBRR1-OE1 and SBRR1-OE1/sip1-ko1 lines and found that SBRR1 protein was all detected in the PM-enriched fraction (U, upper phase of partitioning) in SBRR1-OE1 plants; whereas in SBRR1-OE1/sip1-ko1 plants, less than one third of SBRR1 were detected in the PM-enriched fraction and more than two thirds of SBRR1 were found in the endomembrane-enriched fraction (L, lower phase of partitioning) (Fig. 7f; Supplementary note 6). This further confirmed that sip1-ko indeed influenced the PM localization of SBRR1. The loss of proper SBRR1 localization on PM due to lack of SIP1 may be the reason that SBRR1-OE1/sip1-ko1 showed a ShB resistance level close to WT level (Fig. 6e). Together, these data demonstrate that SIP1 facilitates SBRR1 accumulation on PM where SBRR1 functions.
SBRR1 confers ShB resistance mainly via chitinase genes
To further probe the resistance mechanism of SBRR1 to ShB, we performed an RNA-seq to compare transcript profiles of both sbrr1-ko1 and sip1-ko1 (most SBRR1 protein was retained in ER) plants with those of WT plants before and after inoculation with R. solani. We identified 1,137 and 760 differentially expressed genes (DEGs) responding specifically to R. solani for sbrr1-ko1 and sip1-ko1, respectively (Extended Data Fig. 10a; Supplementary Tables 9,10). Gene ontology (GO) analysis showed that these DEGs belong to many pathways. Interestingly, we noted that multiple chitinase gene-related pathways (chitin catabolic process, chitin binding and chitinase activity) and antioxidative pathways (oxidation-reduction process, oxidoreductase activity) were affected in both sbrr1-ko1 and sip1-ko1 plants (Extended Data Fig. 10a and Supplementary Tables 11 and 12). It has been widely validated that chitinases contribute importantly to ShB resistance by degrading chitin, the most abundant polymer of fungal cell walls9. Therefore, we compared the expression levels of all 19 chitinase (Chit) genes between sbrr1-ko1 and WT and between sip1-ko1 and WT at different timepoints post inoculation. Compared with WT plants, we found that the induced expression levels of Chit3 (Loc_Os04g41680), Chit4 (Loc_Os03g30470), Chit7 (LOC_Os06g51050), Chit12 (Loc_Os08g41100) and Chit17 (Loc_Os05g33130) in sbrr1-ko1 plants, and Chit3, Chit4, and Chit17 in sip1-ko1 plants were significantly lower, and among them Chit3 and Chit4 were changed most significantly. These data suggest that chitinase genes act downstream of SBRR1 in response to R. solani (Fig. 8a; Supplementary Fig. 13).
Fig. 8: SBRR1 confers ShB resistance mainly by promoting expression of chitinase genes and its working model.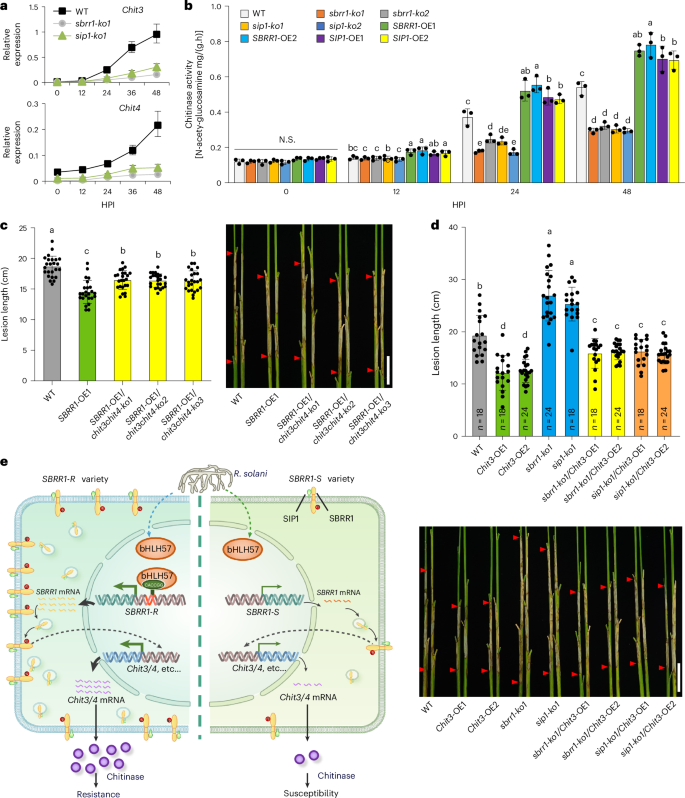
a, Chitinase (Chit) genes showing the most significant changes in RNA expression levels between WT and sbrr1-ko1 or sip1-ko1 line at different hours post R. solani inoculation (HPI) (n = 3). b, Chitinase activity in SBRR1 and SIP1 knockout and overexpression lines at different HPI (n = 3). c, ShB lesions of WT, SBRR1-OE1 and SBRR1-OE1/chit3chit4-ko lines (T2 generation) 14 days after R. solani inoculation in greenhouse (n = 24). d, ShB lesions of WT, Chit3-OE, sbrr1-ko1, sip1-ko1, sbrr1-ko1/Chit3-OE (T2 generation) and sip1-ko1/Chit3-OE (T2 generation) lines 14 days after R. solani inoculation in greenhouse. e, A model for SBRR1-mediated ShB resistance. In SBRR1-R varieties, transcription factor bHLH57 specifically binds to the ‘CACCGG’ motif in the 256-bp insertion of SBRR1-R promoter, elevating SBRR1 expression, reflected by mRNA. In cytoplasm, SIP1 protein, which likely acts as a molecular chaperone, interacts with the extracellular domain of SBRR1 to facilitate effective accumulation of SBRR1 protein on plasma membrane to function. As a kinase protein, SBRR1 phosphorylation is increased upon R. solani attack and required for ShB resistance. Lastly, quickly elevated expression of Chit genes accounts for the majority of SBRR1-mediated downstream defense against R. solani. In SBRR1-S varieties, due to lack of the 256-bp insertion in promoter, bHLH57 cannot effectively activate SBRR1 expression, and lower SBRR1 mRNA lead to lower accumulation of chitinases and susceptibility. Data in a–d are presented as means ± s.d. Different lowercase letters in b–d indicate significant differences (P < 0.05) based on one-way ANOVA with Duncan’s multiple range test. N.S. indicates no significant differences. Scale bar, 5 cm in c and d.
Further, we measured chitinase activities in the knockout and overexpression lines of SBRR1 and SIP1 at different time points after inoculation. We found that chitinase activities were all significantly reduced (up to ~50% reduction) in sbrr1-ko and sip1-ko lines, but significantly increased in overexpression plants compared with WT plants, at 24 and 48 HPI (Fig. 8b). Since the SBRR1-R allele shows more rapidly induced SBRR1 expression levels than SBRR1-S, we also measured the chitinase activities and found that TG394-SBRR1R carried ~40% higher chitinase activity than TG394 at 48 HPI, but showed no differences in chitinase activity than TG394 without ShB inoculation (Extended Data Fig. 10b).
To confirm the contribution of chitinases to SBRR1-mediated resistance, we simultaneously knocked out Chit3 and Chit4, which showed the most significant changes in their transcript levels, in SBRR1-OE1 background. We found that the knockout plants (SBRR1-OE1/chit3-ko/chit4-ko) were significantly more susceptible to ShB than SBRR1-OE1 plants (~16.4 cm versuss 14.5 cm lesion length) but still moderately more resistant than WT plants (18.7 cm), indicating that the two chitinase genes are required for full function of SBRR1 overexpression (Fig. 8c and Supplementary Fig. 14). We also overexpressed Chit3 in sbrr1-ko1, sip1-ko1 and WT backgrounds and found that sbrr1-ko1/Chit3-OE and sip1-ko1/Chit3-OE plants clearly exhibited stronger resistance than sbrr1-ko1, sip1-ko1 and even WT plants but lower resistance than Chit3-OE plants in WT background (Fig. 8d and Supplementary Fig. 15), suggesting that Chit3-OE can restore ShB resistance in sbrr1-ko1 and sip1-ko1 plants. Together, these results demonstrate that chitinase genes play a critical role in SBRR1-mediated downstream defense response to R. solani infection (Fig. 8e).