
Bacterial strains and growth conditions
All strains, unless otherwise specified, were grown in Luria–Bertani (LB) at 30 °C with 200-rpm shaking. Antibiotic activity test strains and ESKAPE pathogens were: B. subtilis 168, S. aureus SH1000, E. coli ATCC 25922, E. faecium COM15, K. pneumoniae ATCC 10031, A. baumannii ATCC 17978, P. aeruginosa PAO1 and E. cloacae ATCC 13047.
Sample collection
In late May 2023, we collected samples from Rockefeller University’s 1,200-acre Center for Field Research in Ethology located in Dutchess County, New York. In order of collection, these comprised soil from a healthy forest (forest 1), sediment from a muddy bog, soil from the edge of a lake (forest 2), soil from a grove of dead trees (forest 3), decaying material from a dead tree and soil from a dry forest area (forest 4). Soil from a maximum depth of 10 cm was collected from an area of 50 cm2 into a gallon-sized Ziploc bag. A single collected bag of forest soil 1 was used for testing and scaling. After collection, bags were stored at 4 °C.
Nycodenz isolation of soil microorganisms
Gradient centrifugation for separation of cells from the soil matrix and testing washes for removal of copurified contaminants were motivated by previous approaches in the field42,43,44. Soil (62.5 g) was added to 200 ml of prechilled 10 mM sodium pyrophosphate (Sigma) and blended (Hamilton Beach 10 speed) for 1 min using the LO/batter setting. The container was then placed on ice for 5 min. The 1-min blending and 5-min ice break were repeated two more times. Blended soil was then filtered through a cheesecloth (grade 90, bleached) to remove large insoluble particles and the filtrate was gently layered onto 8 ml of 36% w/v nycodenz (Accurate Chemical and Scientific Corporation) to the top of 50-ml conicals (Sarstedt). The tubes were centrifuged at 4 °C, 5,000g for 1.5 h in a swing bucket rotor yielding a fuzzy beige cell layer at the interface of the top (aqueous) and bottom (nycodenz) layer. The cell layer was gently aspirated and combined in a fresh 50-ml conical. The cell suspension was mixed 1:1 with sterile water and the mixture centrifuged at 4 °C, 5,000g for 1 h. The supernatant was discarded and the cell pellet was washed twice with 40 ml of JSM buffer (0.9% w/v NaCl and 1% w/v instant nonfat dry milk (Nestle)), followed by two washes with 40 ml of TE lysis buffer (25 mM Tris, 25 mM EDTA and 50 mM glucose). Lastly, the cell pellet was resuspended in a small volume (1–5 ml) of lysis buffer, the optical density at 600 nm (OD600) was checked and the bacterial suspension diluted as necessary for the desired DNA extraction protocol.
DNA extractionsDirect soil extraction
DNA extraction directly from soil was performed as previously described18. Briefly, 2.4 ml of CTAB lysis buffer (100 mM Tris-HCl, 100 mM Na EDTA, 1.5 M NaCl, 1% w/v CTAB and 2% w/v SDS, pH 8.0) was added to 2 g of soil in a 5-ml tube and the slurry was incubated at 70 °C for 2 h. For the nycodenz-isolated bacteria, 3 ml of a 30-OD600 bacterial suspension was pelleted, then resuspended in 4 ml of CTAB lysis buffer and incubated at 70 °C for 2 h. After incubation, the suspensions were centrifuged at 20,000g for 10 min and the supernatant was moved to new tubes. Supernatants were combined with 0.7 volumes of isopropanol and incubated at room temperature for 10 min. Samples were centrifuged at 20,000g for 30 min and the resulting DNA pellets was washed twice with 1 ml of 70% ethanol. The pellets were then air-dried for 1–2 h at room temperature and resuspended in 100–200 µl of 5 mM Tris pH 8 overnight at 4 °C.
Gel plug
This protocol is an adaptation of gel plug lysis described by Walter et al.45 Nycodenz-isolated bacteria were resuspended in lysis buffer to 10 OD600. The bacterial suspension was mixed 1:1 with 1.5% UltraPure low-melting-point agarose (Thermo Fisher Scientific) prepared in lysis buffer and cooled to 50 °C. The mixture was used to cast gel plugs in CHEF Mapper XA system 50-well plug molds (BioRad, 1703713). Gel plugs were then suspended in a solution of 5 mg ml−1 lysozyme and 1 mg ml−1 achromopeptidase prepared in lysis buffer and gently rotated at 37 °C overnight using a Roto-therm plus (Benchmark Scientific). The buffer was decanted and the plugs were topped up with TESP buffer (50 mM Tris, 100 mM EDTA, 1% w/v SDS and 1 mg ml−1 proteinase K) and incubated overnight with gentle rotation at 50 °C. The gel plug suspension was decanted and the plugs were topped up with fresh TESP and once again incubated overnight with gentle rotation at 50 °C. TESP was then decanted and the gel plugs were rinsed several times with milli-Q water before being suspended in T10E50 (10 mM Tris and 50 mM EDTA, pH 8) with 1 mM PMSF and incubated at room temperature for 2 h. The liquid was decanted and the plugs washed four times with T10E50 with each wash lasting 1 h on ice. Gel plugs were then stored suspended in T10E50 in the fridge.
Direct lysis
Cell lysis was performed similarly to previously established approaches46,47. Nycodenz-isolated bacteria were resuspended in lysis buffer to 10 OD600 and 500 µl of the suspension was pelleted by centrifugation for 1 min at 20,000g. The cell pellet was resuspended in 800 µl of lysis buffer containing 5 mg ml−1 lysozyme and 1 mg ml−1 achromopeptidase and the suspension was incubated at 37 °C for 2 h. After incubation, 1 mg of proteinase K powder was added, followed by 200 µl of 5% w/v SDS. The sample was very gently inverted to mix and incubated for 3 h at 55 °C. The viscous solution was then layered onto a sucrose gradient for size selection.
Monarch HMW DNA extraction kit for tissue
About 1 ml of 10-OD600 nycodenz-isolated bacteria was centrifuged at 20,000g for 1 min and the cell pellet was resuspended in 300 µl of TE lysis buffer containing 5 mg ml−1 lysozyme and 1 mg ml−1 achromopeptidase. The sample was incubated for 2 h at 37 °C and then carried forward using the New England Biolabs protocol for HMW DNA extraction from bacteria using the Monarch HMW DNA extraction kit for tissue (New England Biolabs, T3060). Briefly, 20 µl of proteinase K was added and the sample was incubated at 56 °C with varied shaking speeds (1,900, 1,700, 1,400 or 650 rpm) using a Fisherbrand Heat/Cool Thermal Mixer II (Fisher Scientific). After 30 min, 10 µl of RNase A was added and the sample was incubated a further 10 min with shaking at the same speed. Then, 300 µl of protein separation solution was added and the sample was mixed by inversion for 1 min. The sample was centrifuged for 10 min at 16,000g and the upper phase was then transferred to a Monarch 2-ml tube using a wide-bore pipette tip. Two DNA capture beads were added, followed by 550 µl of isopropanol. The sample was mixed by gentle rotation using the Roto-therm Plus on the lowest speed setting for 5 min. The liquid was then discarded and the beads were washed twice with 500 µl of genomic DNA wash buffer. Finally, DNA was eluted by addition of 100 µl of elution buffer II and incubation at 56 °C for 10 min with 300-rpm agitation. The DNA solution was left to resuspend at 4 °C overnight.
DNA size-selection methodsElectroelution
The electroelution protocol was performed as previously described18 with minor modifications. Briefly, a 0.9% agarose gel was run in 0.5× TBE (VWR) at 6 V cm−1 for 2 h to size-select crude DNA extracts. The compression band containing HMW DNA was then excised, the gel slice was placed in dialysis tubing (Spectra/Por; 12,000–14,000-kDa molecular weight cutoff (MWCO)) and topped up with 0.5× TBE. DNA was then electroeluted in 0.5× TBE at 6 V cm−1 for 2 h. The gel slice was removed from the dialysis bag and the remaining liquid was concentrated to dryness against 25% PEG 8000 with 5 mM Tris pH 8. DNA was then rehydrated in the dialysis bag against 5 mM Tris pH 8 for isolation.
Sucrose gradient
Linear 10–40% sucrose gradients, with 10 mM Tris pH 8, were prepared using the freeze–thaw method48. Gradients were prepared by liquid nitrogen flash-freezing at the end of the day and immediately placed to thaw at 4 °C until use 22–24 h later. Two sizes of polypropylene tubes were used, 25 × 89 mm and 14 × 95 mm (Beckman), with 8-ml and 2.9-ml sucrose layers, respectively. Larger tubes were centrifuged using an SW28 rotor, while the smaller tubes were centrifuged using an SW40 Ti rotor. In both cases, centrifugation was at 4 °C, 40,000g for 16 h. After centrifugation, fractions were gently pipetted from the top of the tubes using wide-bore tips. Pulse-field gel electrophoresis was used to analyze the fractions. For shorter-fragment purification (that is, DNA from hot CTAB and Monarch 1,900 rpm), analysis was conducted using 0.9% agarose with 1× TAE at 6 V cm−1 for 4 h with a 5-s switch time. For ultralarge DNA, analysis was conducted using 0.9% agarose with 1× TAE at 6 V cm−1 for 16 h with a linear 3–7-s switch time. Ultralarge DNA from direct lysis was isolated using large tubes from fractions at 14 ml to 32 ml. Hot CTAB DNA was purified using small tubes from fractions at 2.5 ml to 4.5 ml. DNA from Monarch 1,900 rpm was purified using large tubes from fractions at 6 ml to 8.5 ml, aiming to isolate DNA ~40 kb in size.
Short fragment eliminator (SFE) kit
DNA size selection with the SFE kit (Oxford Nanopore EXP-SFE001) was performed according to the manufacturer’s instructions.
A-domain survey
DNA from gel-plug-extracted metagenomic DNA was isolated using the NucleoSpin gel and PCR cleanup kit (Macherey-Nagel) according to the manufacturer’s instructions. A-domain amplicon sequencing was performed as previously described49. Read counts were 1,424,301 for forest soil 1, 923,413 for forest soil 2, 551,873 for forest soil 3, 1,965,137 for forest soil 4, 717,416 for the muddy bog and 467,043 for the decaying tree. A-domain amplicons were trimmed to remove primer sequences using vsearch (version 2.28.1)50 fastx_filter and then assembled into operational taxonomic units (OTUs) clustered at 95% nucleotide similarity using vsearch cluster_size. A-domain OTUs for each soil were then compared across all samples at 95% similarity. Parallel processing was achieved using GNU parallel (version 20230922)51.
Nanopore ultralong DNA sequencing
Ultralong DNA sequencing kit V14 (SQK-ULK114) preparation was performed according to the manufacturer’s instructions. Three DNA inputs were attempted, one following Oxford Nanopore directions on the Monarch HMW DNA extraction kit for tissue extraction, the manufacturer-recommended protocol for Monarch HMW DNA extraction kit for tissue and sucrose gradient purification. An additional attempt using the Monarch extracted DNA input was tried with a slightly altered protocol; instead of heat-killing the fragmentation mix, proteinase K was added to 1 mg ml−1 for 1 h at room temperature, followed by the addition of 3 mM PMSF for 1 h at room temperature to inhibit the proteinase K before continuing the protocol.
Nanopore ligation kit sequencing
Oxford Nanopore’s ligation sequencing kit V14 (SQK-LSK114) was used to prepare sequencing samples, with DNA extraction and size selection as indicated, according to the manufacturer’s instructions and minor modifications. Input DNA was increased to 3 µg, blunting and end-repair mix reaction incubation times were extended to 15 min at 20 °C and 10 min at 65 °C and adaptor ligation incubation time was increased to 30 min. Library solution was used for all samples and the DNA concentrations loaded are indicated in Supplementary Table 2. On the basis of our optimization experiments, the 1,700-rpm Monarch isolation and SFE size-selection protocol applied to 62.5 g of the forest soil would be sufficient to generate >2 Tbp of sequence.
Bioinformatic analysisSequencing
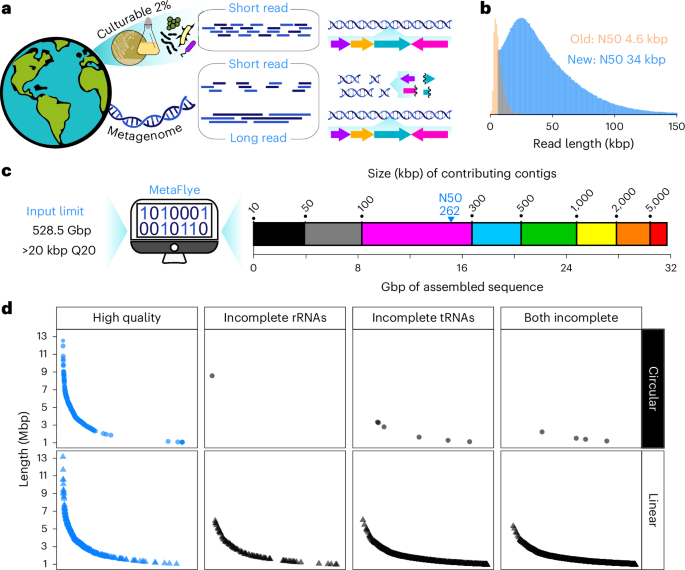
PromethION R10.4.1 flow cells were used to generate all of the sequencing data. Nanopore sequencing was conducted using a P2 solo with MinKnow 23.04.6 (ultra kits) or 23.11.4 (Ligation kits) and a P24 with MinKnow 23.07.12 (scaled ligation). All raw data were duplex-basecalled with standalone Dorado 0.4.1 + 6c4c636 for subsequent analysis.
Global assembly
The longest, highest-quality reads (>20 kbp, Q20+) were extracted from the 2.5-Tbp sequence dataset using Chopper (version 0.6.0)52. The resulting 528.5-Gbp dataset was assembled using Flye (version 2.9.3-b1797) in metagenomic mode (metaFlye) with parameters ‘–nano-hq –i 0 –threads 64 –meta’ (ref. 19). The assembly was run on Rockefeller University’s large-memory high-performance computing node (64 cores, 3 TB of RAM) and took just under 8 days to complete with RAM usage peaking at 845 GB. The assembly was polished once (the emerging best practice53) with Medaka (version 1.11.3; https://github.com/nanoporetech/medaka) and annotated by Bakta (version 1.10.4)54. Assembled contigs > 1 Mbp were extracted and their taxonomy assigned using the GTDB toolkit (GTDB-tk version 2.4.0)55 classify workflow with GTDB release 09-RS220. The presence of rRNA was detected within the Bakta annotation using a GNU AWK script (version 5.3.0), while tRNAscan-SE (version 2.0.9) was used to quantify total unique tRNAs. A set of 563 contigs > 1 Mbp were identified containing all rRNAs and at least 18 unique tRNAs to establish the complete or near-complete metagenomic genome dataset. The dataset was then frame-shift-corrected using proovframe56 and completeness was estimated by CheckM (version 1.2.3)57. The taxonomic classification of these contigs was plotted as a Sankey diagram using the networkD3 R package 0.4 (Fig. 2a). AntiSMASH (version 6.1.1)58 results from the output JSON files were used to generate the appended BGC summaries. Subtrees expanding previously underexplored clades were generated by extracting the alignment information from the GTDB-tk classify workflow for desired sequences and plotting with FastTree (version 2.1.11)59 using default settings. Additional information was then manually added.
Targeted NRPS assembly
HMMER (version 3.1b2)60 was used to scan the total sequencing dataset for AMP-binding domains using an available HMM (AMP-binding, Pfam PF00501.23). Reads containing AMP-binding domains were assembled (metaFlye), polished (Medaka) and annotated (Bakta), as described above. The AMP-binding domain search using HMMER was repeated on the assemblies to extract the subset containing at least four AMP-binding domains. Similar to the complete and near-complete genome assembly dataset, frameshifts were minimized using proovframe and then the subset was analyzed by antiSMASH (version 6.1.1). For analysis of NRPS content, the antiSMASH results were analyzed by BiG-SCAPE (version 1.1.5) to generate Fig. 3a. The phylogeny of NRPS containing BGCs was determined using the mmseqs2 (ref. 61) toolkit’s easy-taxonomy workflow and the National Center for Biotechnology Information nonredundant protein database.
16S rRNA analysis
Reads containing 16S rRNA sequences were extracted from the 2.5 Tbp of sequencing data using barrnap 0.9 (https://github.com/tseemann/barrnap). The 16S rRNA read subset was then assembled (metaFlye), polished (Medaka) and annotated (Bakta) as described above. Annotated 16S rRNA gene sequences were then extracted and, using vsearch, dereplicated and clustered at 99%, the recommended threshold for clustering full-length 16S sequences62. Lastly, to ensure full-length sequences, only OTUs between 1,400 and 1,700 bp were retained. The same extraction, dereplication and clustering process was used to identify 16S rRNA genes within the global assembly dataset. Phylogeny was assigned using mmseqs2 and the SILVA database (release 138.2)63.
Forest soil 1 cultured isolatesCulturing
Forest soil 1 microorganisms were isolated using the nycodenz method with the last two washes replaced with Dulbecco’s PBS (DPBS; Gibco). The purified suspension was diluted to 0.05 OD600 in DPBS and 200 µl was spread on individual agar plates (150 mm × 15 mm). Ten plates each were used with three different media: R2A agar (Fisher Scientific), which was previously used to isolate the Aquella species27, and two versions of dilute nutrient broth (Criterion). In one case, nutrient broth was diluted 200-fold compared to the manufacturer’s recommendation; in the second case, dilute nutrient broth was with supplemented 1:1 (v/v) with soil extract64. In all cases, nystatin (50 µg ml−1) was added to limit fungal growth. Plates were incubated at 30 °C with R2A colonies picked after 3 days and nutrient broth colonies picked after 10 days. Attempting to maximize isolate diversity, colonies were picked to maximize different morphologies. Liquid R2A or unmodified nutrient broth were used to culture isolates for sequencing (3 ml, 30 °C, 200-rpm shaking).
Genomic DNA extraction and sequencing
Bacterial cells were pelleted from turbid cultures (1–1.5 ml) by centrifugation for 1 min at 20,000g. The supernatant was removed and the cell pellets were caried forward for genomic DNA isolation using the PureLink microbiome DNA purification kit (Thermo Fisher Scientific) as per manufacturer’s instructions for soil samples with elution volume lowered to 50 µl. Oxford Nanopore’s native barcoding kit 24 V14 (SQK-NBD114.24) was used as per the manufacturer’s instructions to prepare sequencing samples. From R2A medium culturing, 22 genomes were individually barcoded and sequenced. From nutrient medium culturing, 20 genomes were individually barcoded and 12 were barcoded as pools of three. Each medium set was sequenced using a PromethION flow cell.
Bioinformatics
Isolate genomes were assembled using Flye with Medaka polishing and Bakta annotation. Genome assemblies were dereplicated by extracting 16S rRNA genes, clustering sequences at 99% identity and then selecting a single assembly per cluster. This yielded 30 genomes (Supplementary Table 7). BGCs were identified in each dereplicated cultured genome using antiSMASH. Large NRPS BGCs (that is, ≥4 A domains) were compared to those from the targeted metagenomic assembly using mmseqs2. Matches are shown in Supplementary Fig. 3.
SynBNP predictions
SynBNP prediction was carried out according to our standard workflow65. Briefly, ‘bioinformatically tractable clusters’ were identified and their products were predicted as follows. BGCs were scanned for NRPS domains and modules. The order in which these domains are likely to function was predicted on the basis of canonical NRPS module organization combined with the principle of collinearity. The following BGCs were then removed: (1) BGCs lacking predicted initiation or termination domains; (2) BGCs with modules that do not follow canonical NRPS domain organization (that is, condensation domain, A-domain and thiolation domain); (3) BGCs rich in tailoring genes; and (4) BGCs having fewer than four A domains, as these make poor synBNP targets. Structure predictions were then generated on the basis of A-domain specificity and derived structural modifications predicted on the basis of an analysis of additional domains present in the BGC (for example, epimerization and N-methylation). These data were combined on the basis of the initial domain order analysis to generate the linear structure encoded by a BGC. Specificity codes were compared to both the antiSMASH output and an in-house specificity code table collated from previously characterized natural products. The highest A-domain matches were solely considered for predictions. In rare cases where multiple amino acids share the same code, one was selected from the consensus of predictions generated by NRPSPredictor2 within antiSMASH. If multiple predictions were tied after the consensus stage, one was selected at random. The set of bioinformatically tractable clusters considered and their corresponding predictions are given in Supplementary Table 8. This represented roughly 19% of detected NRPS BGCs. On average, A domains matched at 90.1% ± 13.9%. The average A-domain match per peptide was 89.9% ± 8.0%. From the subset of predictions that contained at most one <70% A-domain specificity code (~83% of the predictions passed this cutoff), we randomly selected 20for synthesis. These covered a range of phylogenetic classifications (Fig. 3b and Supplementary Table 9). Contig_44957 had two mismatched codes but was retained as the codes were closely related and predicted to specify the same amino acid. While we used a cutoff of NRPs containing at most a single A-domain that matched <70%, this can be loosened or more restrictive if desired. A breakdown of predictions that passed different cutoff levels is provided in Supplementary Table 10.
SynBNP synthesis
Reagents and solvents used for synthesis were obtained from commercial sources and used without further purification. Chromatography solvents were of high-performance liquid chromatography (HPLC) grade or higher. Peptides were purified using a CombiFlash EZ Prep purification system with ultraviolet detection and equipped with a RediSep gold HP C18 column (30 g), RediSep gold HP C8 column or Phenomenex Luna 5 µm C18 prepHPLC column using a 5–95% acetonitrile–water gradient supplemented with 0.1% formic acid. High-resolution mass spectrometry (HRMS) data were acquired on a SCIEX ExionLC ultra-HPLC (UPLC) instrument coupled to an X500R quadrupole time-of-flight mass spectrometer with a Phenomenex Kinetex PS C18 100-Å column (2.1 mm × 50 mm, 2.6 µm) and analyzed using SCIEXOS software. 1H and 13C nuclear magnetic resonance (NMR) spectra were obtained on a Bruker Avance DMX 600-MHz spectrometer equipped with cryogenic probe (Rockefeller University) and all spectra were analyzed using MestRe Nova software.
Linear peptides were synthesized using standard Fmoc-based solid-phase peptide synthesis (SPPS) methods. 2-Chlorotritylchloride resin (0.1 mmol) was swollen in dichloromethane (DCM) at room temperature for 30 min. After draining, the resin was washed with DCM (three washes, 5 ml each). The C-terminal Fmoc-protected amino acid (four equivalents, 0.4 mmol) was dissolved in 5 ml of DCM and treated with N,N-diisopropylethylamine (DIPEA; five equivalents, 0.5 mmol). This mixture was added to the swollen resin and agitated for 1 h. The solution was drained and the resin was washed with DCM (three washes, 5 ml each). The resin was then capped by treatment with a 17:2:1 mixture of DCM, methanol and DIPEA. The resin was agitated for 30 min, drained and washed with DCM (three washes, 5 ml each) and dimethylformamide (DMF; three washes, 5 ml each). For peptide couplings, the Fmoc group was removed by treating the resin with 20% piperidine in 5 ml of DMF for 7 min. The solution was drained, the deprotection reaction was repeated and the resin was washed with DMF (five washes, 5 ml each). The next Fmoc amino acid to be coupled (three equivalents, 0.3 mmol) and hexafluorophosphate azabenzotriazole tetramethyl uronium (HATU; three equivalents, 0.3 mmol) was dissolved in 4 ml of DMF and treated with DIPEA (three equivalents, 0.3 mmol). This solution was added to the resin and agitated for 45 min. The solution was drained and the resin was washed with DMF (three washes, 5 ml each). This deprotection and coupling process was repeated for each subsequent amino acid. Finally, the N-terminal Fmoc amino acid was deprotected with 20% piperidine in DMF (two cycles of 5 ml for 7 min) and reacted with myristic acid (three equivalents, 0.3 mmol), HATU (three equivalents, 0.3 mmol) and DIPEA (three equivalents, 0.3 mmol) in DMF (4 ml). The reaction was agitated for 45 min, at which point the resin was washed with DMF (three washes, 5 ml each) and DCM (three washes, 5 ml each). The peptide was cleaved from resin and the side-chain-protecting groups were removed by treating the resin with a trifluoroacetic acid (TFA) cleavage cocktail containing 95% TFA, 2.5% water and 2.5% triisopropylsilane for 2 h. The solution was evaporated under air flow and the resulting residue was purified on a CombiFlash EZ Prep system (30-g HP C18 column, water–acetonitrile with 0.1% v/v formic acid 5%–95%).
Peptides cyclized through the side chain of an amino acid were synthesized starting from the penultimate amino acid following the same Fmoc SPPS loading, Fmoc deprotection and coupling procedures described above. Side-chain serine and threonine residues at which cyclization was predicted to occur were added to the peptide with the side chain unprotected. After the N-terminal amino acid was deprotected, myristic acid was coupled to the terminal amine as described above (for peptides not predicted to have a lipid tail, the Boc-protected N-terminal amino acid was coupled). Next, the C-terminal amino acid was esterified onto the free serine or threonine side chain by adding a solution of Fmoc amino acid (15 equivalents, 1.5 mmol), N,N′-diisopropylcarbodiimide (DIC; 15 equivalents, 1.5 mmol) and 4-dimethylaminopyridine (DMAP; 0.5 equivalents, 0.05 mmol) in 5 ml of DMF to the resin and agitating for 16 h. The solution was drained and the resin was washed with DMF (three washes, 5 ml each) and DCM (three washes, 5 ml each), followed by deprotection of the Fmoc group using 20% piperidine in DMF (two cycles of 5 ml for 7 min). The linear precursor peptide was gently cleaved from resin by treating with a solution of 20% hexafluoroisopropanol in 6 ml of DCM for 45 min. The solution was collected and the process repeated once more. After removal of solvent under air flow, the resulting peptide was dissolved in DMF (50 ml, 0.002 M) and treated with (7-azabenzotriazol-1-yloxy)tripyrrolidinophosphonium hexafluorophosphate (seven equivalents, 0.7 mmol) and DIPEA (30 equivalents, 3 mmol). After stirring for 2 h, the solution was diluted with ethyl acetate and washed with brine (three washes, 100 ml each). The organic layer was dried (Na2SO4), filtered and concentrated in vacuo. The resulting cyclic peptide was globally deprotected by treatment with TFA cleavage cocktail for 2 h. After evaporation under air flow, the crude cyclic peptide was purified on a CombiFlash EZ Prep system as described above.
Peptides cyclized through the fatty acid were synthesized starting from the penultimate amino acid residue following the Fmoc SPPS method described above. After synthesis of the linear precursor was completed, the N-terminal Fmoc group was removed using 20% piperidine in DMF (two cycles of 5 ml for 7 min) and reacted with (±)-3-hydroxymyristic acid (three equivalents, 0.3 mmol), HATU (three equivalents, 0.3 mmol) and DIPEA (three equivalents, 0.3 mmol) in DMF (4 ml). The reaction was agitated for 45 min, at which point the resin was washed with DMF (three washes, 5 ml each) and DCM (three washes, 5 ml each). Next, the C-terminal amino acid was esterified onto the hydroxyl group of the fatty acid by adding a solution of Fmoc amino acid (15 equivalents, 1.5 mmol), DIC (15 equivalents, 1.5 mmol) and DMAP (0.5 equivalents, 0.05 mmol) in 5 ml of DMF to the resin and agitating for 16 h. The solution was drained and the resin was washed with DMF (three washes, 5 ml each) and DCM (three washes, 5 ml each), followed by deprotection of the Fmoc group using 20% piperidine in DMF (two cycles of 5 ml for 7 min). The linear precursor was cleaved from resin, cyclized, deprotected and purified as described above.
Successful peptide synthesis was confirmed by UPLC, HRMS and/or NMR (Supplementary Table 15 and Supplementary Figs. 6–9). All compounds that displayed antibacterial activity were confirmed to have >95% purity.
MIC assay
To avoid solubility issues, each synBNP concentration was prepared individually in DMSO before addition to LB. A series of eight concentrations were tested, with the last one being a DMSO only control. First, the synBNP was diluted to 3.2 mg ml−1 in DMSO and then serially diluted twofold six times in DMSO. Then, 4 µl of each concentration was added to 100 µl of LB dispensed across a 96-well plate (Costar, 3370). Test bacteria were grown overnight shaking at 200 rpm at 30 °C and the culture was diluted to an OD600 of 0.005. Next, 100 µl of the dilution was added to the antibiotic dilution series, yielding a test range of 64 to 1 µg ml−1 along with a control (0 µg ml−1). The plate was then incubated statically at 30 °C for 18 h, followed by visual inspection. The MIC was determined as the lowest concentration within the dilution series that did not exhibit turbidity. MICs were determined by two biologically independent replicates for the initial synBNP screen and three independent replicates for all other determinations.
Human cell toxicity assay
The inhibitory activity of synBNPs was assessed using a 3-(4,5-dimethylthiazol-2-yl)-2,5-diphenyltetrazolium bromide (MTT) assay66. HEK239 and HeLa cells were cultured in DMEM supplemented with 10% FBS, 10 µg ml−1 penicillin–streptomycin, 2 µM glutamine and nonessential amino acids. Cells were passaged and seeded in 96-well plates at the exponential growth phase, inoculated at ~1 × 10⁵ cells per ml and maintaining a cell density below 1 × 10⁶ cells per ml. The plates were incubated at 37 °C with 5% CO2. All assays were performed using 5,000 cells per well, with 50 µl of a homogeneous cell suspension at 1 × 10⁵ cells per ml seeded in each well. For screening, synBNPs were diluted to 6.4 µg ml−1 in DMSO to prepare a 200× stock solution. For the high-concentration assays (32 µg ml−1), 1.5 µl of synBNP stocks were used to prepare a master solution by dilution in 150 µl of DMEM without phenol red. Two 50-µl aliquots of the master solution were added to cell-seeded plates, obtaining duplicate 100-µl wells with synBNPs at 32 µg ml−1 (0.5% DMSO). For the low concentrations (3.2 µg ml−1), 15 µl of the master solution was diluted to 150 µl with DMEM and 50 µl was added to cell-seeded plates to obtain duplicate wells of 100 µl at 3.2 µg ml−1 (0.05% DMSO). DMEM solutions containing 0.5% and 0.05% DMSO were used as vehicle controls to define 100% cell viability. Camptothecin at 40 µg ml−1 was used as a positive control to define 0% cell viability. After treatment, plates were incubated for 48 h followed by addition of 10 µl of 5 mg ml−1 MTT solution in DPBS and the plate was incubated for an additional 4 h (SK-N-SH was incubated for 5–6 h). After incubation, 90 µl of solubilization solution (40% DMF, 16% SDS and 2% acetic acid) was added to each well and formazan crystals were allowed to dissolve overnight. The absorbance of each well was measured at 570 nm using a TECAN Infinite M NANO+. Absorbance values were normalized to the positive and negative controls and percentage survival values were calculated.
Kill curve assay
S. aureus SH1000 was streaked onto a LB agar plate and incubated overnight at 30 °C. Three independent colonies were then inoculated into 3 ml of LB and grown overnight at 30 °C with shaking at 200 rpm. The cultures were diluted 1:100 and grown at 30 °C and 200 rpm until they reached an OD600 between 0.4 and 0.6. The growing cultures were then diluted into a preprepared series of 3 ml of LB containing the indicated antibiotic concentrations to ~6 × 10⁶ colony-forming units (cfu) per ml using the expectation that 1 OD600 of S. aureus contained 5 × 10⁸ cfu per ml. When a series was inoculated, a 100-µl sample was taken, representing 1 min of treatment. The cultures were then placed shaking at 200 rpm and 30 °C and samples were taken at 10 min, 30 min, 1 h and then every subsequent hour for a total of 6 h. For cfu quantification, 100-µl samples were placed immediately into the top well of a 96-well plate and serially diluted tenfold (20 µl into 180 µl of LB) down to 10−7. Then, 6 µl of each dilution from the series was spotted onto LB agar, the spots were air-dried and the plate was incubated overnight at 30 °C. Resulting colonies were enumerated to calculate the cfu per ml.
Mutant isolationDirect plating
S. aureus SH1000 was streaked onto an LB agar plate and incubated overnight at 30 °C. A single colony was inoculated into 3 ml of LB and grown to confluence overnight at 30 °C. The culture was then diluted to roughly 1 × 10⁷ cells per ml in LB containing antibiotic at 8× MIC. Five 96-well plates were then seeded with 100 µl of the dilution and grown stationary overnight at 30 °C. Mutants appeared as small colonies at the bottom of the well and were picked into fresh 8× MIC medium to ensure resistance. The confirmation culture was then streaked onto LB agar and incubated overnight at 30 °C; two colonies per mutant were inoculated for an overnight culture in LB at 30 °C. The MIC of each mutant was checked to confirm resistance. For erutamicin, no resistant colonies appeared and the direct plating was repeated at 4× and 2× MIC concentrations, which also did not produce resistant mutants.
Passaging
S. aureus SH1000 and A. baumannii ATCC 17978 were streaked onto LB agar and incubated overnight at 30 °C. Three independent colonies for each of the bacteria were then inoculated into 3 ml of LB and grown overnight at 30 °C with shaking at 200 rpm. The cultures were used to prepare a MIC assay as described above with the indicated antibiotics. The following day, 1 µl was taken from the well containing the highest concentration of antibiotic exhibiting turbid growth and mixed into 1 ml of fresh LB. This dilution was used to seed a new MIC assay. This was repeated for each subsequent day and the change in MIC was plotted.
Mutant sequencing and identification
Genomic DNA from resistant mutants was extracted for sequencing using the PureLink microbiome DNA purification kit (Thermo Fisher Scientific) per the manufacturer’s instructions. Isolated DNA was then Illumina-sequenced using standard Nextera preparation and the MiSeq reagent kit v3 with 2× 300-bp reads. Reads for both parent and mutants were mapped to a reference genome using minimap2 (version 2.28-r1209)67. Changes detected in the parent strain were eliminated from consideration and mutations were uncovered using snippy (https://github.com/tseemann/snippy).
ClpX expression vector
The clpX gene was amplified from S. aureus SH1000 genomic DNA by PCR using the primers ClpXF (TATTACTCGAGATGTTTAAATTCAATGAAGATGAAG) and ClpXR (TAATAGGATCCACATCAATGATTAAGCTGATG). The pET19b (Sigma) vector backbone was amplified by 19BF (TAATAGGATCCGAAAGGAAGCTGAGTTGG) and 19BR (TATTACTCGAGCATATGCTTGTCGTCGTCGTC). The two PCR products were then digested with XhoI and BamHI and ligated together; the ligation reaction was transformed into E. coli EPI300 for colony screening on LB agar plates containing 100 µg ml−1 carbapenem. The successful construction of the ClpX expression vector pHisClpX (which added a 10× His tag to the N terminus of ClpX) was confirmed by Sanger sequencing performed by Genewiz using the universal T7 primer.
ClpX expression and purification
The pHisClpX vector was transformed into E. coli Rosetta 2(DE3) (Sigma) and a single colony was inoculated into 5 ml of LB containing carbapenem to grow overnight at 37 °C and 200-rpm shaking. The overnight culture was then added to 1 L of LB + carbapenem prewarmed to 37 °C and grown at 37 °C and 200-rpm shaking until an OD600 of 0.2–0.4. Once the desired OD range was achieved, the culture was transferred to 16 °C and 200-rpm shaking for 30 min, after which IPTG was added to 1 mM to induce protein expression, which continued overnight at 16 °C and 200 rpm. The culture was pelleted by centrifugation at 4,000g for 45 min and the cell pellet was resuspended in 10 ml of protein lysis buffer (50 mM Tris pH 7.5, 100 mM NaCl, 5 mM imidazole, 0.1 mM EDTA and 1 mM β-mercaptoethanol). The suspension was sonicated using a Fisherbrand sonicator for a total of 7.5 min of sonication time, with 45 s on and 45 s off at 45% amplitude. The sonicated suspension was then centrifuged at 4,000g for 30 min. The supernatant was then centrifuged at 23,000g for an additional 30 min. The His-tagged ClpX was isolated from the cleared supernatant using Ni-NTA agarose (Quiagen) according to the manufacturer’s instructions. Briefly, a column containing 2 ml of Ni-NTA was washed with 20 ml of protein lysis buffer, followed by passage of the cleared lysate. Bound ClpX was then washed with 20 ml of increasing concentrations of imidazole in protein lysis buffer (10 mM, 20 mM and 30 mM), followed by elution with protein lysis buffer containing 250 mM imidazole, while collecting 0.5-ml fractions. The protein content in the eluted fractions was checked by absorbance at 280 nm, with any fractions at an OD > 0.6 pooled together. About 1 ml of the pooled fractions were then dialyzed (MWCO: 12,000–14,000 kDa; Spectra/Por) against 1 L of protein storage buffer (50 mM Tris pH 7.5, 200 mM KCl, 25 mM MgCl2, 1 mM β-mercaptoethanol and 10% glycerol) for 3 h at 4 °C, followed by an additional dialysis against 3 L of protein storage buffer overnight. The protein concentration was then determined to be 5.83 mg ml−1 (117 µM) by spectroscopy at 280 nm with the calculation of 1 OD corresponding to 3.69 mg ml−1 of His-ClpX. A sample (50 ml) of the 3-L storage buffer after dialysis was saved for resuspending trigintamicin and its isomer for ITC.
ITC
ITC measurements were carried out at 25 °C using a Malvern ITC PEAQ system. The ligands (trigintamicin and its biologically inactive isoform) were dissolved in storage buffer taken post dialysis of ClpX. The concentration of ClpX was adjusted to ~30 μM and the ligand concentrations were adjusted to ~300 μM using the postdialysis storage buffer batch. Then, 300 μl of ClpX solution was placed in the sample cell and titrated by ligand solution through 19 successive injections of 2 μl with a 2.5-min interval between injections and a reference power of 5 μcal s−1. Titration data were analyzed using the PEAQ-ITC analysis software (version 1.41). The isotherm curves were best fitted to a single-site binding model.
Depolarization assay
An overnight culture of S. aureus SH1000 was pelleted, washed twice in equal volume of DPBS (Thermo Fisher Scientific) and diluted to 0.35 OD600 in DPBS. Then, 100 µl of the dilution was added to 300 µl of DPBS, followed by the addition of 50 µl of 20 µM DISC3(5) dye in DPBS. The mixture was incubated at room temperature in the dark for 15 min, followed by the addition of 50 µl of 2 M KCl and another 15-min incubation. The samples were then transferred into a 384-well flat, clear-bottom black microtiter plate with 30 µl per well. The initial fluorescence intensity of each well was recorded using a TECAN Infinite M NANO+ (excitation, 620 nm; emission, 675 nm) at 10-s intervals until the baseline stabilized. After signal stabilization, 30 µl of test compounds diluted in DPBS were added to the indicated concentrations and readings resumed. Gramicidin at 16 µg ml−1 (2× MIC) was used as a positive control for depolarization.
Lipid antagonism assay
Test lipids were dissolved in the manufacturer’s recommended solvent to 0.5–1 mg ml−1. An aliquot containing the appropriate amount of lipid for the desired molar ratio to a target antibiotic was transferred to a 1.5-ml Eppendorf and dried under vacuum for 1 h. The dried pellet was then resuspended by pipetting with 6 µl of the test antibiotic dissolved in ethanol at 1.28 µg ml−1. The suspension was then topped up with 114 µl of LB and the sample was mixed by pipetting. Then, 100 µl was transferred to a 96-well assay plate and 50 µl was transferred down a column to generate a 1:2 dilution series. An overnight culture of S. aureus SH1000 was diluted 1:1,000 into LB and 50 µl was added to the dilution series to generate a final antibiotic concentration range of 0.25 to 32 µg ml−1. The plate was then incubated overnight at 30 °C for 18 h, after which growth was visually inspected. For experiments with telomycin and daptomycin, all LB was supplemented with Ca2+ to 50 mg L−1 (183 mg L−1 CaCl2).
Reporting summary
Further information on research design is available in the Nature Portfolio Reporting Summary linked to this article.