
Defining the carcinogenic effect of mutations
We defined the carcinogenic effect of a mutation by its influence on the probability of a cell initiating a cancer that is eventually diagnosed. Consider two hypothetical cells, statistically identical except that one cell has mutation z while the other does not. The cell with mutation z initiates cancer at some rate (probability per unit time), r1, while the other cell initiates cancer at rate r0. The per-cell hazard ratio for cancer initiation given the mutation, w = r1 / r0, defines the carcinogenic effect of the mutation (Fig. 1a,b).
Fig. 1: Mutation frequencies in normal tissue and cancer genomes estimate carcinogenic effects.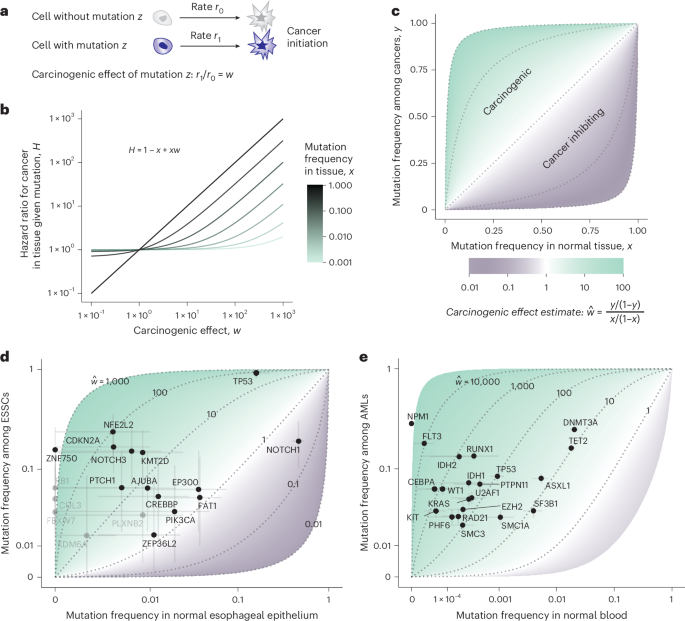 The alternative text for this image may have been generated using AI.
a, Carcinogenic effect definition. Cell with mutation z initiates cancer at rate r1. Cell without mutation z, otherwise statistically identical, initiates cancer at rate r0. The carcinogenic effect of mutation z is r1 / r0. b, Relationship between the carcinogenic effect of the mutation (x axis), fraction of cells with mutation in tissue (color) and cancer rate in tissue given the presence of the mutation, normalized by cancer rate without the mutation (y axis). c, Relationship between the carcinogenic effect of the mutation (light green, carcinogenic; gray, protective), fraction of normal cells with mutation among many people (x axis) and fraction of cancer founder cells with the mutation (y axis). d,e, Carcinogenic effects estimated per gene for ESSC and AML. d, Fraction of 63 ESSC samples with non-synonymous mutations or small indels in each gene (y axis; with jitter for visualization) against estimated fraction of cells mutated in patient-matched normal esophageal epithelium samples (x axis). Data from Yokoyama et al.18; genes exhibiting positive selection in ESSC are plotted. Genes mutated in fewer than five samples are light colored. e, Fraction of 2,340 AML samples23,24,25 with non-synonymous mutations or small indels in each gene (y axis) against estimated fraction of cells mutated in 2,410 age-matched normal blood samples21,22. AML driver genes from Bailey et al.26 are plotted. Horizontal and vertical error bars represent 95% bootstrap and binomial confidence intervals for mutation frequencies, respectively. Dotted lines indicate carcinogenic effect estimates.
The carcinogenic effect can also be conceptualized as an imaginary randomized controlled trial in which normal tissue cells from many people are randomly assigned or disallowed mutation z, and some of the cells subsequently transform to cancer. If fraction x of the normal tissue cells is assigned the mutation and fraction y of cancer founders carry the mutation, then the odds ratio
$$\hat{w}=\frac{y/(1-y)}{x/(1-x)}$$
(1)
of mutation frequencies in cancer relative to normal tissue estimates the carcinogenic effect of the mutation (Fig. 1c and Methods).
Cancer and normal tissue genomes estimate carcinogenic effects
Mutations can never be artificially induced in humans to test causality; therefore, the carcinogenic effect, by our definition, can never be perfectly measured. Nevertheless, the hypothetical experiment that defines carcinogenicity has a measurable natural analog provided by the genetic heterogeneity of human tissues, whereby some cells carry mutation z while others do not. The frequency, x, of mutation z among normal tissue cells can be estimated from deep sequencing of normal tissue samples, while the frequency, y, of mutation z among cancer founder cells can be estimated by the fraction of cancers in which mutation z is clonal, enabling calculation of the odds ratio (equation 1).
It is important to emphasize that somatic evolution does not necessarily distribute the mutation among cells independently of other variables that might influence carcinogenesis. If the presence of a mutation in a normal tissue cell is associated with another variable that causes cancer (such as another mutation), then the odds ratio of that mutation in cancer relative to normal tissue (Equation 1) could overestimate or underestimate the carcinogenic effect, depending on whether the association is positive or negative. See Supplementary Notes 1 and 2 for mathematical discussions of confoundment. With this caveat in mind, we used the odds ratio as a rough, practical estimate for the carcinogenic effect.
We turned first to the esophagus, a tissue whose somatic evolution is relatively well documented. Yokoyama et al.18 performed targeted sequencing of purported driver genes among 68 ESSC samples and 68 physiologically normal esophagus samples from the same 68 patients. For a fair comparison of malignant and non-malignant cells, we excluded five patients with shared mutations between cancer and ‘normal’ samples. Then, focusing on non-synonymous mutations and insertions and deletions (indels), we compared mutation frequencies between ESSC and the normal esophageal epithelium to estimate carcinogenic effects per gene (Fig. 1d). A limitation of our estimates is that we do not distinguish the carcinogenic effects of different mutations within a gene, which would be possible with larger datasets.
The resulting panorama showcases a spectrum of cancer-causing potency among genes (Fig. 1d). TP53 and NFE2L2 have carcinogenic effect estimates standing in the hundreds, while NOTCH1 mutations inhibit carcinogenesis. Several other purported cancer driver genes (for example, EP300, FAT1, PIK3CA) have carcinogenic effect estimates in the statistical vicinity of one, despite exhibiting strong signals of positive selection in ESSCs18. The estimate for PIK3CA is compatible with a recent mouse study showing only a modest cancer-causing effect20. Overall, our estimates support that cancer causation and positive selection in the esophagus are not equivalent.
Next, we turned to the blood. We compared mutation frequencies in 2,410 normal blood samples21,22 to 2,340 acute myeloid leukemia (AML) samples23,24,25 with the same age range (36–103 years; see Methods). We focused on 21 genes that were sequenced in all normal blood and AML studies and that are part of a standard list of AML driver genes26. As in the esophagus, we estimated a wide span of carcinogenic effects in the blood (Fig. 1e and Extended Data Fig. 1a): approximately ten for the most common clonal hematopoiesis driver genes ASXL1, DNMT3A, TET2 and SF3B1, and approximately 100 for TP53; meanwhile, mutations in FLT3, CEBPA, IDH2 and WT1 increase the transformation rate of a cell by about 800-fold to 10,000-fold. The most frequently mutated gene in AML, yet unmutated in the normal blood data, is NPM1, indicating an exceptionally powerful carcinogenic effect. Our estimates of the effects of mutations on leukemogenesis broadly agree with associations between normal blood mutations and subsequent AML development21,27,28 (Extended Data Fig. 1b–e), supporting the consistency of our framework against a broader repertoire of data.
We note that carcinogenic effect estimates are higher for the blood than for the esophagus. One conceivable explanation for this difference is that copy number alterations, rather than single nucleotide variants and small indels (SNVs/small indels), are more important for esophageal carcinogenesis. It could also be that a greater number of mutations is required for—and therefore each mutation contributes less to—ESSC than AML. There is also a technical difference between the cancer types: the normal esophagus samples are patient-matched to the cancer samples, whereas the normal blood samples are from people with no history of blood malignancies. The blood analysis is therefore more exposed to confounding variables. People who develop AML may statistically differ from those who do not with respect to multiple variables, such as smoking, diet or germline genetics, which may influence mutation frequencies in normal blood29,30,31 and the propensity of an individual to develop AML, potentially biasing our estimates.
For AML and ESSC, cancer samples have mutation burdens similar to normal tissue (Extended Data Fig. 1f,g), suggesting that mutagenesis is not a major source of bias in our estimates. However, other cancers such as colorectal cancer may have a far greater mutation burden than normal tissue32 (Extended Data Fig. 1h). We focused on 1,724 colorectal cancer samples (from COSMIC33) for which the mutation burden is in the same range as 1,387 normal colonic crypts14,34, and we used a logistic regression model with mutation burden and age as covariates to estimate carcinogenic effects (Methods and Extended Data Fig. 1i,j). Again, we measured a large range: TP53, APC, KRAS and PIK3CA mutations have carcinogenic effects in the hundreds, FBXW7 and PTEN appear one order of magnitude less important, while ARID1A has a carcinogenic effect that does not significantly differ from one.
For the future, normal tissue studies with larger cohorts and error-corrected sequencing35,36,37,38,39 will enable increasingly well-controlled and high-resolution quantifications of the effects of mutations, both on clonal expansion in normal tissue and on the risk of cancerous transformation in a cell. However, the need to determine cancer causation is immediate. For now, cancer genetic data are copious while normal tissue data remain limited. We therefore endeavored to disentangle causation and selection from cancer genomes without a normal tissue control.
An evolutionary model predicts age-dependent cancer genetics
In the remainder of the paper, we explore whether the age of patients with cancer can be used to distinguish selection and causation. We hypothesized that (1) mutations that are positively selected but not carcinogenic appear preferentially in older patients with cancer, because these mutations accumulate in our aging normal tissues and are passively inherited to cancer, and (2) potent cancer-causing mutations appear preferentially in the cancer genomes of younger patients, because these mutations accelerate the onset of carcinogenesis (Fig. 2a).
Fig. 2: Selection and carcinogenicity differentially shape the age distributions of mutations in cancers.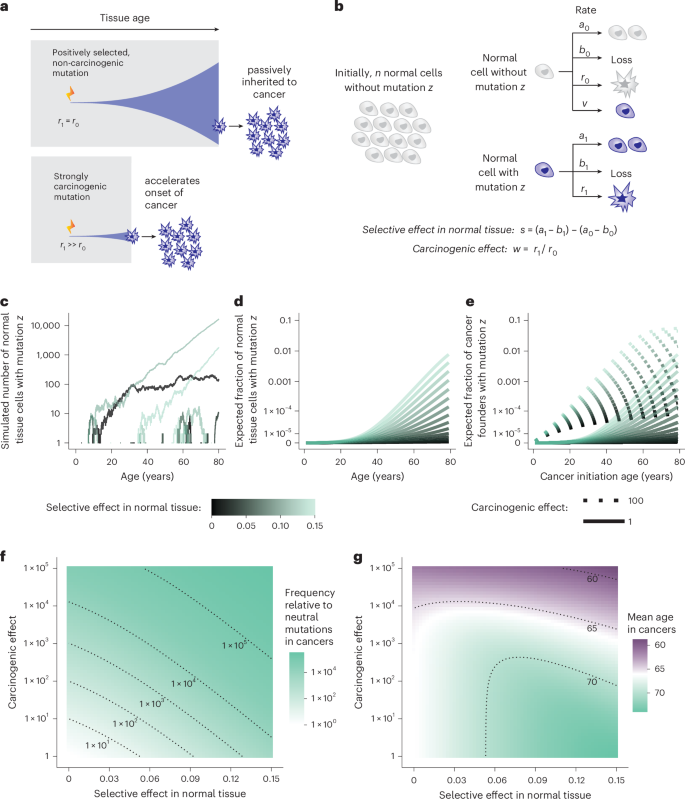 The alternative text for this image may have been generated using AI.
a, Conceptual cartoon of how patient age might distinguish carcinogenic mutations from non-carcinogenic mutations. Top, non-carcinogenic mutation that is positively selected in normal tissue occupies an increasingly large proportion of normal tissue towards older age. Cancer originates from a cell carrying a mutation with a probability equal to the frequency of that mutation in the tissue. Bottom, a strongly carcinogenic mutation accelerates the onset of cancer. b, Branching process model of a somatic evolution in normal tissue that illustrates stochastic cell division, loss (through death or differentiation), acquisition of mutation z and cancer initiation. The difference between the growth rate of cells with and without mutation z is the selective effect in normal tissue. The ratio of rates at which cells with and without mutation z initiate cancer is the carcinogenic effect. c, Simulations of the number of cells with mutation z in normal tissue, according to the branching process model shown in b. Each line represents a clone that initiates at an age uniformly distributed between 0 and 80 years. d,e, Theoretical mutation frequency among normal tissue cells (d) and cancer-initiating cells (e) as a function of the selective effect of the mutation in normal tissue, carcinogenic effect and tissue age. f, Selection in normal tissue and cancer causation lead to similar mutation frequencies in cancer genomes. Colors represent the frequency of cancer with mutation z divided by the frequency of cancer with a neutral mutation of the same acquisition rate. g, Selection in normal tissue and cancer causation lead to differing age distributions for mutations in cancer genomes. Colors represent the mean patient age of cancers carrying mutation z. In c–g, parameter values: lifespan, 80 years; stem cell pool size, n = 105; mutation rate per year, v = 10−8; division and loss rate, a0 = b0 = 1 per year without mutation and a1 = 1 + s, b1 = 1 with mutation; baseline carcinogenesis rate, r0=10ut3, where u is uniformly distributed on (−16,−13), caricaturing that cancer risk rises with age and varies between people.
To express the hypothesis quantitatively, we formulated a branching process model of somatic evolution (Fig. 2b,c). The model illustrates a tissue that stochastically acquires a mutation, and that mutation may edit the rate of cell division, death, differentiation or transformation to cancer. This model minus the carcinogenesis component has been applied to somatic blood evolution15,29,40, with predictions largely consistent with thousands of blood samples15,22,40. For other tissues, the model can be prudently considered a cartoon.
We calculated the expected frequency of mutation z among normal tissue cells (Fig. 2d) and among cancer-initiating cells (Fig. 2e and Extended Data Fig. 2a), observing increasing mutation frequencies towards older ages. Then, collating ages, we calculated the odds ratio for the presence of mutation z in cancer genomes relative to a neutral mutation with the same mutation rate, mimicking dN/dS in cancer genomic analyses. This statistic has a positive relationship with both the selective effect in normal tissue and with the carcinogenic effect (Fig. 2f and Extended Data Fig. 2a), illustrating that dN/dS alone cannot distinguish selection from causation.
Next, to assess the preference of mutation z towards younger or older cancer genomes, we calculated the mean age of patients whose cancers carry mutation z. We found that for a carcinogenic effect of 1 (no cancer causation), the selective effect in normal tissue and mean age have a positive relationship, whereas for any specific selective effect, the carcinogenic effect and mean age have a negative relationship (Fig. 2g and Supplementary Note 3). Although the precise numerical details of these relationships are sensitive to other somatic evolutionary parameters, which may vary greatly between tissues, the directionality of the relationships is robust (Extended Data Fig. 2b).
Our simple model predicts that the selective and carcinogenic effects of a mutation influence the age distribution of patients with the mutation, and, thus, differences between mutations in their effects should lead to age-dependent mutational profiles of cancers. However, age-dependent cancer genetics could also have other explanations. We note a complication to the model: it could be that the carcinogenic effects of the mutation are themselves age-dependent. Age-dependent effects might arise, for example, from mutational interactions with the aging epigenetic state of stem cells, or with other somatic mutations that accumulate with age or as a result of age-dependent cell-extrinsic factors. Relatedly, young patients with cancer might be more likely to have cancer-predisposing germline mutations, potentially interacting with specific somatic mutations. Overall, there are several possible reasons to expect that driver mutation frequency spectra differ between older and younger patients with cancer41,42. Careful empirical investigation is therefore required to assess whether age distributions may help to distinguish selection and causation in real-world cancer data.
Hence, we asked whether (1) patient age distributions can differentiate mutations and (2) age differences between mutations can be explained by age-dependent carcinogenic effects. Ideally, the answers to (1) and (2) would be positive and negative, respectively, inviting the next two questions: whether (3) powerful carcinogenic mutations are found preferentially in younger patients with cancer, and (4) mutations that are positively selected in normal tissue are found preferentially in older patients with cancer. We begin with question (1).
Cancer types differ in age divergence between driver genes
That cancer genome alterations depend on age has already been established for many cancer types41,42,43,44. To quantify the degree of age divergence between purported driver genes per cancer type in COSMIC33, we calculated the variance between purported driver genes (using an established list of driver genes26) of patient ages at which non-synonymous SNVs/small indels appear, normalized by the overall variance of the patient age distribution. Comparing cancer types, we observed varying age divergence between driver genes, with esophageal and colorectal cancers exhibiting relatively little and AML exhibiting the most (Fig. 3a).
Fig. 3: Age distributions of AML mutations provide information on selection and carcinogenicity.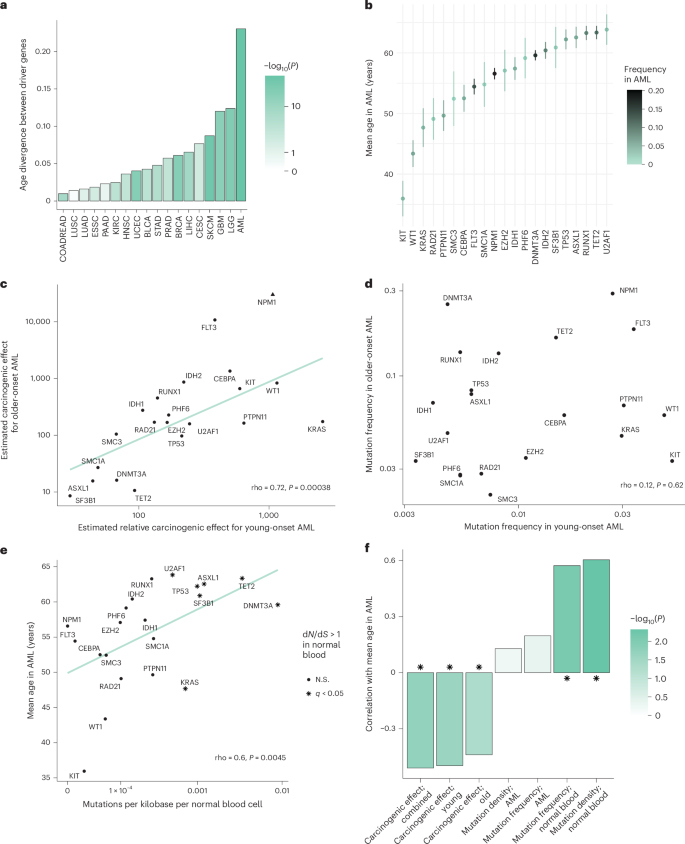 The alternative text for this image may have been generated using AI.
a, Among cancer types, AML exhibits the greatest age divergence between driver genes. The age divergence statistic is defined by the variance between driver genes of non-synonymous SNVs/small indels for patient age, normalized by the overall variance of patient age per cancer type (Methods). Cancer type-specific driver genes are listed in Bailey et al.26. P values (color) from the Kruskal–Wallis test of patient age versus driver gene. Data are from COSMIC (Methods). See Supplementary Table 3 for unabbreviated cancer types. b, Mean age of AML patients with non-synonymous SNVs/small indels per driver gene (Methods). Error bars are 95% confidence intervals. Four AML datasets were collated (Extended Data Fig. 3a). c, Carcinogenic effect estimates for older AML (Fig. 1e; mean age, 61 years, s.d., 12 years) versus relative carcinogenic effect estimates for younger AML (normalized by median carcinogenic effects in older AML; Extended Data Fig. 3; mean age, 11 years, s.d., 7 years). NPM1 has an infinite carcinogenic effect estimate for older AML, represented at finite value for visualization. The line represents regression excluding NPM1. Spearman’s correlation, rho = 0.72, P = 0.00038. d, Fraction of older-onset AML versus fraction of younger-onset AML samples with non-synonymous SNVs/small indels per gene. rho = 0.12, P = 0.62. e, Mean AML patient age for gene mutations versus number of mutations per gene per kilobase per normal blood cell (rho = 0.6, P = 0.0045). Mutation densities in normal blood were estimated from 2,410 samples21,22; donor age range, 36–103 years. Genes under positive selection in normal blood according to dN/dS > 1 with q < 0.05 (ref. 22) are denoted by a star shape; these genes have older mean AML patient ages (two-sided Wilcoxon test, P = 0.016). f, Mutation frequencies in normal blood (normalized and unnormalized by gene length; data as in e) and carcinogenic effect estimates (younger and older AML, and combined score; see Extended Data Fig. 3e) have distinct relationships with AML patient age, according to Spearman’s correlation among driver genes. Mutation frequencies in AML (normalized and unnormalized by gene length) do not have a significant correlation with AML patient age. In c–f, P values are from two-sided tests, unadjusted for multiple hypothesis testing.
Indeed, it is well known that the genetic makeup of childhood and adult AMLs differs starkly45. For a higher-powered view of AML, we collated four datasets (including data in Fig. 1e and a pediatric AML dataset45) totaling 4,736 patients with AML ranging in age from 0 to 100 years (Extended Data Fig. 3a; see Methods). We calculated the mean patient age for non-synonymous SNVs/small indels per driver gene, observing wide separation of genes (Fig. 3b). For example, the mean age for KIT was 36 years, while the mean age for TET2 was 63 years. Given the age differences observed for these driver genes, and that normal somatic evolution has been documented far more comprehensively in the blood than in other organs, we decided that AML would be the ideal primary exploration ground for questions (2), (3) and (4).
Carcinogenic effects align between young-onset and older-onset AML
For question (2), we wanted to compare our carcinogenic effect estimates for adult-onset AML (Fig. 1e) against those for young-onset AML. Our adult-onset AML cohort comprises 2,973 patients with a mean age of 61 years (s.d., 12 years); for a young-onset AML cohort, we selected patients younger than 25 years old from the collated AML datasets (Extended Data Fig. 3a), totaling 1,481 patients with a mean age of 11 years (s.d., 7 years). The new difficulty for inference is that mutations in normal childhood blood are rarely observed, with variant allele frequencies (VAFs) too low for reliable detection46. We approximated mutation frequencies in normal blood as proportional to gene length, thereby estimating carcinogenic effects for young-onset AML up to an unknown normalizing constant (Methods). We then normalized by the median of the adult carcinogenic effects (Extended Data Fig. 3b).
We found that carcinogenic effect estimates strongly correlate between the old and young age groups (rho = 0.72, P = 0.00034; Fig. 3c). By contrast, driver mutation frequencies do not significantly correlate between the age groups (rho = 0.12, P = 0.62; Fig. 3d). In other words, the frequencies of driver mutations are radically revised with the progression of age, whereas their carcinogenic effects are comparatively stable in ranking. This result is robust to changes in the age boundaries that define the patient groups (Extended Data Fig. 3c). In conclusion, although some degree of age-dependence in carcinogenic effects is plausible (Extended Data Fig. 3d and Supplementary Note 4), this by itself cannot explain the age-dependence of mutation frequencies in AML.
Carcinogenic effects in AML negatively associate with patient age
We next wanted to test whether mutations found in the AML genomes of younger patients tend to be more powerful cancer-causing mutations (question (3); Fig. 2g). For a summary statistic of age, we again used the mean patient age of mutations per driver gene (Fig. 3b). As expected, mean age negatively correlates with carcinogenic effect (rho = −0.44, P = 0.048 and rho = −0.5, P = 0.023, respectively for adult-onset and young-onset estimates; Extended Data Fig. 3e), consistent with the concept that causation corresponds to a quickening of carcinogenesis. According to our framework, the other explanatory factor that may underlie the age distributions of mutations in AML is selection in normal blood.
Selection in normal blood positively associates with AML patient age
To compare genes in terms of selection in normal blood (question (4)), we calculated for each gene the number of non-synonymous mutations per kilobase per normal blood cell (Methods). We observed that mutation density in normal blood positively correlates with mean age in AML (rho = 0.61, P = 0.0038; Fig. 3e). For another view of selection, we turned to dNdScv8 measurements from Fabre et al.22: seven out of 21 genes are under significant positive selection in normal blood (dN/dS > 1, q < 0.05), and these genes have older mean ages in AML (Wilcoxon test, P = 0.016; Fig. 3e). In summary, positive selection in normal blood manifests preferentially in AML genomes of older patients, which stands contrary to the inverse relationship between carcinogenic effect estimates and mean ages in AML (Fig. 3f). Therefore, for the best-documented tissue of the body, causation of cancer and selection in normal tissue leave distinct signals in patient age distributions.
Young-age biases of cancer mutations indicate carcinogenicity
We extended our investigation to cancer types lacking normal tissue data, seeking to extract causal information from age distributions. More humbly than parameter inference, we looked to test the null hypothesis that a mutation has no influence on the rate of malignant transformation. We defined the null hypothesis by a broad class of models of somatic evolution—including our original branching process model (Figs. 2b and 4a) and models in which clonal expansions follow sub-exponential growth curves (Extended Data Fig. 4a)—with the unifying constraint that the carcinogenic effect of the mutation is one (Supplementary Note 5). A general prediction emerged: for a mutation that is positively selected in normal tissue but does not influence cancer, the mutation is found in cancer genomes of older patients relative to neutral mutations (Figs. 2g and 4b, Extended Data Fig. 4b and Supplementary Note 5). Crucially, the prediction is falsifiable. If a mutation both exhibits positive selection in cancer genomes (elevated frequency relative to neutral mutations) and is enriched towards younger patient ages relative to neutral mutations, then the null hypothesis would be rejected in favor of the alternative hypothesis that the mutation is carcinogenic (Fig. 4c).
Fig. 4: Young-age biases in cancer genomes indicate carcinogenicity.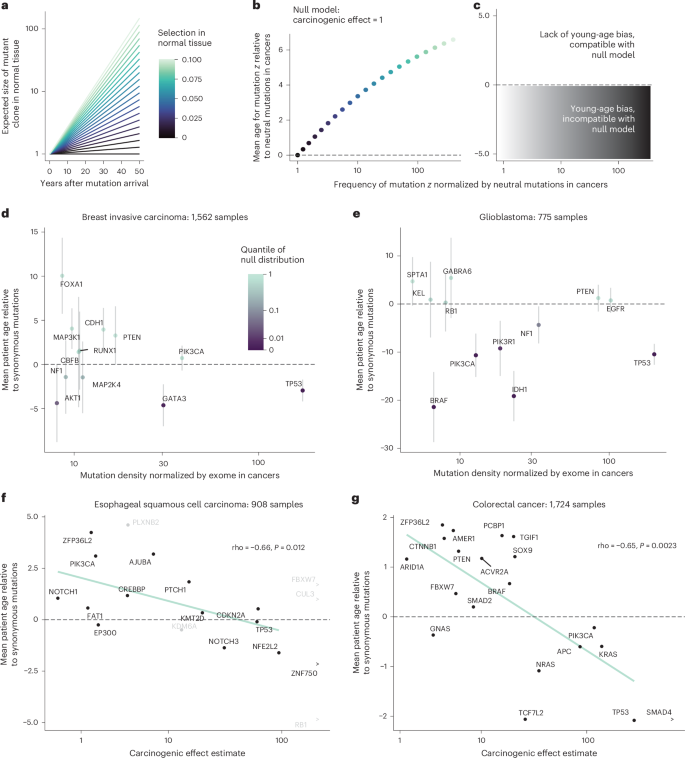 The alternative text for this image may have been generated using AI.
Mutation frequency and age statistics according to the branching process model. a, Expected growth of positively selected mutant clones in normal tissue. b, Positively selected non-carcinogenic mutations are found preferentially in cancers in older patients relative to neutral mutations. The y axis shows the mean patient age for cancers with mutation z minus the mean patient age for neutral mutations. The x axis shows the expected frequency of mutation z in cancers divided by the expected frequency of neutral mutation with the same acquisition rate. Color in a and b denotes the selective effect of mutation z in normal tissue. Generalization is provided in Extended Data Fig. 4a,b and Supplementary Note 5. c, Null hypothesis test schematic. Mutations with elevated frequency and young-age bias in cancer genomes relative to neutral mutations are incompatible with the null model of no carcinogenicity. d,e, Null hypothesis test for driver genes in breast invasive carcinoma(d) and glioblastoma (e). Total of 1,562 breast invasive carcinoma samples and 775 glioblastoma samples from COSMIC. The y axis shows the mean patient age for non-synonymous mutations and small indels per driver gene minus the mean patient age for synonymous mutations in the exome (Methods; for short, age difference). Error bars are 95% Wald confidence intervals. Color denotes the quantile of the age difference statistic with respect to the null distribution, generated by permuting patient ages (Methods). The x axis is the number of mutations per gene divided by the number of mutations in the exome across the cohort, normalized by coding sequence length. Genes are from Bailey et al.26; the top 12 genes with the greatest number of mutations per kilobase are plotted. f,g, Mean patient age per driver gene negatively associates with carcinogenic effect estimate in esophageal (rho = −0.66, P = 0.012) and colorectal cancers (rho = −0.65, P = 0.0023). P values are from two-sided tests. The y axis shows mean age per driver gene relative to synonymous mutations, as in d and e. Patient ages from 908 ESSC samples and 1,724 colorectal cancer samples in COSMIC. Colorectal cancer samples with low mutation burden, as in Extended Data Fig. 1j. Carcinogenic effect estimates from Fig. 1d and Extended Data Fig. 1j. Genes with infinite carcinogenic effect estimates are denoted by ‘>’. Genes whose carcinogenic effect estimates are based on fewer than five samples are colored gray and excluded from correlation statistics and regression lines.
We applied the null hypothesis test to cancer types in COSMIC (Supplementary Table 1 and Extended Data Fig. 4f). Among 939 AML samples, six out of the 21 AML-associated genes have a significant young-age bias relative to exome-wide synonymous mutations, and these genes tend to have greater carcinogenic effects (Extended Data Fig. 4c–e). Among 1,562 breast invasive carcinoma samples, GATA3 and TP53 mutations are significantly young-age biased, whereas PIK3CA is not (Fig. 4d). Restricting to estrogen and progesterone receptor-positive breast cancers in The Cancer Genome Atlas (TCGA) yielded the same results (Extended Data Fig. 4g), reinforcing long-established evidence47,48,49,50 for TP53 contribution to breast cancer risk. Among 775 glioblastoma cases, TP53, IDH1, PIK3CA, BRAF and ATRX show young-age bias, but PTEN and EGFR do not (Fig. 4e). We emphasize that failure to reject the null hypothesis does not imply lack of carcinogenicity, but rather that further evidence is required.
We also emphasize that causality is not binary. We observed a strong inverse relationship between carcinogenic effects and mean age among 908 esophageal carcinoma samples (rho = −0.66, P = 0.012; Fig. 4f) and among 1,724 colorectal cancer samples in COSMIC (rho = −0.65, p = 0.0023; Fig. 4g). Together with AML (Fig. 3f and Extended Data Fig. 4e), these results support that stronger cancer-causing mutations are found preferentially towards younger patient ages (Fig. 2g).
Age biases of AML chromosomal alterations reflect carcinogenicity
Having focused on SNVs/small indels so far, we next turned to somatic copy number alterations (SCNAs). SCNAs are a hallmark of cancer genomes51 and are thought to exert significant carcinogenic effects, which we would like to estimate. However, SCNA acquisition can be non-clocklike and explosive, with a flood of alterations late during carcinogenesis potentially obscuring information on selection and causation. We therefore decided to investigate relatively simple cancer genomes with few SCNAs.
For a case study cancer type with few chromosomal abnormalities and uniquely voluminous normal tissue data, we looked again to AML. We examined gains and losses of autosomal chromosome arms and whole chromosomes among 2,113 AML samples from Tazi et al.25 and 482,789 normal blood samples from the UK Biobank52. As expected, SCNAs are far more numerous in AML (Extended Data Fig. 5a). To ameliorate confoundment by genome instability, we restricted attention to the 1,809 AML samples and the 482,043 normal blood samples with one or zero SCNAs. We observed that chromosome 8, for example, is amplified in 5% of AMLs and 0.02% of normal blood cells, leading to a carcinogenic effect estimate of ~1,800 (Fig. 5a).
Fig. 5: Selection and carcinogenicity shape age distributions of somatic copy number alterations.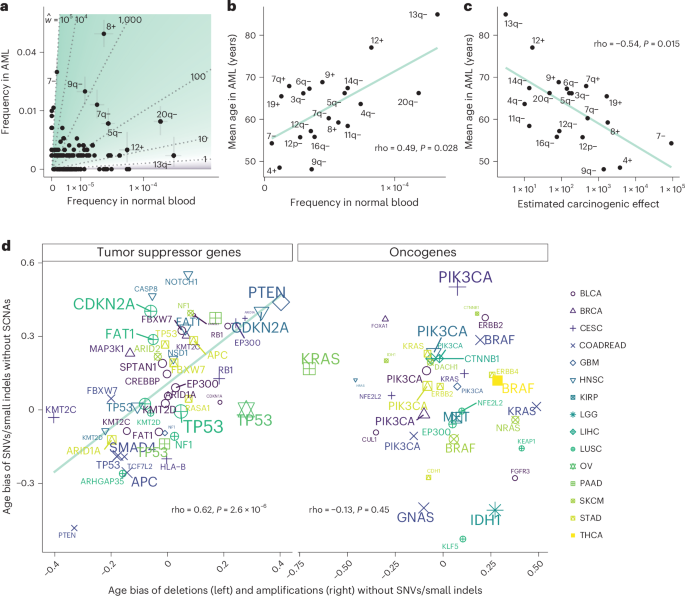 The alternative text for this image may have been generated using AI.
a, SCNA frequencies in AML and normal blood estimate carcinogenic effects. Fraction of 1,809 AML samples with each SCNA from Tazi et al.25 plotted against the mean cell fraction estimate among 482,043 normal blood samples from the UK Biobank52 (normal blood donors aged 40–75 years). Samples with more than one SCNA were excluded. Square-root scale. Vertical and horizontal error bars, respectively, represent 95% binomial and bootstrap intervals, shown for common SCNAs. b, Mean age of AML patients with SCNA positively associates with the mean cell fraction estimate of SCNA in normal blood (rho = 0.49, P = 0.028). The top 20 most frequent alterations over the normal blood and AML cohorts are plotted (alterations ranked by frequency in each cohort independently, and we plot alterations with the highest mean of the two rankings). c, Mean age of AML patients with SCNA negatively associates with carcinogenic effect estimate (rho = −0.54, P = 0.015). d, Pan-cancer comparison of age biases between SCNAs and SNVs/small indels. Left, for each cancer type and tumor suppressor gene, age bias of non-synonymous SNVs/small indels (rank biserial correlation between ages of patients with vs. without mutation in gene) among samples without SCNA is compared to the age bias of deletions among samples without non-synonymous SNVs/small indels in that gene. rho = 0.62, P = 2.6 × 10⁻⁶. Right, for each cancer type and oncogene, the age bias of non-synonymous SNVs/small indels among samples without SCNA is compared to the age bias of amplifications among samples without non-synonymous SNVs/small indels. rho = −0.13, P = 0.45. See Supplementary Table 3 for unabbreviated cancer types. Driver genes are from Bailey et al.26. Genes with an SCNA and an SNV/small indel in at least 5% of samples per cancer type are plotted. For b–d, P values are from two-sided tests, unadjusted for multiple hypothesis testing.
We then calculated the mean age of patients with AML with each amplification and deletion. We observed a positive correlation between mean age in AML versus frequency in normal blood (rho = 0.49, P = 0.028; Fig. 5b and Extended Data Fig. 5b), and a negative correlation between mean age in AML versus carcinogenic effect estimate (rho = −0.54, P = 0.015; Fig. 5c and Extended Data Fig. 5b), agreeing with our theory. These correlations no longer hold if we include the minority of samples with many SCNAs (Extended Data Fig. 5b), consistent with our expectation that genome instability weakens signals of selection and carcinogenicity.
Distinct disruptions of tumor suppressor genes agree on age biases
For cancer types other than AML, interpreting SCNA age distributions becomes more challenging. The difficulty is firstly that genome instability is more pervasive and secondly that normal tissue data are more limited. For a pan-cancer assessment of whether our framework applies to SCNA age distributions, in the absence of normal tissue controls, we used SNVs/small indels in cancer genomes as a benchmark. We sought to compare age distributions of SCNAs against age distributions of SNVs/small indels that might be expected to exert similar phenotypic effects. The prime candidates for alterations with plausibly similar phenotypic effects are deletions of tumor suppressor genes (TSGs) versus loss-of-function mutations in TSGs, as both alteration types ultimately abrogate gene function. Other candidates are amplifications of oncogenes versus gain-of-function variants in oncogenes4. We reasoned that agreement between SNVs/small indels versus SCNAs on their age distributions would support that our age distribution theory applies to SCNAs as well as supporting the hypothesis that the distinct mutational types exert comparable carcinogenic and selective effects.
To put alterations (SCNAs or gene mutations) of different cancer types on the same scale, we measured the age bias of each alteration per cancer type by the rank biserial correlation between patient age and alteration status. We applied this metric to the pan-cancer TCGA database, focusing on samples without whole-genome doubling. We calculated the age bias for non-synonymous SNVs/small indels per driver gene among samples without any SCNA in that gene. We additionally calculated the age bias for each deletion and amplification per gene among samples without any non-synonymous SNVs/small indels in that gene (Supplementary Table 2). Thus, we could compare age biases of distinct alterations of a gene without the complication of cooccurrences.
We observed that age biases of deletions versus SNVs/small indels of TSGs have a strong positive correlation (rho = 0.62, P = 2.6 × 10⁻⁶; Fig. 5c). By contrast, the age biases of amplifications versus SNVs/small indels of oncogenes are not significantly correlated (rho = −0.13, P = 0.45; Fig. 5d). These results are robust to filtering parameters (Extended Data Fig. 5c), and they are recapitulated by linear regressions that account for cancer type as a covariate (Extended Data Fig. 5d,e).
These age comparisons are helpful on several counts. First, that the distinct mutational disruptions of TSGs agree on age distributions supports the notion that age distributions of SCNAs provide information on selection and cancer causation. Second, the comparisons support that deletions and mutations of TSGs exert broadly similar effects, whereas amplifications and mutations of oncogenes overall have more divergent effects. Indeed, some mutations within oncogenes idiosyncratically alter protein structure and function in a way that amplifications cannot. Third, young-age biases provide orthogonal lines of evidence supporting the carcinogenicity of disrupting some TSGs (Supplementary Table 2).