
Protocols
All experimental procedures involving mice were carried out in accordance with UK Home Office, Canadian Council on Animal Care, the Ethics Committee of the French Research Ministry (authorization number 00486.01), Belgian Law of May 29, 2013 regarding the protection of laboratory animals (agreement number LA1230314) and local guidelines on animal welfare and license conditions and the University of Oxford, University of Ottawa, Université Pierre et Marie Curie and Université catholique de Louvain guidelines on animal welfare.
PBMC isolation and cell-based assays
PBMCs were isolated by our established method73, following local ethical approval from Imperial College Research Ethics Committee (19IC5372). Human peripheral blood samples (32 ml) were collected from donors in BD Vacutainer Cell Preparation Tubes containing Sodium Heparin/Ficoll (BD Biosciences). PBMCs were separated by centrifugation at 1600g for 30 min at room temperature (20–22 °C), followed by three washing steps with PBS and 10% FBS (LabTech) and centrifuged at 520 RCF for 10 min after each wash. Viability was measured using the Alamar Blue assay. Donors were females, aged between 25 and 32 years. All subjects were healthy volunteers by self-declaration and provided written informed consent.
LPS stimulation and IL-6 and TNF release quantification
Human PBMCs (1 × 10⁵ per condition in duplicate), freshly isolated as described above, were serum-starved in 0.1% v/v FCS RPMI-1640 (Sigma-Aldrich, R7638) in the presence of TMA (Sigma-Aldrich, 72761) or the IRAK4 inhibitor PF06650833 (0.5 μM; Tocris, 6373) for 30 min, as indicated in the corresponding figures. PBMCs were subsequently stimulated with 1 μg ml−1 LPS (Sigma-Aldrich, L2630) for 4 h (37 °C, 5% CO2). For the phorbol 12-myristate 13-acetate (PMA)/ionomycin stimulation experiments, human PBMCs isolated as above (1 × 10⁵ per condition) pre-incubated with TMAO (100 μM), PF06650833 (0.5 μM) or vehicle as indicated for 30 min were then stimulated with 50 ng ml−1 PMA (Sigma-Aldrich, 79346) and 1 μg ml−1 ionomycin (Sigma-Aldrich, I0634) for 4 h. Next, cells were pelleted by centrifugation (200g for 10 min), and supernatants were collected and stored at −20 °C until further use. IL-6 and TNF were measured in the media diluted 1:10 in RPMI-1640 using the DuoSet ELISA kits (R&D, DY206 and DY210, respectively) according to the manufacturer’s instructions. For PMA/ionomycin TNF measurements, the media were undiluted. For all treatments, n = 4 biological repeats.
PBMCs IRAK1 and NF-κBp65 phosphorylation in response to LPS
Freshly isolated human PBMCs (1 × 10⁶ per ml per condition) were added to 96-well plates coated with L-poly-lysine for 30 min (100 ng ml−1; Sigma-Aldrich, P4707) in RPMI-1640 containing 20% FCS and were left to attach to the wells overnight at 37 °C, 5% CO2. The following day, media were discarded and cells were incubated in serum-free RPMI-1640 containing 100 μM TMA, or RPMI-1640 vehicle for 30 min. PBMCs were then stimulated with LPS (1 μg ml−1) for up to 60 min (times indicated in the corresponding figure legends). At the end of the stimulation, PBMCs were fixed with 8% paraformaldehyde (Sigma-Aldrich, F8775) at room temperature for 20 min. Phosphorylation of IRAK1 (at Thr209) or NF-κBp65 (at Ser536) was determined in fixed PBMCs using commercially available ELISA kits (LSBio, LS-F1401-1 or LS-F891-1, respectively) according to the manufacturer’s instructions. Readings were normalized to the levels of total IRAK1 protein determined in sister wells, which were treated identically. The dose-dependent impact of TMA (see corresponding figures) on phosphorylation levels of IRAK1 or NF-κBp65 upon LPS (1 µg ml−1) stimulation of PBMCs (for 10 min or 15 min, respectively) was also determined using the commercially available kits from LSBio as described above.
Cell-based assays in primary human hepatocytes
Cryopreserved primary human hepatocytes were commercially sourced (Innoprot) and cultured with hepatocytes medium (Innoprot) supplemented with 5% FBS, 1% hepatocytes growth supplement (mixture of growth factors, hormones and proteins necessary for culture of primary hepatocytes) and 100 U ml−1 penicillin and streptomycin. Human hepatocytes were grown on poly-L-lysine pre-coated cell dishes at 37 °C and a 5% CO2 atmosphere following the manufacturer’s recommendations. The following experiments were performed 24 h after seeding: first, palmitic acid (200 μM) administration (0 and 60 min) with or without TMA (0.1 mM, 30 min) pre-treatment, plus co-administration during palmitic acid exposure were assayed. The palmitic acid solution was prepared as previously reported44,74. In this experiment, the effect of palmitic acid and TMA on IRAK1, IRAK4, NF-κBp65, IKKαβ, SAPK/JNK and p38MAPK activity was analysed. In a second experiment, the effect of TMA (0.1 mM, 30 min) pre-treatment plus co-administration during vehicle or palmitic acid exposure for 4 h on insulin action and on IL-6 release was tested. Insulin action was evaluated by measuring pSer473Akt1/Akt1 after insulin (100 nM, 10 min) stimuli.
pThr209IRAK1, total IRAK1, pSer536NF-κBp65, total NF-κBp65, pSer473AKT1, total AKT1 and GAPDH (as an endogenous control) were measured with specific colourimetric cell-based ELISA Kits (Assay Biotechnology Company, CytoGlow IRAK1 (CBP1425), CytoGlow NF-κBp65 (CBP1633) and CytoGlow AKT1 (CBP1490), following the manufacturer’s instructions. For data analysis, the optical density of target proteins (read at 450 nm) was normalized with cell nuclei crystal violet staining (read at 595 nm), which was proportional to cell counts. The analysis of cell-based assays was performed in a blind manner.
pThr345/Ser346IRAK4/IRAK4, pSer176/180IKKαβ/IKKβ, pThr183/Tyr185SAPK/JNK and pThr180/Tyr182p38MAPK/p38MAPK were determined by western blot. In brief, hepatocyte proteins were directly extracted in radioimmunoprecipitation assay (RIPA) buffer (0.1% SDS, 0.5% sodium deoxycholate, 1% Nonidet P-40, 150 mM NaCl and 50 mM Tris-HCl pH 8.0) supplemented with protease inhibitors (1 mM phenylmethylsulfonyl fluoride). Cellular debris and lipids were eliminated by centrifugation of the solubilized samples at 13,000 rpm for 10 min at 4 °C, recovering the soluble fraction. Protein concentration was determined using the RC/DC Protein Assay (Bio-Rad Laboratories). RIPA protein extracts (20 μg) were separated by SDS–PAGE and transferred to nitrocellulose membranes by conventional procedures. Membranes were immunoblotted with antibodies against the following proteins: pThr345/Ser346IRAK4 (11927), IRAK4 (4363), pSer176/180IKKαβ (2694), IKKβ (8943), pThr183/Tyr185SAPK/JNK (4668), SAPK/JNK (9258), pThr180/Tyr182p38MAPK (9215) and p38MAPK (9212), all purchased from Cell Signaling Technology, and β-actin (sc-47778, Santa Cruz Biotechnology). Anti-rabbit IgG and anti-mouse IgG coupled to horseradish peroxidase was used as a secondary antibody. Horseradish peroxidase activity was detected by chemiluminescence, and quantification of protein expression was performed using Scion Image software. IL-6 concentration in hepatocyte media was measured using Human IL-6 Quantikine ELISA Kit (R&D Systems, D6050). All experiments were performed with at least three sample replicates.
Mouse modelsLongitudinal HFD feeding in mice
All experiments were approved by the ethical committee of the University of Oxford. Male mice from a C57BL/6J inbred strain were bred in our animal facility by using a stock originating from The Jackson Laboratory. At 5 weeks of age, groups of eight to ten mice were transferred to a 40% w/w HFD (65% kcal) (Special Diets Services, 824155b), containing 32% lard and 8% corn oil, whereas control groups remained on a normal carbohydrate (CHD) diet containing 5% fat, 19% protein and 3.5% fibre (B&K rat and mouse pelleted diet, B&K Universal) for up to 6 months. Detailed diet formulations were published previously13 and are summarized in Supplementary Table 6.
Mice were housed under a 12 h–12 h light–dark cycle. For physiological profiling, several mouse groups fed CHD or HFD were tested to assess the consistency of results and discard any impact of potential batch effects. Intraperitoneal GTTs were performed on 2, 3, 5 and 7-month-old mice after an overnight fast, as previously published75 (see also metabolic phenotyping below). Then, 4 days after the GTT, 24 h urinary samples (09:00–21:00 h) were collected from mice maintained in individual metabolic cages. Urinary samples collected in a solution of 1% (wt/vol) sodium azide were centrifuged to remove solid particles and kept at −80 °C until assayed. After an overnight fast, mice were killed by exsanguination. Plasma was separated by centrifugation and stored at −80 °C until 1H-NMR analysis.
Choline supplementation on HFD
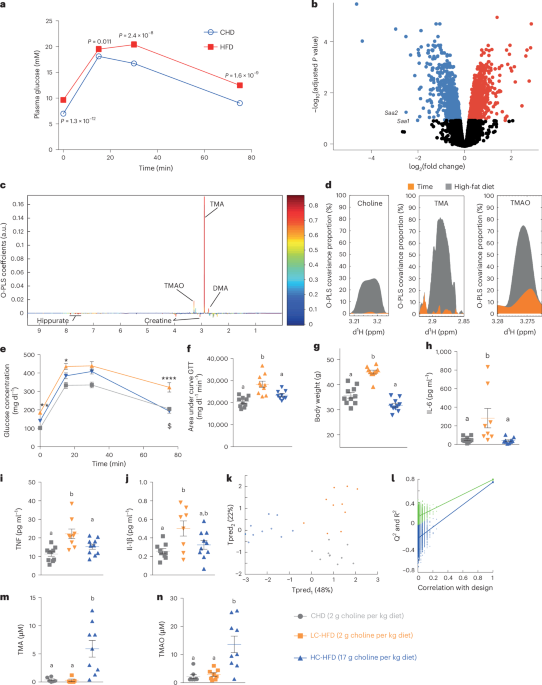
At 5 weeks of age, mice were fed either a CHD containing 2 g of choline per kg of diet (Research Diets, D12450J), a LC-HFD containing 2 g of choline per kg of diet (Research Diets, D12492), a HC-HFD containing 17 g of choline per kg of diet (Research Diets, D16100401), a HC-HFD containing 1% of DMB or a HC-HFD combined with a cocktail of antibiotics (0.5 g l−1 vancomycin hydrochloride, 1 g l−1 neomycin trisulfate, 1 g l−1 metronidazole, 1 g l−1 ampicillin sodium) in drinking bottles (n = 6–10 per group) for 8 weeks (see diet formulations in Supplementary Table 6). Mice were then killed by decapitation, and organs were dissected and weighed.
Irak4
−/− mice
Irak4−/− mice on a C57BL/6J background, as previously described38,45, were bred with C57BL/6J mice (The Jackson Laboratory), and the F1 offspring were subsequently bred to produce the Irak4−/− mice and wild-type littermates used for this study. Mice were bred and genotyped at the Animal Facility of the University of Ottawa Heart Institute. The following primers were used for genotyping. Irak4 knockout, 5′-TGAATGGAAGGATTGGAGCTACGGGGGT-3′; Irak4 common, 5′-GAACACGCTCCCAGGTCTCTTTCCAAC-3′; and Irak4 wild-type, 5′-TCTTCTACCTGAAATATGAAAGATTCCT-3′. The PCR reaction was run at 94 °C for 60 s, 60 °C for 60 s and 72 °C for 60 s for 40 cycles. The mice (10–12 weeks old) were fed with HFD for 8 weeks and then killed by decapitation, and their organs were dissected and weighed at the end of the study.
Chronic TMA and PF06650833 treatment in LC-HFD-fed mice
C57BL/6J mice (Charles River; 5 weeks old) were housed for 1 week before the experiment in a controlled environment. Mice were maintained under a 12 h–12 h light–dark cycle. On day 0, the 10-week-old mice were anaesthetized with isoflurane (ForeneH, Abbott). Mini-osmotic pumps were implanted subcutaneously (Model 2006, Alzet) (flow rate, 0.15 ml h−1; total filling volume, 200 ml; delivery duration, 42 days) as previously described76. The osmotic mini-pump contained either vehicle or TMA (0.1 mM in circulation) or PF06650833 (50 nM in circulation). After 6 weeks of metabolite treatment, mice were killed by decapitation, and the organs were dissected and weighed.
Septic shock mouse model
Male mice on a C57BL/6J background (6 weeks old) were purchased from Charles River and maintained in a controlled environment for 2 weeks to acclimate them to local conditions. The animal experimental protocol was approved by local and national committees in charge (Tor Vergata University Institutional Animal Care and Use Committee and Ministry of Health, license no. 265/2019-PR) and conducted in accordance with accepted standards of humane animal care. Mice were intraperitoneally injected with 59 mg kg−1 TMA (Sigma-Aldrich, 72761) (treatment group, n = 7) or PBS alone (control group, n = 6) 30 min before LPS injection (30 mg kg−1 of LPS (Sigma-Aldrich, L2630) in sterile PBS by intraperitoneal injection). The survival of the mice was monitored every 4 h for 36 h.
Mice were housed in standard ventilated cages under a 12 h–12 h light–dark cycle at 20–23 °C and 40–60% humidity. For mouse experiments, staff who were responsible for phenotyping and biospecimen collection also handled the dietary intervention; therefore, they were not blinded to experimental conditions.
Physiological phenotyping
After 4 weeks of treatment, an intraperitoneal GTT test (2 g kg−1) was performed in conscious mice following an overnight fast. Blood was collected from the tail vein before glucose injection and 30, 60, 90 and 120 min afterwards. Blood glucose levels were determined using an Accu-Check Performa (Roche Diagnostics). Additional blood samples were collected at baseline and 30 min after glucose injection in Microvette CB 300 Lithium Heparin (Sarstedt). Plasma was separated by centrifugation and stored at −80 °C until the insulin radioimmunoassay. Circulating insulin levels were determined using insulin ELISA kits (Mercodia). The Matsuda insulin sensitivity index was calculated as previously published31.
After 5 weeks, we performed an ITT. Mice that had been fasted for 5 h were injected intraperitoneally with insulin (0.75 mU g−1; Actrapid, Novo Nordisk). Blood glucose levels were measured immediately before and 15, 30, 45, 60, 90 and 120 min after insulin injection with a standard glucose meter (Accu-Check, Roche) on the tip of the tail vein.
Gene expression
Groups of six mice showing consistent pathophysiological profiles in response to CHD or HFD treatment were selected for microarray analysis performed with our established method75, and data were deposited in ArrayExpress under accession number E-MEXP-1755. Total RNA was isolated from frozen liver tissue using the Trizol reagent (Invitrogen Life Technologies), followed by further purification with RNeasy spin columns (Qiagen). The concentration and quality of RNA samples were evaluated using an Agilent 2100 Bioanalyser (Agilent Technologies). Gene expression analysis was performed using the Affymetrix Mouse Genome arrays (U430A and U430B). These arrays include 22,690 (U430A) and 22,576 (U430B) probe sets, enabling the detection of transcript levels for approximately 13,250 (U430A) and 7,577 (U430B) unique genes and expressed sequence tags. For each sample, 10 μg of total RNA was used for first-strand cDNA synthesis, followed by in vitro transcription to generate biotin-labelled complementary RNA (cRNA). The cRNA samples were then assessed for yield and integrity using an Agilent 2100 Bioanalyser. After fragmentation, individual cRNA preparations were hybridized to the microarrays using a temperature-controlled Affymetrix hybridization oven. Post-hybridization washing and staining were carried out using the Affymetrix Fluidics Station 450. Finally, the arrays were scanned at a wavelength of 560 nm with an Agilent scanner (Affymetrix). The Bioconductor77 package Limma78 was used to generate the list of differentially expressed genes. Gene ontology was implemented using Enrichr79, and signalling pathway impact analysis was conducted using SPIA80.
For qPCR analysis, total RNA was prepared from tissues using TriPure reagent (Roche). Quantification and integrity analysis of total RNA were performed by analysing 1 µl of each sample in an Agilent 2100 Bioanalyzer (Agilent RNA 6000 Nano Kit). cDNA was prepared by reverse transcription of 1 mg total RNA using a Reverse Transcription System kit (Promega). Real-time PCR was performed with the StepOnePlus real-time PCR system and software (Applied Biosystems) using Mesa Fast qPCR (Eurogentec) for detection according to the manufacturer’s instructions. RPL19 RNA was chosen as the housekeeping gene. All samples were performed in duplicate in a single 96-well reaction plate, and data were analysed according to the 2−ΔΔCT method. The identity and purity of the amplified product were assessed by melting curve analysis at the end of amplification. The primer sequences for the targeted mouse genes are as follows: SAA1 forward, CATTTGTTCACGAGGCTTTCC; SAA1 reverse, GTTTTTCCAGTTAGCTTCCTTCATGT; SAA2 forward, GGGGTCTGGGCTTCCCATCT; SAA2 reverse, CCATTCTGAAACCCTTGTGG; SAA3 forward, CGCAGCACGAGCAGGAT; SAA3 reverse, CCAGGATCAAGATGCAAAGAATG as previously reported81. Quantitative PCR with reverse transcription assays were performed in a single batch, with the personnel blinded to treatment groups.
Circulating cytokine quantification
Circulating cytokines were quantified using the MSD V-PLEX Plus Proinflammatory Panel 1 kit. Plasma samples were diluted two times in the diluent provided, and the experiment was processed as outlined by the manufacturer and read on a SECTOR imager 2400. Cytokine assays were performed in a single batch with the personnel blinded to treatment groups.
Western blotting
Western blot analyses were performed according to our established methods82. To analyse the insulin signalling pathway, mice were allocated to either a saline-injected subgroup or an insulin-injected subgroup so that both subgroups were matched in terms of body weight and fat mass. They then received 1 mU insulin per g body weight (Actrapid; Novo Nordisk) or an equal volume of saline solution. Then, 3 min after injection, the mice were killed and their liver was dissected. A total of 30 mg of liver was homogenized in 680 µl of RIPA buffer containing a cocktail of protease and phosphatase inhibitors. The homogenate was then centrifuged at 12,000g for 20 min at 4 °C. Equal amounts of proteins were separated by SDS–PAGE and transferred to nitrocellulose membranes. Membranes were incubated overnight at 4 °C with antibodies diluted in Tris-buffered saline Tween-20 containing 1% BSA:p-Akt Ser473 (1:1,000; Cell Signaling Technology, 4060), total Akt (1:1,000; Cell Signalling Technology, 9272S), p-NF-κB (1:3,000; AbCam, ab86299) and total NF-κB p65 (1:3,000; Cell Signalling Technology, 8242). Insulin-induced p-Akt/total Akt corresponds to the ratio between p-Akt/Akt in insulin-treated mice and p-Akt/Akt in saline-treated mice. For these western blots, the membranes were stripped and re-probed with a β-actin antibody as a loading control. In separate densitometric analyses, we additionally corrected total Akt levels with β-actin and subsequently used this ratio to correct p-Akt, so as to take into account total protein levels.
1H-NMR spectroscopy and multivariate statistics
Mouse urine samples were prepared by mixing 200 μl of urine with 200 μl of distilled water and 200 μl of 0.1 M phosphate buffer (containing 10% D2O/H2O, v/v, and 0.05% sodium 3-trimethylsilyl-(2,2,3,3-2H4)-1-propionate as a chemical shift reference at δ 0.0). The mixtures were loaded into 96-well plates for high-throughput flow-injection NMR spectroscopy. Samples were prepared and measured on a spectrometer (Bruker) operating at 600.22 MHz 1H frequency as detailed previously13. In short, a standard 1D pulse sequence (recycle delay-90°-t1-90°-tm-90°-acquisition) was used. Water suppression was performed by irradiating the water peak during the recycle delay (2 s) and mixing time, tm (150 ms); t1 was set to 3 μs. The 90° pulse length was adjusted to ≈10 μs. We acquired 128 transients at 32,000 a data point resolution for each spectrum with a 20 ppm spectral width. Free induction decays were multiplied by an exponential function corresponding to a 0.3-Hz line-broadening factor before Fourier transformation. The NMR spectra were corrected for phase and baseline. Full-resolution 1H-NMR spectra were imported, and the area corresponding to the water region after water suppression (δ4.5–5.0) was discarded. The full-resolution spectra were then processed and analysed using O-PLS-DA as we had done previously13. In this version of discriminant analysis, class separation is maximized by using NMR data (X) to model the class matrix (Y, with n dummy variables for n classes), through decomposition of the covariance matrix (YᵀX) into n − 1 O-PLS components and additional orthogonal signal correction components13. Variance component analysis was performed as described previously83. 1H-NMR profiling was performed in a single batch with the personnel blinded to treatment groups. The O-PLS-DA model was validated using 10,000 random permutations of the original class membership variable to explain (that is, diets, treatments or genotypes), as described previously83.
Plasma methylamine quantification by UPLC–MS/MS
Methylamines were quantified according to our previously validated methods29,30: plasma samples (20 μl) were spiked with 10 μl internal standard solution (13C3/15N-TMA, d9-TMAO, d4-choline, d3-carnitine and d9-betaine in water; 1 mg l−1) and 45 μl of ethyl 2-bromoacetate solution (15 g l−1 ethyl 2-bromoacetate, 1% NH4OH in acetonitrile) were added to derivatize methylamines (TMA and 13C3/15N-TMA) to their ethoxy-analogues, completed after 30 min at room temperature. Methylamines were derivatised with ethyl bromoacetate to increase sensitivity (the underivatized form elicited a low response from the mass spectrometer owing to its low molecular weight) and enhance chromatographic performance. A total of 935 μl of a protein/lipid precipitation solution (94% acetonitrile/5% water/1% formic acid) was added; samples were centrifuged for 20 min (4 °C, 20,000g) and transferred to UPLC–autosampler vials. Sample injections (10 μl loop) were performed on a Waters Acquity UPLC-Xevo TQ-S UPLC–MS/MS system equipped with an Acquity BEH HILIC (2.1 × 100 mm, 1.7 μm) chromatographic column. An isocratic elution was applied with 10 mM ammonium formate in 95:5 (v/v) acetronitrile:water for 14 min at 500 μl min−1 and 50 °C. Positive electrospray (ESI+) was used as the ionization source, and mass spectrometer parameters were set as follows: capillary, cone and source offset voltages at 500, 93 and 50 V, respectively; desolvation temperature at 600 °C; desolvation/cone/nebulizer gases were high-purity nitrogen at 1,000 l h−1, 150 l h−1 and 7 bar, respectively. Collision gas was high-purity argon. The mass spectrometer was operated in multiple reaction monitoring mode. The monitored transitions were as follows: for derivatized-TMA, +146 → +118/59 m/z (23/27 V); for derivatised-13C3/15N-TMA, +150 → +63 (27 V); for TMAO, +76 → +59/58 m/z (12/13 V); for d9-TMAO, +85 → +68 m/z (18 V); for choline, +104 → +60/45 m/z (14/16 V); for d4-choline, +108 → +60 m/z (15 V); for γ-butyrobetaine, +146 → +60/87 m/z (12/12 V); for carnitine, +162 → +103/60 m/z (16/14 V); for d3-carnitine, +165 → +103 m/z (16 V); for betaine, +118 → +59/58 m/z (16/16 V); and for d9-betaine, +127 → +68 m/z (16 V).
Kinome screen, K
d
TMA was assessed using the KdELECT screening service (DiscoveRx) as described previously35,36. This technique is based on a competition-binding assay that quantitatively measures the ability of a compound to compete with an immobilized, active-site-directed ligand. The assay consists of a DNA-tagged kinase, an immobilized ligand and the potent inhibitor. The ability of TMA to compete with the immobilized ligand was measured by qPCR of the DNA tag. Kd was then calculated from a duplicate 11-point dose–response curve. Kinase interaction tree plots were generated using the TREEspot Software Tool and are reprinted with permission from KINOMEscan, a division of DiscoveRx Corporation, 2015.
Kinase activity assays
The TMA IC50 on IRAK4 was determined using Kinexus kinase-inhibitor activity profiling service (Kinexus). Protein kinase assays (in duplicate) were performed at ambient temperature for 30 min in a final volume of 25 μl according to the following assay reaction recipe:
Component 1
A total of 5 μl of diluted active IRAK4 target (recombinant, full length, expressed by baculovirus in Sf9 insect cells with an GST tag (SignalChem Catalogue 112-10G); ~10–50 nM final concentration in the assay).
Component 2
A total of 5 μl of stock solution of substrate (Myelin Basic Protein 1 mg ml−1 diluted in H2O).
Component 3
A total of 5 μl of kinase assay buffer (25 mM MOPS pH 7.2, 12.5 mM β-glycerol-phosphate, 25 mM MgCl2, 5 mM EGTA, 2 mM EDTA, 0.25 mM dithiothreitol, added just before assay initiation).
Component 4
A total of 5 μl of compound (various concentrations as indicated) or 10% dimethylsulfoxide for blank.
Component 5
A total of 5 μl of 32P-ATP (250 μM stock solution, 0.8 μCi, Perkin Elmer).
The assay was initiated by the addition of 32P-ATP, and the reaction mixture was incubated at ambient temperature for 30 min. After the incubation period, the assay was terminated by spotting 10 μl of the reaction mixture onto a Multiscreen phosphocellulose P81 plate, which was washed three times, each time for approximately 15 min, in a 1% phosphoric acid solution. The radioactivity on the P81 plate was counted in the presence of scintillation fluid in a Trilux scintillation counter. Blank control was set up that included all the assay components except the addition of Myelin Basic Protein (replaced with an equal volume of assay dilution buffer). The corrected activity for the IRAK4 target was determined by removing the blank control value.
We calculated the TMA Ki for IRAK4 using the equation below84, where IC50 = 3.4 µM, as determined from the IRAK4 activity assay described above. [S] is the concentration of ATP in the assay (50 µM), and the Km value of IRAK4 for ATP (Km = 13.6 µM) was provided by the commercial vendor. Purified IRAK4 for these assays was obtained from https://media.cellsignal.com/pdf/7551.pdf.
$${K}_{{\rm{i}}}=\frac{{\mathrm{IC}}_{50}}{1+\frac{[{\boldsymbol{S}}]}{{K}_{{\rm{m}}}}}$$
Reagents
Glutamine (Glutamax, 35050061, Life Technologies), FBS (Life Technologies), crystal violet (C6158) and trimethylamine solution (W324108) were obtained from Sigma-Aldrich. Mouse IL-6 Quantikine ELISA kits (M6000B) were obtained from R&D Systems, and the RNeasy Micro Kit was from Qiagen. SuperScript II Reverse Transcriptase, IL-6 Taqman probe Hs00174131_m1 and FAST master mix were purchased from Invitrogen. The HFD (Special Diets Services) and CHD (B&K Universal) were specifically formulated as described in a previous publication12; the remaining foods were obtained from Research Diets: control diet (D12450K), LC-HFD (60% kcal fat and 20% kcal carbohydrates; D12492), and HC-HFD (60% kcal fat and 20% kcal carbohydrates with 17 g of choline per kg; D16100401i). The mouse insulin ELISA was obtained from Mercodia (10-1249-01). Additional reagents and kits included isoflurane (10014451, Forene, Abbott); TriPure reagent (1667165, Roche); Reverse Transcription System kit (A3500, Promega); Mesa Fast qPCR (CS-CKIT-PROD, Eurogentec); and the MSD V-PLEX Plus Proinflammatory Panel 1 kit (K15048G Meso Scale Diagnostics).
Statistics
Potential outliers were identified by a Grubbs test. For statistical comparisons between study groups, normality was tested using the D’agostino–Pearson omnibus normality test, then one-way ANOVA was used, followed by Tukey’s post hoc testing when data were normally distributed; otherwise, groups were compared using the two-tailed Mann–Whitney test (P < 0.05 considered to be statistically significant). Where applicable, P values were corrected for multiple comparisons using the Benjamini–Hochberg method, unless otherwise stated. Data are displayed as means ± s.e.m in all figures. All cell culture experiments included at least three biological replicates (as indicated in figure legends). All animal cohorts included at least five animals in each study group (as indicated in figure legends); animals were randomized to treatment groups and were sampled in a random order. Data collection and analysis were not performed blind to the conditions of the experiments. No statistical methods were used to pre-determine sample sizes, but our sample sizes are similar to those reported in our previous publications69.
Reporting summary
Further information on research design is available in the Nature Portfolio Reporting Summary linked to this article.