
Multimodal characterization and identification of aging and senescence through RamanOmics
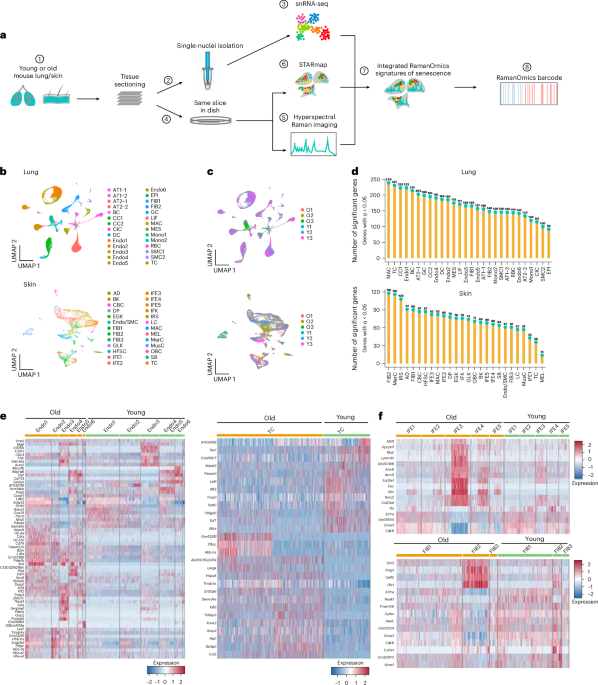
To investigate the cellular and molecular characteristics of aging in mouse tissues, we focused on lung and skin, which are key organs that function as protective barriers and are constantly and directly exposed to environmental factors (for example, ultraviolet light (UV) and air pollutants) contributing to senescence with age. We collected samples from 2-month-old and 26-month-old mice. Nuclei were isolated from frozen optical cutting temperature (OCT)-embedded tissues for snRNA-seq from mouse lung (old, n = 3; young, n = 3) and mouse skin (old, n = 3; young, n = 3). Tissue sections from the same blocks were used for Raman imaging followed by spatial transcriptomics (old, n = 3; young, n = 3) (Fig. 1a). Raman imaging captured the subcellular full spectrum of biochemical phenotypes, followed by imaging-based, single-cell spatial transcriptomics (STARmap-ISS) to map cell states using a curated panel of 890 genes, including 700 cell-type marker genes and 190 senescence-specific and aging-specific markers, and finally we employed in situ hybridization (STARmap-ISH) to validate identified senescent markers (Supplementary Table 1). We successfully integrated these multimodal profiles using our platform, RamanOmics, and identified multimodal signatures of aging and senescence, which enabled the accurate multimodal spatial identification and characterization of vibrational–biochemical and molecular architecture of cellular senescence across tissues and ages at single-cell resolution (Fig. 1a).
Fig. 1: RamanOmics workflow and dynamics of gene regulation across ages and tissues.
a, Detailed workflow of the RamanOmics platform. (1) Lung and skin tissues from young (age 2 months) and old (age 26 months) mice were collected from naturally aged animals and embedded in OCT. (2,4) Adjacent tissue slices from the same OCT block were used for snRNA-seq (2) or fixed in quartz-bottomed dishes (4). (3) Single-nuclei transcriptome sequencing and RNA-seq analysis were performed (lung: old, n = 3; young, n = 3; skin: old, n = 3; young, n = 3). (5) Full-spectrum Raman spectra (600–1,800 cm−1) were acquired by Raman microscopy (lung: old, n = 3; young, n = 3; skin: old, n = 3; young, n = 3). (6) The same tissue slices used for Raman microscopy were subsequently proceeded to STARmap to acquire spatially resolved transcriptomic information. (7) Multimodal RamanOmics signatures of senescence were generated by integrating snRNA-seq and Raman spectral information, leveraging STARmap spatial transcriptomic profiles as spatial anchors. (8) RamanOmics barcodes were developed by extracting the top predictive features from integrated RamanOmics signatures to classify and visualize senescence and nonsenescence. b, Uniform Manifold Approximation and Projection (UMAP) plots of snRNA-seq data based on unsupervised clustering. Cells are colored according to cluster identification. c, UMAP plots showing all sequenced single-nuclei transcriptomes from mouse lung (top) and skin (bottom). Cells are colored according to biological replicates. d, Lollipop plots showing the number of significant DEGs identified by Earth Mover’s Distance analysis (false discovery rate (FDR) <0.05) per cell type in old versus young mouse tissues, ranked by the total number of significant genes. e, Heatmaps displaying representative DEGs from snRNA-seq comparing old versus young mouse endothelial cells (left) and T cells (right) in mouse lung at the subcell-type level. The color key represents low (blue) to high (red) gene expression levels. f, Heatmaps displaying representative DEGs from snRNA-seq comparing old versus young mouse IFE cells (top) and fibroblasts (bottom) in mouse skin at the subcell-type level. The color key represents low (blue) to high (red) gene expression levels. AD, adipocytes; BC, B cells; BK, basal keratinocytes; CBC, cycling basal cells; CIC, ciliated cells; DC, dendritic cells; DP, dermal papilla cells; EGK, early granular keratinocytes; GLK, granular layer keratinocytes; HFSC, hair follicle stem cells; LC, Langerhans cells; LIF, lipofibroblasts; MAC, macrophages; MEL, melanocytes; MerC, Merkel’s cells; MES, mesenchymal cells; MusC, muscle cells; OBC, outer bulge cells; RBC, red blood cells; SB, sebocytes; SMC, smooth muscle cells; TC, T cells; O1, old sample 1; O2, old sample 2; O3, old sample 3; Y1, young sample 1; Y2, young sample 2; Y3, young sample 3.
Distinct aging signatures across mouse lung and skin
To characterize the gene expression programs of aging, we generated high-quality single-nucleus transcriptomes from 35,474 mouse lung cells and 12,128 mouse skin cells (Extended Data Fig. 1a), identifying 28 major lung clusters and 26 skin clusters (Fig. 1b,c, Extended Data Fig. 1b,c and Supplementary Table 2). Gene set enrichment analyses showed that aging in the lung was associated with upregulation of genes involved in immune activation and inflammatory signaling across alveolar type 1 or 2 (AT1/2) cells, endothelial cells (Endos) and monocytes (Monos) (Extended Data Fig. 1d), and downregulated genes were enriched in pathways related to transcriptional repression, epithelial proliferation and ECM organization, particularly in T cells, fibroblasts and endothelial cells (Extended Data Fig. 1e). In old skin, upregulated genes were notably enriched in ‘ribonucleoprotein complex binding’, suggesting increased activity in RNA processing and protein synthesis machinery (Extended Data Fig. 1f), whereas downregulated genes showed strong enrichment in pathways related to ‘response to metal ion’ and ‘muscle contraction’ across several cell types, including Inner root sheath (IRS) cells, interfollicular epidermis (IFE) cells, interfollicular keratinocytes (IFKs) and muscle cells (Extended Data Fig. 1g).
Using Earth Mover’s Distance9, endothelial cells and T cells showed pronounced aging-associated transcriptomic remodeling in lung and fibroblasts and IFE cells the most substantial shifts in skin (Fig. 1d), with reduced AT2-2 and Endo2/3 cells but increased T cells and Mono1 in the old lung, and reduced Merkel cells and outer bulge cells, but increased T cells, Langerhans cells, adipocytes and early granular keratinocytes in old skin (Extended Data Fig. 1h). Together, these results reveal tissue-specific aging patterns: immune activation and vascular remodeling with diminished epithelial renewal in lung, versus metabolic decline and impaired ion homeostasis with partial preservation of epithelial programs in skin.
Cell-type-specific transcriptional programs in aging
At the cell-type level, old lung endothelial cells upregulated gene modules associated with transcriptional regulation (Klf2 and Klf4), antigen processing and presentation (H2-Aa, H2-Eb1, Cd74 and Ciita) and ECM remodeling (Timp3 and Serpine1) (Fig. 1e, left), whereas T cells showed increased expression of genes associated with inflammatory signaling and immune stress (Tnfαip3 and Ccl5) and decreased expression of transcription factors associated with T cell activation (Foxp1, Lef1 and Aff3) (Fig. 1e, right). In skin fibroblasts, particularly in FIB2, aging was associated with upregulation of genes linked to fibrotic and structural remodeling pathways (Slit3, Dlc1 and Prkg1) (Fig. 1f, bottom). IFE cells similarly exhibited upregulation of genes related to metabolism (Sult5a1 and Gpcpd1) and cellular structure (Col23a1), reflecting widespread activation of stress adaptation and regenerative programs (Fig. 1f, top).
Age-dependent functional reprogramming of senescence
We identified senescent cells based on expression of Cdkn1a (encoding p21), a canonical senescence marker with a protein product that initiates senescence by inhibiting cell-cycle progression through the p53 pathway10. Importantly, clearance of p21+, but not p16+ (Cdkn2a)+, senescent cells prevented radiation-induced bone loss and marrow adiposity despite comparable induction of both markers11, consistent with p21+ and p16+ marking largely distinct, nonredundant senescent subpopulations across mouse and human aging tissues12. We identified p21+ senescent cells enriched in specific cell types, including AT2, endothelial cells and macrophages in the lung (Fig. 2a), and IFE cells, basal keratinocytes and IRS cells in the skin (Fig. 2b).
Fig. 2: Cell-type-specific senescence programs revealed by differential expression profiling in aging lung and skin.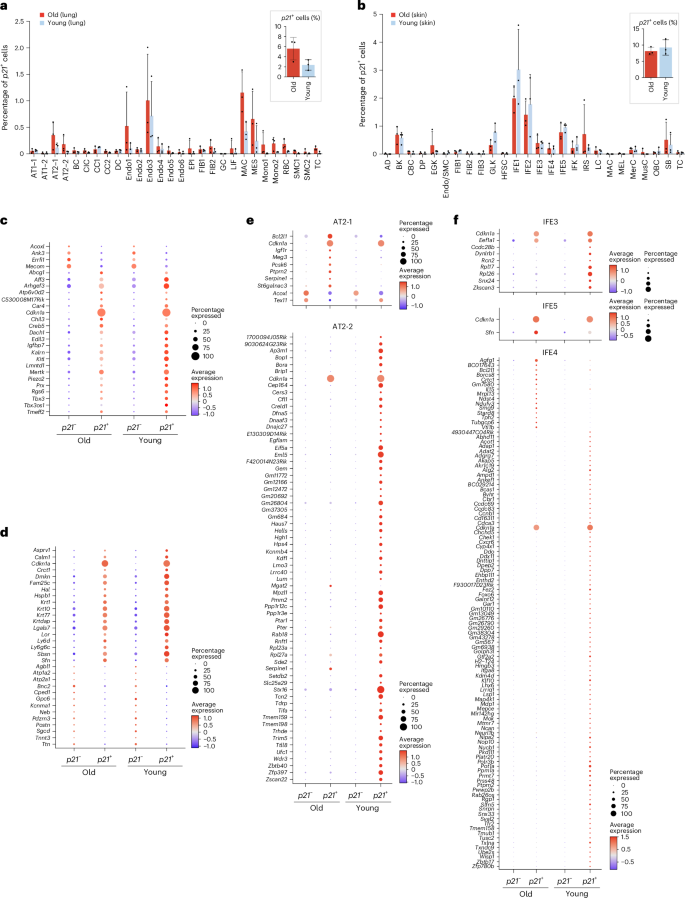
a,b, Bar plots showing the percentage of p21+ senescent cells at tissue-wide and cell-type levels in mouse lung (a) and skin (b) from snRNA-seq data. The bars represent the mean ± s.d.; each dot represents an individual biological replicate (one mouse); n = 3 mice per group (old, young) for both cell-type-level and tissue-wide (inset) quantifications in a and b. c,d, Dot plots showing shared DEGs between p21+ senescent and p21− nonsenescent cells from old and young mouse lung (c) and skin (d). Average expression scores were calculated using log(normalized) and scaled data (FDR < 0.05). The numerical details are reported in Supplementary Table 2. e,f, Dot plots showing DEGs enriched in p21+ senescent cells within AT2-1 and AT2-2 (e), IFE3, IFE4 and IFE5 cells (f) in old and young mouse samples. Average expression scores were calculated using log(normalized) and scaled data (FDR < 0.05). The numerical details are reported in Supplementary Table 2.
In our comprehensive analysis of p21+ senescent cells from both young and old mouse lung tissues, we identified the shared upregulated genes across ages including Igfbp7, Abcg1, Prx, Tbx3 and Mertk (Fig. 2c and Supplementary Table 2) and genes associated with oxidative stress, lipid metabolism and apoptotic clearance13,14. In old lung, senescent cells upregulate Serpine1, Dab2 and Mrc1 and downregulate Acoxl, Aldh1a1 and Prdx6, transcriptional signatures consistent with a fibrosis-prone and inflammation-prone associated state15,16 (Supplementary Fig. 1a, left). In young lung, senescent cells upregulate Dock10 and Vav3 and downregulate surfactant or repair genes (Sftpb, Sftpc and Etv5), consistent with a more transient, reparative senescent program17,18 (Supplementary Fig. 1a, right).
In mouse skin, senescent cells from both age groups commonly upregulate genes associated with epidermal differentiation and barrier maintenance (Krt1, Krt10, Lor and Sfn) (Fig. 2d and Supplementary Table 2), suggesting signatures consistent with preserved epithelial defense. Young skin-specific senescent cells showed upregulation of genes associated with differentiation and immune-interaction genes (Lce1a2, Flg2, Skint5 and Btc), implying a transcriptional pattern linked to active repair and immune readiness (Supplementary Fig. 1b, right). In contrast, old skin senescent cells show downregulation of genes associated with lipid metabolism (Cd36 and Cidec)19 and DNA-repair genes (Eepd1)20 (Supplementary Fig. 1b, left), reflecting diminished metabolic and regenerative function. These findings reveal a shift from signatures linked to a responsive senescent state in young tissues to signatures linked to a chronic, dysfunctional one in old tissues.
Cell-type-specific programs of senescence across ages
Subsequently, we analyzed AT2 cells, which support gas exchange and repair by serving as progenitors for AT1 cells, particularly during lung injury or senescence21. In both AT2-1 and AT2-2 cells, old senescent cells showed consistent upregulation of Serpine1 (Fig. 2e and Supplementary Table 2), a p53 pathway-linked inhibitor of AT2 renewal and epithelial repair22. In AT2-1 cells of old samples, senescent cells also upregulated Bcl2l1 and Igf1r, genes associated with enhanced survival and apoptosis resistance23, whereas Acoxl, involved in fatty acid metabolism24, was downregulated across all senescent cells (Fig. 2e). The DNA-repair gene Tex11 was elevated only in young senescent AT2-1 cells, and young AT2-2 senescent cells similarly enriched DNA damage and repair (DDR)-associated genes such as Brip1, Bora, Hells and Cep164 (Fig. 2e), collectively implying a transcriptional pattern consistent with age-related loss of DDR activity.
In skin, senescent IFE5 and IFE3 cells enriched ECM remodeling and protein-synthesis-related genes (Sfn and Eef1a1) (Fig. 2f and Supplementary Table 2), whereas young senescent IFE4 cells upregulated genes linked to active DNA damage response and cell-cycle regulation (Chek1, Ccnb1 and Cdca3), indicating a more dynamic and reparative senescent state (Fig. 2f). These patterns show that young tissues favor DNA-repair signatures, whereas old tissues favor survival, inflammation and metabolic programs.
Beyond these transcriptional programs, we also examined how senescent cells engage with their local microenvironment. Aging was associated with increased senescent cell–cell communication and elevated fibrosis- or remodeling-associated signaling (transforming growth factor-β (TGFβ) and collagen in lung and Notch and bone morphogenetic protein (BMP) in skin), suggesting that senescent cells actively remodel their surrounding tissue (Supplementary Note 1).
Spatially resolved aging and senescent signatures across tissues and ages
To overcome the lack of spatial information of snRNA-seq, we employed STARmap-ISS to target 890 genes in space (lung: old, n = 3; young, n = 3; skin: old, n = 3: young, n = 3) (Fig. 1a). Using label transfer from snRNA-seq references, we identified 16 distinct cell types in the lung and 20 in the skin (Fig. 3a,b and Extended Data Fig. 2a,b), and generated spatial maps of the major cell types to assess regional differences between young and old tissues (Extended Data Fig. 2c,d).
Fig. 3: Spatial transcriptomic landscape of senescent cells in mouse lung and skin at different ages.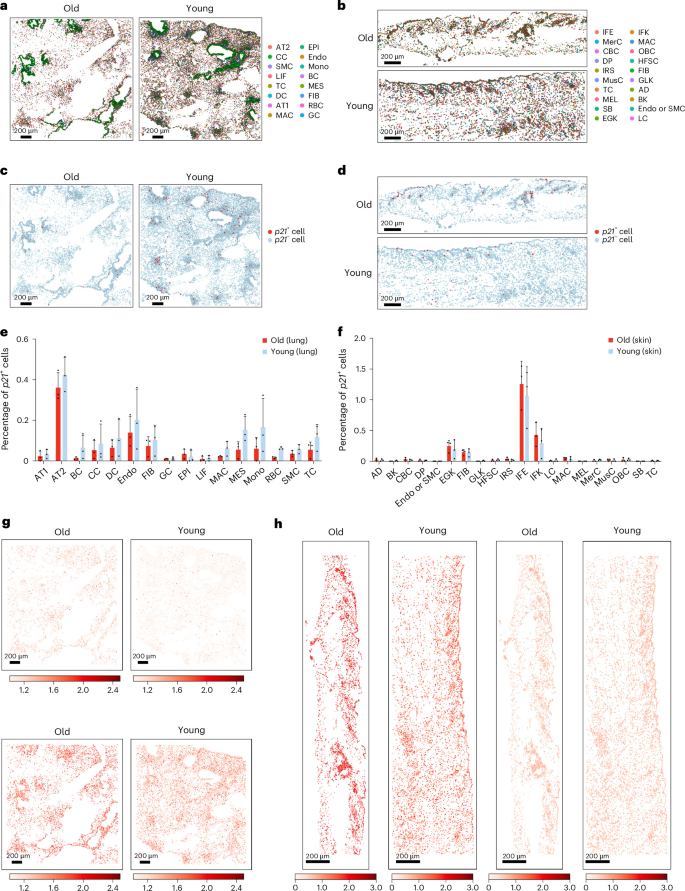
a,b, Major cell types identified by STARmap-ISS (890-gene panel) in mouse lung (a) and skin (b) via label transfer from snRNA-seq references, shown for representative old and young tissue sections. Cells are colored according to cell-type annotation. c,d, Spatial distribution of p21+ senescent cells across representative tissue sections from old and young mouse lung (c) and skin (d). For a–d, Images represent n = 3 mice per group (old, young), with similar cell-type and p21+ spatial distributions observed across all replicates. e,f, Bar plots showing the percentage of p21+ senescent cells at cell-type level in mouse lung (e) and skin (f) from STARmap-ISS data. The bars represent the mean ± s.d.; each dot represents an individual biological replicate (one mouse; n = 3 mice per group (old, young). g,h, Spatial visualization of Tangram-imputed expression of aging-associated genes identified by snRNA-seq in mouse lung (g; Klf2 (top) and Timp3 (bottom)), both upregulated in aged endothelial cells) and skin (h; Slit3, upregulated in the aged fibroblast cells (left); l31ra, downregulated in aged IFE cells (right)) across young and old tissue sections. Expression values are scaled per gene across all sections, with higher values indicating higher predicted expression.
To assess senescent cell distribution across cell types, we calculated the percentage of p21+ senescent cells in each annotated population. In mouse lung, AT2 cells exhibited the highest proportion of senescent cells (0.31–0.51%), followed by endothelial cells (0.06–0.36%), then immune cells such as dendritic cells (0.02–0.21%) and T cells (0.01–0.17%) (Fig. 3c,e). In mouse skin, the highest senescent cell composition was observed in IFE cells (0.53–1.55%), followed by IFKs (0.04–0.64%) and fibroblasts (0.07–0.20%) (Fig. 3d,f). Mapping the spatial distribution of p21+ senescent cells, we did not observe distinct differences between young and old lung (Fig. 3c), but identified a higher concentration of senescent cells in the epidermal region of old skin (Fig. 3d), consistent with the higher senescent cell proportion in IFE cells and IFKs (Fig. 3f), likely reflecting epidermal vulnerability to chronic UV exposure and oxidative stress. In addition, senescent cells also differed morphologically from their neighbors: p21+ senescent cells were consistently larger than nonsenescent cells across young and old skin, although the size of senescent cells declined with age (Supplementary Note 2).
Next, we enhanced spatial transcriptomic resolution from 890 genes to a whole-transcriptome scale by imputing single-cell transcriptomic profiles using Tangram25, yielding 19,812 and 18,931 imputed genes across 46,932 and 32,574 cells in old and young mouse lung, and 19,294 and 18,464 imputed genes across 13,153 and 18,583 cells in old and young mouse skin. Imputed expression of Scgb1a1 (club cell marker) in lung and Krt14 (BK marker) in skin showed strong spatial concordance with directly measured STARmap-ISS expression (Extended Data Fig. 3a,b).
Through snRNA-seq analysis comparing young and aged mouse lung, we identified aging-associated genes (for example, Timp3 and Klf2) that exhibit increased expression with age, with significant upregulation observed in endothelial cell populations (Fig. 1e) and canonical senescent markers, Igfbp7 and Serpine1, as well as potential senescent markers Abcg1 and Dab2 upregulated in p21+ senescent cells (Fig. 2c and Supplementary Fig. 1a). Spatially, Klf2 and Timp3 were upregulated in old lung tissue, with Timp3 enriched in luminal-adjacent regions, consistent with localization to adjacent stromal or perivascular compartments in aged lung tissue (Fig. 3g), consistent with its reported role in tissue-specific aging clocks26. Senescence-associated markers (for example, Igfbp7, Serpine1 and Dab2) showed no spatial distribution in lung tissue (Extended Data Fig. 3c,e), correlating with the p21+ cell distribution and consistent with TGFβ-associated, p21-dependent, cell-cycle arrest and ECM-remodeling programs14,16.
In mouse skin, aging was associated with upregulation of Slit3 in fibroblasts and downregulation of Il31ra in IFE cells (Figs. 1f and 3h). In contrast, Sbsn, Krt10, Lor and Dmkn were enriched in p21+ senescent cells in both young and old skin (Fig. 2d), with no significant difference between ages (Extended Data Fig. 3d,f). These findings suggest that the upregulation of these genes in senescent skin cells shows promoted keratinocyte differentiation and epidermal barrier maintenance.
Biochemical landscape and barcode of senescence with label-free hyperspectral Raman imaging
Raman microscopy captures the biochemical fingerprint of cells and tissues in a label-free, nondestructive manner by probing the vibrational energy levels of chemical bonds, without requiring extensive sample preparation. We conducted the hyperspectral Raman imaging (600–1,800 cm−1, 873 dimensions with a pixel size of 3 µm) for the same samples before we performed STARmap-ISS on them (Fig. 1a). To align these two different modalities, we performed registration using the DNA signal at 791-cm−1 Raman shift from Raman imaging and DAPI staining from STARmap-ISS (Fig. 4a). After registration, we identified 15,201 and 11,069 overlapping cells from Raman imaging and STARmap-ISS of mouse lung and mouse skin, respectively.
Fig. 4: Raman spectral profiling of senescent cells across tissues at single-cell resolution.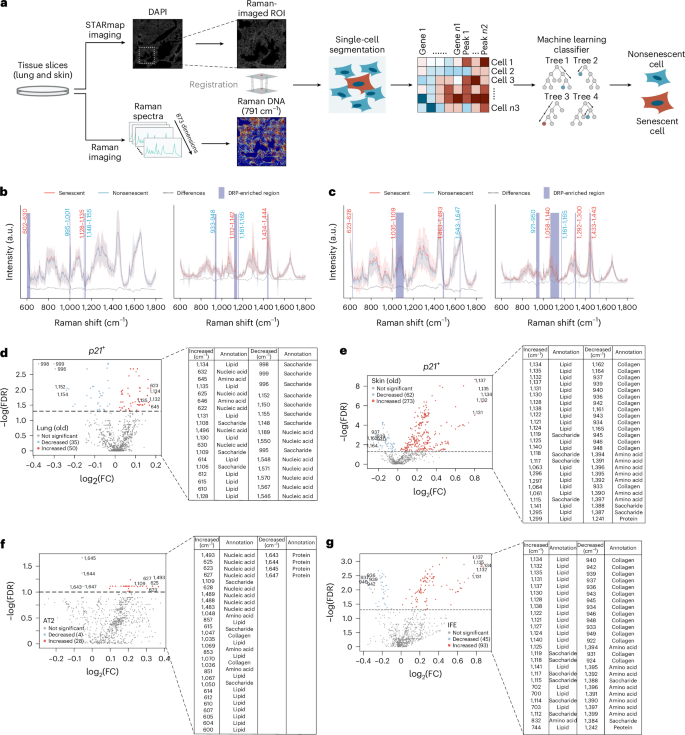
a, Workflow for integrating Raman imaging and STARmap-ISS for single-cell multimodal profiling. Raman spectra data (873 spectral dimensions) and STARmap-ISS transcriptomic data (890 genes) were obtained from the same tissue section. Co-registration of Raman DNA signal (791 cm−1) and DAPI signal from STARmap-ISS was performed for single-cell alignment and segmentation. Segmented cells were assigned to both Raman spectral vectors and transcriptomic profiles, enabling construction of the RamanOmics multimodal representation. A random forest machine learning classifier was applied to distinguish senescent from nonsenescent cells based on integrated features. b,c, Comparison of mean normalized Raman spectra (600–1,800 cm−1) of p21+ senescent cells (red line) and p21− nonsenescent cells (blue line) in mouse lung (b, left), mouse skin (b, right), AT2 cells (c, left) and IFE cells (c, right). Dashed lines represent the differential spectrum between the two groups. Shaded regions with Raman shift values indicate a DRP-enriched region. Red numbers denote the peak clusters enriched for increased DRPs and blue numbers the peak clusters enriched for decreased DRPs. d–g, Volcano plots showing the distribution of increased and decreased DRPs and their corresponding biochemical annotations in p21+ senescent cells from mouse lung (d), mouse skin (e), AT2 cells (f) and IFE cells (g) in old mouse samples. ROI, region of interest.
After performing cell-type label transfer, we identified 16 cell types in lung and 20 cell types in skin from the aligned cells between STARmap-ISS and Raman imaging (Supplementary Fig. 2a). They represent most cell types detected in our snRNA-seq data with a consistent pattern of senescent cell proportions observed across different samples and age groups from snRNA-seq (Fig. 2a,b and Supplementary Fig. 2b).
To localize senescent cells within Raman images, we used p21+ cells identified from STARmap-ISS as spatial anchors, enabling us to pinpoint their corresponding locations and boundaries in the Raman images (Fig. 4a). The subcellular resolution of Raman imaging allowed us to extract precise Raman spectra for both senescent and nonsenescent cells via Raman-STARmap image registration (Fig. 4b,c, Extended Data Fig. 4a,b and Methods).
Next, we compared Raman spectral intensities between old and young cells, as well as between p21+ senescent and p21− nonsenescent cells across different cell types. We focused on the fingerprint region of the Raman spectra (600–1,800 cm−1, 873 dimensions in total), corresponding to key biomolecules such as proteins (amide I, 1,640–1,680 cm−1; amide III, 1,230–1,310 cm−1), lipids (1,400–1,500 cm−1, 1,250–1,300 cm−1 and 1,200–1,050 cm−1) and nucleic acids (guanine, 785 cm−1, 937 cm−1 and 1,234 cm−1; adenine, 536 cm−1, 1,125 cm−1 and 1,482 cm−1; and cytosine, 792 cm−1 and 1,275 cm−1). We visualized spectral distributions at tissue and cell-type levels, identifying multiple differential Raman peaks (DRPs) that reflect unique chemical bonds and vibrational modes between old and young cells (Extended Data Fig. 4a,b). In parallel, we examined p21+ and p21− cells in mouse lung and skin, at both tissue-type and cell-type resolved manner and identified several highly variable peak regions indicative of biochemical alterations associated with senescence (Fig. 4b,c).
We quantified these differences at single-cell resolution by averaging Raman spectral intensity values from pixels within segmented single cells (Supplementary Table 3), aggregating spectral intensities over defined cell boundaries (Methods). This allowed us to compare Raman intensities between different cells at single-cell resolution.
At the tissue level, old lung samples exhibited higher Raman intensity than young samples (46.7208 ± 28.5472 versus 43.2734 ± 11.3974, P = 2.10 × 10⁻¹³), whereas Raman intensity was lower in old skin T cells (42.4769 ± 20.1176 versus 43.0874 ± 11.1290, P = 4.60 × 10⁻⁷), although this difference was not significant in skin at either the tissue or the cell-type level (Supplementary Fig. 3a,c). It is interesting that global p21+ senescent cells (42.4222 ± 21.1448 versus 45.4257 ± 11.0594, P = 1.36 × 10⁻³) and p21+ senescent mesenchymal cells (33.9772 ± 6.5056 versus 50.7784 ± 11.3752, P = 1.59 × 10⁻²) showed decreased Raman intensity in old compared to young lung samples (Supplementary Fig. 3b). In contrast, mouse skin exhibited increased Raman intensity in global p21+ senescent cells and p21+ IFE cells (106.2784 ± 104.2692 versus 69.4230 ± 62.9351, P = 1.31 × 10⁻⁶) in young samples (Supplementary Fig. 3d). Together, aging in lung was generally associated with elevated Raman intensity at the tissue level, but reduced intensity in specific immune populations, whereas skin showed cell-type-specific spectral profiles distinguishing aging from senescence.
Leveraging the broad Raman shift range (600–1,800 cm−1) captured from hyperspectral Raman imaging, we investigated biochemical differences across tissues and cell types in aging and senescence analysis. A total of 360 decreased and 442 increased DRPs were identified between young and old mouse lung tissues (with adjusted P (Padj) ≤ 0.05), whereas 462 decreased and 276 increased DRPs were found in old versus young skin (Extended Data Fig. 4c,d). Within endothelial cells of the lung, 247 decreased and 267 increased DRPs were detected, largely mirroring the tissue-level lung changes (Extended Data Fig. 4e). Similarly, in the skin, 441 decreased and 277 increased DRPs were observed in IFE cells, highly consistent with the tissue-level Raman shifts (Extended Data Fig. 4f).
In the senescence analysis, we identified 50 increased and 35 decreased DRPs in p21+ senescent cells compared to p21− nonsenescent cells in old lung (Fig. 4d) and 273 increased and 62 decreased DRPs at the tissue level in old skin (Fig. 4e). Cell-type-specific analysis further revealed 28 increased and 4 decreased DRPs in senescent AT2 cells of old lung (Fig. 4f) and 93 increased and 45 decreased DRPs in senescent IFE cells of old skin (Fig. 4g). In the old versus young comparisons, endothelial cells shared a substantial overlap with the whole-lung Raman profile and IFE cells similarly reflected whole-skin patterns, although with tissue-specific differences (Extended Data Fig. 4c–f). Likewise, in the senescent versus nonsenescent analyses, senescent AT2 and IFE cells partially recapitulated the core features of tissue-level senescence signatures in old lung and skin, respectively, with differences reflecting cell-type-specific biochemical compositions (Fig. 4f,g). Together, these findings suggest that Raman peak shifts capture shared core biochemical features of aging and senescence, while also reflecting the cellular and extracellular heterogeneity of each tissue and cell type.
Our analysis revealed consistent Raman spectral changes associated with aging and senescence in mouse lung and skin tissues. Leveraging Raman peak annotation databases and literatures27,28,29,30, we observed that, in old lung tissue and endothelial cells, lipid-associated (1,145 cm−1) and saccharide-associated (996 cm−1) Raman peaks were increased, whereas nucleic acid-associated peaks (782 or 790 cm−1) were reduced (Extended Data Fig. 4c,e). In the old skin tissue and IFE cell population, lipid-associated Raman peaks (1,440 or 1,438 cm−1) were increased, whereas carotenoid-like conjugated C=C-associated peaks (1,524 or 1,517 cm−1) were reduced, highlighting the increased lipid-related signatures in aged tissues (Extended Data Fig. 4d,f). Peaks at 1,134 or 1,135 cm−1, corresponding to lipid-associated Raman features and consistent with branched-chained fatty acid-related structures, were significantly elevated in p21+ senescent cells across tissue types and specifically IFE cells (Fig. 4d,e,g). Lipids with branched-chain characteristics are known to influence membrane fluidity, cellular signaling, inflammation and metabolic responses31. In senescent AT2 cells, nucleic acid-associated Raman peaks (1,493 or 623 cm−1) were increased (Fig. 4f), suggesting alterations in nucleotide-related molecular features. Conversely, saccharide-associated peaks at 996 or 999 cm−1 were reduced in old mouse lung (Fig. 4d), whereas collagen-related peaks at 1,162 or 937 cm−1 were decreased in old mouse skin (Fig. 4e). At the cell-type level, spectral declines were also noted, with protein-associated peaks at 1,645 or 1,647 cm−1 decreased in senescent AT2 cells (Fig. 4f) and collagen-associated peaks at 940 or 937 cm−1 reduced in senescent IFE cells (Fig. 4g). All these changes indicate coordinated shifts in biochemical features associated with senescence, characterized by increased lipid-related signals and concurrent reductions in saccharide-associated and protein-associated features, along with alterations in nucleic acid-associated signals, collectively reflecting broad molecular remodeling in senescent cells.
To spatially visualize Raman intensities within STARmap-ISS segmented cells, we mapped Raman signals on to these segmented cells (Methods). Consistent with our previous DRP analysis, we observed notable changes in Raman intensities (both increases and decreases) between senescent and surrounding nonsenescent cells (Extended Data Fig. 5a,b), especially within the most variable peak regions at the subcellular level. Specifically, the peaks associated with lipid at 1,134 or 1,135 cm−1 exhibited elevated intensities in senescent cells across lung and skin tissue, as well as in senescent IFE cells at the cell-type level (Extended Data Fig. 5a,b). However, senescent AT2 cells displayed distinct peak changes, with nucleic acid-associated peaks at 1,493 or 625 cm−1 showing increased Raman intensities (Extended Data Fig. 5b). Conversely, Raman intensities decreased at various peaks at both global tissue and cell-type levels. The saccharide-associated peak at 999 cm−1 and collagen-associated peak at 934 cm−1 showed reduced intensities in senescent cells in lung and skin tissues, respectively (Extended Data Fig. 5a), whereas intensities at 1,643 or 1,645 cm−1 (protein) in senescent AT2 cells and peaks at 940 or 937 cm−1 (collagen) in senescent IFE cells were reduced (Extended Data Fig. 5b). These Raman intensity changes at tissue-wide and cell-type-specific levels underscore the biochemical alterations associated with cellular senescence and reveal potential Raman markers to understand cellular senescence.
Given that the DRPs contribute substantially to distinguishing old cells from young cells, as well as senescent cells from nonsenescent cells, we developed a DRP barcode system to assign each cell a unique barcode ID for accurate classification of senescence based on Raman features (Methods). By integrating the top 30 increased and top 30 decreased DRPs (28 increased and 4 decreased DRPs for AT2 cells), we generated specific barcodes for old cells and young cells (Extended Data Fig. 6a,b), as well as for p21+ senescent and p21− nonsenescent cells across different tissues and cell types, as well as for p21+ senescent cells from both old and young samples (Extended Data Fig. 6c,d). This barcode framework delineates DRP differences across conditions and identifies unique and overlapping biochemical signatures distinguishing senescent cell states, offering insight into the heterogeneity of cellular senescence.
Spatially resolved multimodal molecular and biochemical landscapes of senescence
Anchoring on p21+ cells connects transcriptomic and biochemical alterations to the senescence phenotype. Using this framework, we applied a multimodal approach integrating Raman spectra with snRNA-seq data in old samples, with STARmap expression profiles serving as spatial anchors (Methods). From the aligned cells, we selected the top DRPs (top 30 increased and top 30 decreased for tissue level and IFE cells, 28 increased and 4 decreased for AT2 cells) and combined with all selected differentially expressed genes (DEGs) from snRNA-seq (37 upregulated and 29 downregulated for mouse lung, 17 upregulated and 29 downregulated for mouse skin, 7 upregulated and 2 downregulated for AT2 cells and 5 upregulated and 3 downregulated for IFE cells) to create a multimodal digital representation of cells (Fig. 1a). To evaluate the performance, we built a random Forest classifier based on individual Raman features, snRNA-seq features and combined multimodal features using 70% of the cells for training and 30% for testing. Performance metrics (accuracy, area under the curve (AUC) and precision) substantially improved in both tissues when Raman features were added to the snRNA-seq data, with accuracy increased by 5.36% to 5.87% (from 0.7368 to 0.7763 for mouse lung and from 0.6182 to 0.6545 for mouse skin), AUC score increased by 2.64% to 5.91% (from 0.7450 to 0.7647 for lung and from 0.6819 to 0.7222 for skin) and precision score increased by 5.36% to 13.45% (from 0.6809 to 0.7174 for lung and from 0.6296 to 0.7143 for skin) (Fig. 5a). The Raman-only model also performed better in skin than lung across metrics (for example, 0.6000 versus 0.4868 for accuracy and 0.672 versus 0.5367 for AUC) (Fig. 5a), which may reflect the higher proportion of p21+ senescent cells in skin tissue (Fig. 3e,f). As the outermost barrier of skin is chronically exposed to UV and pollution, this likely accelerates senescence and its associated Raman-detectable biochemical changes.
Fig. 5: Multimodal integration and characterization of senescent cells.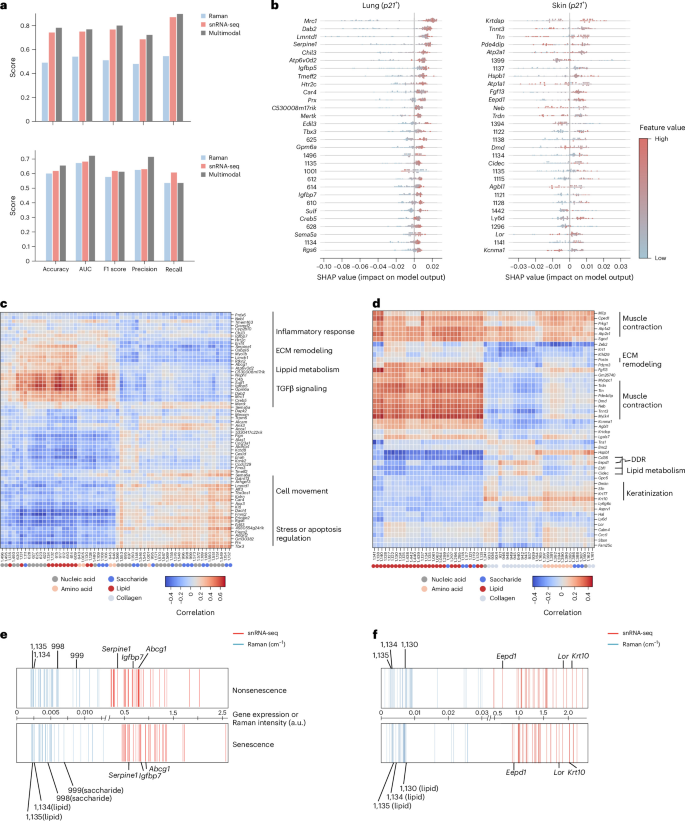
a, Bar plots displaying classifier performance metrics for Raman-only, snRNA-seq-only or integrated multimodal datasets applied to mouse lung (top) and skin (bottom). b, SHAP summary plots showing the contribution of the top 30 predictive features (Raman peaks and genes) to senescent cell classification at the single-cell level. The x axis represents the SHAP value indicating the direction and magnitude of each feature’s contribution to senescent cell prediction. The y axis lists the features sorted by mean absolute SHAP value. Each dot represents a single cell. c,d, Heatmaps showing pairwise correlations between the selected top DRPs (60 for lung, 60 for skin) and DEGs (66 for lung, 46 for skin) in p21+ senescent cells from mouse lung (c) and skin (d). Raman peaks and gene functions were manually annotated. e,f, Stripe barcode plots representing the most important multimodal features distinguishing p21+ senescent from p21− nonsenescent cells in mouse lung (e) and skin (f). Each vertical stripe corresponds to a single feature, with genes (DEGs, red) and Raman-derived features (DRPs, blue) shown separately. Features are ranked by their mean normalized values and displayed as the top 60 multimodal features (32 DEGs and 28 DRPs for mouse lung and 30 DEGs and 30 DRPs for mouse skin). Stripes are slightly offset to prevent overlap and representative features are annotated.
We then extracted and ranked the top 30 multimodal features (DRPs and DEGs) that substantially contributed to the prediction using both random Forest feature importance and SHapley Additive exPlanations (SHAP) methods (Fig. 5b and Extended Data Fig. 7a,b). Both approaches identified largely consistent genes and Raman peaks as key contributors. Specifically, we identified the DEGs Mrc1, Dab2, Igfbp7 and Serpine1 and DRPs 1,134 cm−1 (lipid), 1,135 cm−1 (lipid) and 625 cm−1 (nucleic acid) from mouse lung, as well as genes Hspb1, Lor and Krtdap and peaks 1,134 cm−1 (lipid), 1,135 cm−1 (lipid) and 1,137 cm−1 (lipid) from mouse skin, which were upregulated in senescent cells and demonstrated strong predictive power in both methods (Fig. 5b and Extended Data Fig. 7a). These findings support multimodal integration improving the accuracy of senescent cell identification and the robustness of our feature importance extraction methods.
Subsequently, we analyzed the positive and negative contributions of the top-ranked features using both feature importances from the classifier and SHAP values (Methods). In mouse lung, the Raman peak at 625 cm−1 (nucleic acid) and the genes Mrc1, Dab2 and Serpine1 consistently ranked among the most important features in both senescent and nonsenescent cells (Extended Data Fig. 7c). In addition, specific Raman peaks, such as 612 cm−1 (lipid), were distinctly upregulated in senescent lung cells, contributing substantially to their classification (Extended Data Fig. 7c). In mouse skin, Krtdap and Dmd were among the top-ranked markers of senescent cells, whereas Ttn and Cidec were preferentially ranked in nonsenescent populations (Extended Data Fig. 7d). Key lipid-associated Raman peaks, 1,134 or 1,135 cm−1, were among the most important discriminative features in both classes (Extended Data Fig. 7d). Together, these results indicate that transcriptomic features (Dab2 and Serpine1 in lung, Ttn and Krtdap in skin) are critical for senescence classification, whereas Raman-derived biochemical features provide complementary and orthogonal information that enhances the precision and robustness of senescence classification.
We next visualized single-cell SHAP values to identify features with positive and negative prediction influence. In mouse lung, genes Dab2, Igfbp7 and Serpine1, and Raman peaks at 625 cm−1 (nucleic acid) and 1,135 cm−1 (lipid), positively contributed to senescent cell identification (red dots with positive SHAP values), whereas peaks at 1,001 cm−1 (amino acid) were associated with nonsenescent cells (red dots with negative SHAP values) (Fig. 5b). Similarly, in mouse skin, genes Krtdap, Hspb1 and Lor, and peaks at 1,134 cm−1 (lipid), 1,135 cm−1 (lipid) and 1,128 cm−1 (lipid), supported senescent cell identification (Fig. 5b). These findings align closely with our independent snRNA-seq and Raman analyses, supporting the robustness of our multimodal approach across tissues.
Intertwined and multilayered transcriptional, metabolic and structural rewiring in senescence
To systematically link biochemical spectral variations with transcriptional programs, we established a DRP–DEG framework that integrates DRPs derived from Raman imaging with DEGs identified by snRNA-seq to generate multimodal representations of cellular states. Although broadly applicable, we applied this framework here to characterize senescence as a cellular state.
By directly linking Raman spectral peaks to individual genes, we could uncover multilayered molecular pathways and biochemical compositions that define the senescent phenotype. To achieve this, we performed correlation analyses between DRPs and DEGs that enable us to assign clear biological importance to specific Raman features (Fig. 1a and Methods).
In mouse lung, we identified distinct Raman peak clusters, including 602–630 cm−1 (607 cm−1, lipid; 614 cm−1, lipid), 1,106–1,111 cm−1 (1,108 cm−1, saccharide; 1,109 cm−1, saccharide); and 1,128–1,135 cm−1 (1,130 cm−1, lipid; 1,131 cm−1, lipid; 1,134 cm−1, lipid; 1,135 cm−1, lipid). These peaks were significantly elevated in senescent cells and correlated with upregulation of genes involved in ECM remodeling (Serpine1 and Sulf1)15, lipid metabolism (Abcg1)13 and the TGFβ signaling pathway (Dab2 and Igfbp7)14 (Fig. 5c). In contrast, peak clusters 995–1,001 cm−1 (996 or 999 cm−1, saccharide), 1,148–1,155 cm−1 (1,148, 1,150, 1,152 or 1,155 cm−1, saccharide) and 1,544–1,576 cm−1 (1,550, 1,567 or 1,570 cm−1, nucleic acid), which were reduced in senescent cells, were associated with anti-apoptotic activity (Tbx3) and cell motility (Fmnl2 and Kalrn) (Fig. 5c). Collectively, these findings highlight key biochemical alterations in senescent cells, particularly in ECM remodeling, lipid metabolism and stress response pathways, which together contribute to the senescence phenotype in lung tissue.
In mouse skin, elevated Raman peak clusters at 1,112–1,141 cm−1 (for example, 1,128, 1,130, 1,131, 1,134 or 1,135 cm−1, lipid) and at 1,434–1,444 cm−1 (for example, 1,438, 1,439 or 1,440 cm−1, lipid), coinciding with transcriptomic downregulation of genes involved in ECM (Postn) and muscle contraction (Tnnt3 and Ttn) and upregulation of keratinization genes (Sbsn and Lor) (Fig. 5d). In contrast, decreased peaks at 933–948 cm−1 (for example, 934 or 940 cm−1, collagen) and 1,161–1,165 cm−1 (for example, 1,161 or 1,162 cm−1, collagen) were associated with downregulation of genes linked to DNA damage response (Eepd1) and upregulation of genes associated with skin barrier maintenance (Sfn and Krt10). Together, these multimodal signatures are consistent with lipid remodeling and reinforced differentiation-associated transcriptional programs in senescent cells, accompanied by impaired DNA repair and compensatory barrier homeostasis, hallmarks of skin aging and senescence.
Subsequently, we further analyzed the DRP–DEG correlation at the cell-type level for AT2 and IFE cells. In senescent AT2 cells in lung, elevated Raman peak clusters at 600–615 cm−1 (for example, 607 or 614 cm−1, lipid), and 623–628 cm−1 (for example, 623 or 625 cm−1, nucleic acid), were correlated with genes associated with ECM remodeling (Pcsk6 and Serpine1) and cell senescence (Meg3). By contrast, decreased peaks in the 1,643–1,647 cm−1 range were correlated with downregulation of Tex11 and Acoxl, genes associated with DDR and lipid metabolism, respectively (Extended Data Fig. 7e). These multimodal associations are consistent with transcriptional and biochemical signatures of reduced genome maintenance and lipid metabolic activity in senescent AT2 cells.
In skin senescent IFE cells, increased peaks at 1,112–1,141 cm−1 (for example, 1,131 or 1,135 cm−1, lipid) were correlated with downregulated genes with DDR (Rad51b) and inflammatory response (Sema5a), suggesting that lipid-associated biochemical changes in senescent IFE cells co-occur with reduced expression of DNA repair and immune regulatory genes. In contrast, decreased Raman peaks at 922–949 cm−1 (for example, 934 cm−1, collagen) and 1,382–1,404 cm−1 (for example, 1,392 or 1,395 cm−1, amino acid) were associated with the downregulation of Antxr1 (ECM remodeling), but strongly correlated with the upregulation of keratinization-related genes (Krt10, Krt77, Krtdap, Sbsn and Dmkn) (Extended Data Fig. 7f).
To increase resolution beyond transcript-only markers, we integrated high-dimensional Raman spectra with RNA-seq and extended our DRP barcoding to a RamanOmics barcode that incorporates DEGs into the DRP framework. Using the top predictive multimodal features (Methods), we generated cell-type-specific barcodes that distinguish p21+ senescent from p21− nonsenescent cells across both global tissues (lung and skin) and specific cell types (AT2 and IFE cells) (Fig. 5e,f and Extended Data Fig. 7g,h).
This approach provides an intuitive, quantitative display of senescence multimodal signatures, enabling classification of senescent states based on integrated biochemical and transcriptional features. The RamanOmics barcode improves senescence classification and resolves cellular heterogeneity across tissues, establishing a broadly applicable biometrological framework for multimodal characterization of senescent cells.
Validation of multimodal senescence programs in wound repair
To validate the identified senescent signatures and programs in a pathologically relevant context, we employed a mouse skin wound-healing model, which faithfully recapitulates the transient and dynamic induction of senescent cells during tissue regeneration12. Using STARmap-ISH after Raman imaging, we observed that, on day 3 following wounding (D3), expression of the canonical senescence marker p21 was markedly increased compared with unwounded skin (D0) in old mouse (Fig. 6a and Extended Data Fig. 8a), consistent with a prior report32. Importantly, p21 induction was accompanied by upregulation of senescence-enriched epidermal differentiation and barrier-repair genes (Krt10, Dmkn, Lor, Sbsn and Sfn) (Fig. 6b and Extended Data Fig. 8a), in line with their identification in our snRNA-seq analysis (Fig. 2d). These findings confirm that these genes are co-activated with senescence during wound repair, supporting the convergence of senescence and epidermal differentiation programs in this context.
Fig. 6: Validation of molecular and biochemical signatures in a mouse skin wound-healing model.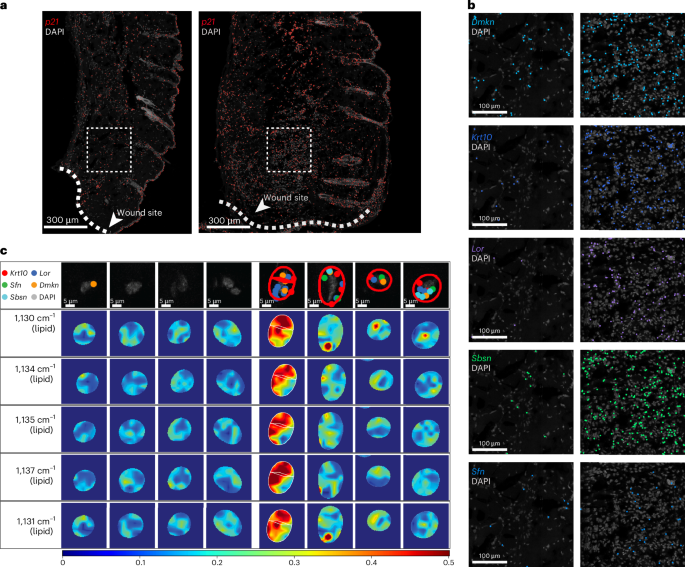
a, Spatial distribution of p21 expression at the wound site of old mouse skin at baseline (D0; left) and 3 d after injury (D3; right), detected by STARmap-ISH. b, Higher-magnification views of the regions indicated by the white dashed boxes in a, showing expression of Dmkn, Krt10, Lor, Sbsn and Sfn in D0 (left) and D3 (right) tissue sections. For a and b, images represent n = 3 mice per group (D0, D3), with similar spatial distributions observed across all replicates. c, Representative Raman intensity maps of senescence-associated Raman peaks overlaid with spatial distribution of senescence-enriched differentiation genes (Krt10, Sfn, Lor, Sbsn and Dmkn) detected by STARmap-ISH in skin p21− (left) and p21+ (right) cells. Red lines indicate the segmented cell boundaries of p21+ cells.
We next examined whether the biochemical markers of senescence identified by Raman imaging were also conserved during wound repair. Consistent with our multimodal analysis, senescent cells in wounded skin displayed increased Raman intensities at 1,130, 1,134 or 1,135 cm−1, corresponding to lipid, along with increased expression of the senescence-enriched markers (Fig. 6c). These changes reinforce the conclusion that lipid remodeling is a prominent biochemical feature associated with the senescent state in vivo.
Together, these experiments confirmed that Dmkn, Krt10, Lor, Sbsn and Sfn p21+ senescent cell-enriched, epidermal differentiation genes are co-activated with senescence during wound repair, alongside lipid-associated Raman peaks at 1,130, 1,134 or 1,135 cm−1, establishing a convergent multimodal profile of senescence in mouse skin with relevance during tissue regeneration. More broadly, they demonstrate that the power of integrating Raman spectroscopy with spatial transcriptomics strengthens validation and mechanistic deconvolution of senescence signatures in complex tissue settings.
In summary, based on p21+ versus p21− comparisons within aged tissues, our study demonstrates that senescent cells in mouse lung are associated with transcriptional and biochemical signatures consistent with altered lipid metabolism (for example, Abcg1), ECM remodeling (for example, Serpine1 and Sulf1)15 and increased lipid-associated Raman peaks (for example, 1,134 or 1,135 cm−1), along with decreased saccharide-associated Raman peak intensities (for example, 998 or 999 cm−1) (Extended Data Fig. 8b). In contrast, senescent cells in mouse skin are associated with transcriptional signatures linked to epidermal differentiation and barrier maintenance, including senescence-enriched genes (for example, Sfn and Krt10), accompanied by increased lipid-associated Raman peaks (for example, 1,134 or 1,135 cm−1). These cells also show decreased expression of genes linked to muscle contraction (for example, Tnnt3 and Dmd), DDR (for example, Eepd1), together with reduced collagen-associated Raman peak intensities (for example, 1,162 or 937 cm−1), multimodal patterns consistent with remodeling of collagen and ECM-associated molecular features (Extended Data Fig. 8b).
Together, these observations highlight shared and tissue-specific transcriptional and biochemical features of senescence across organs. By integrating biochemical composition with gene expression at single-cell resolution, our framework provides a multimodal approach to characterize senescence-associated states and offers a platform to interrogate how these states may contribute to diverse biological processes, including wound healing, fibrosis and tissue remodeling.