
Analysis set from the NO.MS database
The NO.MS database was previously described20. In brief, it comprises 39 clinical trials from 2003 to April 2021, approved by institutional review boards (IRBs) or ethics committees (‘Ethics’ subsection and Supplementary Table 5.2) and conducted following the principles of the Declaration of Helsinki and Good Clinical Practice. All patients from all 39 trials provided written informed consent. Trial protocols prospectively defined the objectives, eligibility, endpoints, assessments and statistical analyses. The individual study results were previously published. Data were deidentified in a risk-based approach as reported elsewhere56,57. For this analysis, all phase 2 and 3 studies conducted in RRMS, SPMS or PPMS and their corresponding open-label extensions were selected based on the availability of protocol-defined standardized clinical assessments and regular MRI acquisitions. Studies contributing to the analysis are listed in Extended Data Table 1. In addition, an analysis of the wider NO.MS database, including all patients with clinical assessments of relapses and EDSS, investigated the risk of relapses and progression from pediatric MS to adult MS and from RRMS to SPMS and PPMS and identified a decreasing gradient of focal inflammation and an increasing gradient of the risk of progression10.
Ethics
The ethics committees and IRBs used in the nine NO.MS source studies included: Alta Bates Summit IRB; Asahikawa Medical Center IRB; Ascension Wisconsin IRB; Aurora IRB; Baltimore IRB; Biomedical IRB; CentraState IRB; Central Ethics Committee; Chiba University Hospital IRB; Christiana Care IRB Helen F.; Copernicus Group IRB; Crescent City IRB; Dean IRB; Ebara Hospital IRB; Ehime University Hospital IRB; Georgetown University IRB; Health Sciences Institutional Review Boards; Health Sciences Campus IRB; Health System IRB; Healthcare -IRB; Henry Ford Hospital IRB; Hospital IRB; IRB University of California Davis; IRB of Beijing Hospital; IRB of West China Hospital; IRB-WB2; IRB/OSA; IRBMED; Institutional Ethics Committee, Bakirkoy; Institutional Ethics Committee, Dokuz Eylul; Institutional Ethics Committee, Ege; Institutional Ethics Committee, Gazi; Institutional Ethics Committee, Gaziantep; Institutional Ethics Committee, Hacettepe; Institutional Ethics Committee, Istanbul; Institutional Ethics Committee, Mersin; Institutional Ethics Committee, Uludag; Iwate Medical University Hospital IRB N/A; Johns Hopkins IRB; Keio University Hospital IRB; Kyoto Min-iren Chuo Hospital IRB; Lifespan IRB; Local Ethics Committee of AHEPA; Multicentric Ethics Committee IKEM; NIMS Institutional Ethics Committee; National Ethics Committee; Network IRB; Osaka University Hospital IRB; Pro Health Care IRB Research; Providence Health & Service IRB; Providence Health & Services IRB; Psychiatry IRB; Quorum Review IRB; Research Ethics Committee; Saitama Medical Center IRB; Schulman Associates, IRB; Sone Clinic IRB; The Ethics Committee of Sri; University IRB; University of Colorado Health IRB; University of Utah IRB; WIRB; WakeMed IRB; Wayne State University IRB; and Wheaton Franciscan Healthcare IRB N/A (see Supplementary Table 5.2 for full list and further details).
Clinical assessments in NO.MS
For all the trials included in the NO.MS analysis set, the following clinical assessments, which are commonly used in MS clinical trials, have been regularly monitored (typically every 3 months or 6 months; for details, see the individual protocols and study designs) by specifically trained healthcare professionals:
EDSS58,59: a standard tool for assessing the neurological disability status and disability progression, ranging from 0 (neurologically normal) to 10 (death due to MS).
T25FWT60: an objective quantitative measure of neurological function (patient’s walking speed).
9HPT60: an objective quantitative measure of upper extremity (arm and hand) function.
PASAT61: an objective measure of cognitive function that specifically assesses auditory information processing speed and flexibility as well as calculation ability.
Relapse occurrence: defined as the appearance of a new neurological abnormality or worsening62, as experienced by the patients and reported by the study investigator. Patients who experienced new or worsening symptoms were instructed to come for an unscheduled visit where symptoms were assessed (with an EDSS assessment performed), and onset as well as end date were recorded by the physician. Patients were transferred to an EDSS rater (in phase 3 trials) and an independent physician for the EDSS assessment. In the present analysis, all patient-experienced and physician-reported new or worsening symptoms are considered, irrespective of the EDSS confirmation.
It should be noted that such visits could happen at any time and would typically occur in unscheduled visits between the regular scheduled visits. For this reason, to capture the timing of events adequately, a monthly grid was used for modeling purposes.
Radiological assessments in NO.MS
In NO.MS, all images obtained according to study-specific standardized protocols were reanalyzed centrally by the Big Data Institute in Oxford, United Kingdom, using a harmonized MRI pipeline on standard MRI outcomes in MS (normalized brain volume using SIENAX63, part of FSL 6.0; percentage brain volume change using SIENA64, part of FSL 6.0). Gd-enhancing lesions and T2 lesion volume were used as reported in the original trials.
Variables in NO.MS
The clinical and radiological variables used in our modeling are presented in Table 2, and their assessment is described in the previous two Methods subsections. Demographic and disease-related features are updated longitudinally. For each visit, the patient’s age is updated, and the normalized brain volume is calculated based on the normalized brain volume measured at baseline (using SIENAX63) and the percentage change from baseline measured at post-baseline visits (using SIENA64). Lesion assessments were done centrally as previously reported for each of the original trials.
Demographic features and the diagnosed phenotype of MS (RRMS, SPMS or PPMS) were not used in the modeling but are reported across visits for the disease states newly identified by the model to characterize the patients in a specific state and to help establish the link between the newly proposed FAHMM states and the traditional classification of MS. PIRA was derived as a 3-month EDSS-confirmed irreversible worsening of disability in the absence of relapses10.
FAHMM
The proposed hierarchical model uses a PFA65 model to find a parsimonious representation of data. It exploits the shared information among elements of observed data to find MS dimensions (loading matrix) and corresponding composite scores (latent variables) that are continuous and a posteriori following a normal distribution. The spike and slab prior with Laplace components on the loading matrix favors sparsity that helps with the interpretation of MS dimensions. The number of MS dimensions is determined in a data-driven manner by putting an Indian buffet process prior on the inclusion/exclusion binary variables of spike and slab prior. Moreover, it helps with assigning observed variables to the MS dimensions by using a posterior probability of inclusion to the slab component greater than 0.5.
Next, our model assumes that the composite scores follow an HMM with multivariate normal emission distribution66. For modeling purposes, only the time gap between two consecutive visits is assumed to be 1 month (except for MS PATHS where it is assumed to be 6 months; see Supplementary Information Section 5 for more details). The HMM models MS evolution over time by (1) finding homogeneous disease states (latent unobserved) where the distribution of longitudinal composite scores is similar in terms of mean and covariance and (2) characterizing the progression between states by a transition probability matrix where all transitions are a priori possible (we are not restricting the transition probability matrix or assuming any structure). The number of states is determined by using the BIC.
Our proposed probabilistic multivariate model for disease evolution using longitudinal data is capable of handling mixed data modalities (binary, count and continuous) and missing data. The allocation of the observed variables to the MS dimensions does not change over time, which translates into a fixed loading matrix across visits. However, the composite scores are changing over time. The PFA uses baseline data where there are no missing data to estimate the loading matrix, and then the rest of the model parameters are estimated conditionally on the estimated loading matrix.
The model parameters are estimated using an expectation–maximization algorithm67. To evaluate the proposed classification’s predictive performance for the prognostication of an individual patient’s risk to transition into an advanced state of MS, the effect of DMTs and the characterization of individual states, the estimated FAHMM model is used to assign each visit to the corresponding disease and clinical states using the Viterbi algorithm67. The states are characterized by calculating the mean and s.d. of the corresponding variables. The disease states and transition probabilities are illustrated in Supplementary Fig. 5.1.
A discrete time-to-event analysis using Bayesian Additive Regression Trees (BART)68 was used to evaluate the prognostication performance of the clinical (meta-)states (Results). Time to first transition to one of the advanced states for patients who are in the early, relapse or asymptomatic states at baseline was predicted using baseline radiological and clinical features and demographic characteristics, including age, sex, treatment, relapses and number of relapses before entering the trial.
A continuous-time Markov model was used to assess the association between the use versus non-use of a DMT on the transition probabilities between clinical (meta-)states (msm package69).
Replication in holdout data from NO.MS
The analysis was based on a total dataset of 8,023 patients that was randomly divided into a discovery set (6,419 patients) for analysis purposes and a holdout set (1,604 patients) for validation purposes. The k-means clustering method was used to identify a homogeneous group of patients using the average of longitudinal composite scores per patient. The clustering method found five different groups using the elbow approach, where 80% of patients in each group are randomly assigned to the discovery set and the remaining 20% to the validation set.
More methodological details can be found in Supplementary Information Section 5.
Sensitivity analysis
A sensitivity analysis was conducted to check whether the disease states and transition pattern for ‘bout-onset MS’ (RRMS and SPMS) is similar to that of PPMS. A separate model was fit to RRMS/SPMS (excluding patients with PPMS) and to patients with PPMS alone.
Another sensitivity analysis was conducted without data imputation. This approach presents inherent complexities as the model requires complete data for all visits, whereas relapses can occur at any time, and other assessments are often unavailable at these timepoints. To conduct an analysis without data imputation, it was, therefore, necessary to remap all available data to annual visits based on the availability of MRI scans. This approach has the limitation that all data points collected between these annual visits are either ignored or shifted in time. After remapping the data to annual visits, the model was fit to these ‘complete case’ data.
External validation on independent datasets
After submitting the initial version of this paper to Nature Medicine based on the NO.MS data, we sought to ensure the reproducibility and generalizability of our findings through validation using independent external datasets where we established predefined validation criteria prior to accessing these datasets. The model was then fitted to each external dataset, including an independent clinical trial dataset (Roche MS dataset) and a real-world cohort (MS PATHS), confirming the reproducibility of our results following the data preparatory steps described further in this section.
Validation step 1: replication of MS dimensions
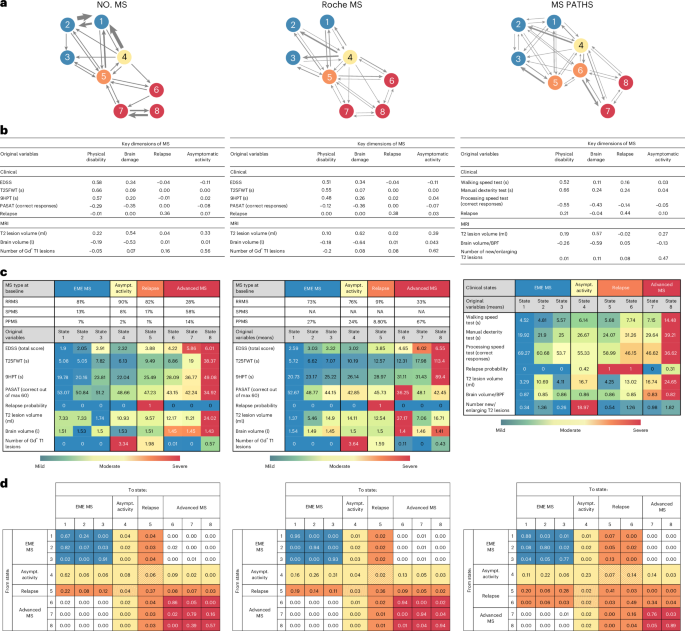
The PFA part of FAHMM65 uses baseline data to find MS dimensions (loading matrix) and corresponding composite scores (latent variables). The FAHMM model was fitted to all datasets where validation was evaluated by examining whether the same disease dimensions would emerge in the external datasets. Specifically, we determined whether the same or similar sets of variables from the primary analysis were assigned to the corresponding latent variables in the validation datasets. The validation of the latent dimensions of MS would be considered successful (validation criterion 1) if we could re-identify four dimensions related to (1) physical disability, (2) brain damage, (3) relapse and (4) asymptomatic MS disease activity.
Validation step 2: replication of disease evolution modeling
In the main analysis, the MS evolution modeling using FAHMM discovered eight states that were grouped in four meta-states based solely on the patterns of the transition probability matrix using NO.MS data: EME MS, asymptomatic radiological MS disease activity, relapse and advanced MS. To replicate the main findings from the NO.MS dataset, we fit the FAHMM to either the Roche MS or the MS PATHS data with eight states as in the main model. A successful validation would entail finding meta-states with similar clinical interpretation and similar transition probability to NO.MS (validation criterion 2): the validation would be considered successful if we could re-identify an EME MS versus an advanced state of MS with a disease severity gradient and if the transition from the first to the second would primarily be through focal inflammatory disease states—that is, through a relapse or an asymptomatic radiological disease state—with little to no probability for patients to worsen from EME MS to advanced states without passing through these focal inflammatory states.
As described above, the validation focused on the qualitative similarity of the clinical interpretability rather than on numerical thresholds. By applying these predefined validation criteria to unseen data, we aimed to show the generalizability and robustness of our findings across independent datasets, including real-world data.
Variables in external datasets
In the Roche MS dataset, the same clinical and radiological variables as in the NO.MS dataset were available. As in the NO.MS dataset, the clinical measurements were collected by trained neurologists, and MRI assessments (lesions and brain volume change) were measured by a central reading center. All assessments were used as reported in the original trials.
For the real-world dataset from MS PATHS, data assertation was different than in NO.MS and in Roche MS. Specifically, no EDSS assessments were available (patient determined disease steps (PDDS) measurements were collected rather than EDSS, but this was not used in the modeling). For most other variables in NO.MS, corresponding similar measures in MS PATHS could be identified: an iPad version of the 9HPT test was used (labeled as ‘manual dexterity test’); the walking test (noted as ‘walking speed test’) was found to be similar to the T25FWT; and an iPad version of a cognitive text (noted as ‘processing speed test’) similar to the Symbol Digit Modality Test (SDMT) was used. In MS PATHS, brain parenchymal fraction70 was calculated instead of normalized brain volume, and the number of new/enlarging T2 lesions was used instead of the number of Gd-enhancing T1 lesions. Other differences between MS PATHS and the clinical trial datasets were a lower frequency of visits (typically every 6–12 months) and the fact that visit occurrence was not independent of the occurrence of clinical symptoms (scanning frequency seemed to depend on the occurrence of relapses). Therefore, whereas, in the NO.MS and the Roche MS datasets, the transition probabilities refer to the probability of changing from one disease state to another one within a period of 1 month, in MS PATHS they refer to the probability of changing from one disease states to another within 6 months.
Data preparatory steps
In each of the respective independent external validation datasets, visits were mapped to a regular grid to capture the timing of regularly scheduled visits as well as of unscheduled visits (for example, due to new or worsening neurological symptoms). For the Roche MS dataset, this was a monthly grid, similar to that of NO.MS, whereas, for MS PATHS, due to the lower visit frequency, this was a six-monthly visit grid (subsequently, probabilities in the transition matrix refer to monthly versus six-monthly transitions, respectively). To account for incomplete records and missing post-baseline data, the observed variable’s trajectory over time was used to impute missing values using generalized additive models. Such data imputation was done only at scheduled or unscheduled patient visits where partial patient data were available (Supplementary Information Section 5). The percentage of imputed values overall and for each variable is reported together with the mean absolute error for the imputation. In the clinical trial dataset, baseline was defined as the last assessment prior to randomization, whereas, in MS PATHS, baseline was defined as the first timepoint that patients had all the necessary measurements required for modeling; furthermore, the availability of serial post-baseline assessments was required for inclusion into the analysis set, which led to the total sample size of 2,080 patients from MS PATHS.
Reporting summary
Further information on research design is available in the Nature Portfolio Reporting Summary linked to this article.