
Cancer is a genetic disease stemming from a combination of inherited and acquired mutations. Much of our understanding of the influence of germline genetic factors on carcinogenesis comes from studies of tumor genomes. Tumors from germline mutation carriers may show characteristic genomic patterns described as mutational signatures, which reflect unique processes of mutagenesis1,2,3,4,5. Beyond mutagenesis, germline genetic variation shapes tissue-specific mutational fitness, with clones bearing a selective advantage attaining dominance at the expense of others6,7. It is increasingly clear that these processes of mutation acquisition and selection are not limited to tumors but pervasive across normal tissues. Deep sequencing of normal tissues has shown that expansion of clones bearing acquired mutations in well-established cancer drivers is pervasive with age8,9,10,11,12,13,14,15. Interestingly, these mutant clones progress to cancer in only a small minority of individuals. Improved characterization of the factors promoting cancer transformation is critical to inform prevention strategies and develop new therapeutic approaches.
Our understanding of the natural history and impact of somatic mutations on health is understood best within the hematopoietic system, because it is the only tissue in which sampling (in this case of the peripheral blood) reflects the pooled collective output of all stem cells. Mutant hematopoietic stem and progenitor cells (HSPCs) show varying fitness advantages, largely dictated by gene-specific effects16,17. This, in turn, translates into risk of progression to hematologic malignancy, with clones showing the highest fitness generally conferring the highest risk of transformation17. However, variation exists among mutation-specific effects between individuals. which may be explained by both inherited and environmental factors. There has recently emerged a preliminary understanding of how germline factors influence clonal hematopoiesis (CH). Among individuals with rare Mendelian cancer predisposition syndromes, carriers often show distinct CH mutational profiles reflecting strong selective pressures18,19,20,21. However, the extent to which germline genetic variation might influence CH fitness and progression to hematologic malignancy in the general population has not been systematically studied.
Here among 731,835 individuals across 6 diverse cohorts, we sought to characterize the relationship between germline genetic variation on CH mutational landscape and how germline–somatic interactions influence the risk of CH progression to hematologic malignancy.
UKBB germline and CH mutational landscape
In 428,530 UK Biobank (UKBB) participants with whole-exome sequencing (WES) data (Supplementary Tables 1–4), we queried 236 cancer predisposition genes (Supplementary Table 5) for inherited mutations, henceforth called pathogenic or likely pathogenic germline variants (PGVs), using the American College of Medical Genetics and Genomics (ACMG) criteria22. We refer to individuals with PGVs as germline carriers throughout. We classified genes according to their inheritance mode and evidence of previous association with hematologic malignancy. Overall, 8% of UKBB participants harbored a PGV in a gene with a dominant inheritance mode (germline dominant) and 10% in a gene with a recessive inheritance mode (germline recessive). The vast majority of germline carriers were heterozygous (99.9%), with only 87 individuals found to be homozygous or to carry two different PGVs in the same gene (potential compound heterozygous carriers). Similar to previous studies in western European populations23, CHEK2 (0.9%) was the most commonly mutated gene with a dominant inheritance mode, followed by ATM (0.5%) and BRCA2 (0.4%) (Fig. 1a and Supplementary Tables 5 and 6). The vast majority harbored one PGV with only 1,327 (0.3%) participants having PGVs in multiple genes with a dominant inheritance mode. As expected, PGV carriers were more likely to have a history of cancer and to be diagnosed with cancer at a younger age (Supplementary Table 1).
Fig. 1: Germline and CH mutational landscape of the UKBB.
a, Distribution of pathogenic germline variants by mutation type for the top-10 most-mutated dominant and recessive germline genes. Genes were classified as to whether they have been linked to any cancer in the heterozygous state (dominant) or whether they have been linked to cancer only when biallelic (recessive). b, Prevalence of CH-heme and mCA-auto by age among people stratified by germline carrier status. CH-heme stands for CH in genes with known relevance to hematologic malignancy and mCA-auto for autosomal mosaic chromosomal alterations. Data are presented as the CH prevalence fitted using polynomial regression of degree 2 (center line) ± 95% CI for the fitted line (error bands). ORs with 95% CIs were calculated using a multivariable logistic regression model comparing the odds of having CH between people with dominant (n = 33,106) or recessive (n = 43,981) germline variants in reference and those without a germline variant (n = 354,774) after adjustment for age at blood draw, the first three genetic PCs and exome sequencing batch. c, Prevalence of CH-heme in specific genes and mCA-auto types by germline carrier status.mCAs are labeled by chromosome arm and alteration type: gain (+), loss (–), or copy-neutral loss of heterozygosity (=). Multivariable logistic regression adjusted for the above covariates was performed to test for differences in the prevalence of specific CH mutations between people with (n = 73,756) and those without (n = 354,774) germline variants. *P < 0.05, **P < 0.01, ***P < 0.001. The two-sided P value is not corrected for multiple testing (see Supplementary Table 10 for exact P values).
To identify CH, we re-analyzed blood WES data using the consensus of two somatic variant callers (Mutect2 and VarDict). A series of post-variant calling filtering steps were used to remove germline variants and artifacts and detect CH in cancer driver genes, with a minimum variant allele fraction (VAF) of 2% (Methods and Supplementary Tables 7 and 8). Within The Cancer Genome Atlas (TCGA), we used matched blood and tumor genomic sequencing to test the accuracy of our approach in discriminating CH from rare germline genetic variants. Applying the same strategy to detect CH in TCGA, we confirmed that >99% of our CH calls were correctly assigned. Overall, 6.2% of individuals had CH in a hematologic malignancy driver gene (CH-heme) and 0.7% in a solid tumor driver gene (CH-solid). As expected, the frequency of CH increased with age (Fig. 1b, Extended Data Fig. 1a and Supplementary Fig. 1). CH-heme but not CH-solid was more prevalent among germline carriers. Germline-dominant carriers had a stronger association with CH-heme compared with germline-recessive carriers (Fig. 1b, Extended Data Fig. 1b and Supplementary Table 9). The maximum VAF (P < 0.001) and number of CH-heme mutations (P = 0.002) were also slightly higher among germline-dominant carriers (Extended Data Fig. 1c).
We interrogated the SNP array data using a well-established copy number mutation caller, MoChA24, for the presence of mosaic copy number events (mCAs). The prevalence of mCAs in autosomal chromosomes (mCA-auto), loss of X chromosome (LOX) and loss of Y chromosome (LOY) were 3.1%, 3.2% and 8.6%, respectively (Extended Data Fig. 1b). Germline carriers had a higher risk of mCA-auto and LOY but not LOX, driven by genes with a dominant inheritance mode (Fig. 1b, Extended Data Fig. 1b and Supplementary Table 9). Copy neutral loss of heterozygosity (CNLOH) was the most common event observed with the association between germline carriers and mCA-auto driven by CNLOH (Extended Data Fig. 1b). Among the top-10 most commonly mutated CH-heme genes, six were slightly enriched among germline carriers, with only DNMT3A and ASXL1 being statistically significant (Fig. 1c and Supplementary Table 10). Similarly, an increased frequency of mCA-auto was observed across multiple genomic regions but was only statistically significant for 1p CNLOH, 11q CNLOH and loss of 13q and 15q CNLOH (Fig. 1c and Supplementary Table 10). In summary, we observed a high frequency of individuals harboring a PGV in a cancer susceptibility gene in the UKBB and that germline carriers had a higher frequency of CH, specifically CH driven by hematologic driver genes and CNLOH events in autosomal chromosomes, suggesting germline selection for specific somatic events.
Germline predisposition to CH
Given the association between PGVs in cancer predisposition genes and CH, we next sought to identify specific genes that conferred a higher risk of CH. We focused subsequent analyses on CH-heme and mCA-auto events because these were most strongly associated with germline carrier status. Using multivariable logistic regression adjusted for age at blood draw, the first three genetic principal components (PCs) and exome sequencing batch, we identified 14 genes associated with CH (false discovery rate (FDR)-corrected P value: q < 0.05; Fig. 2a and Supplementary Table 11). These included genes implicated in DNA damage repair (DDR) or sensing (CHEK2, ATM, TP53 and NBN), telomere maintenance (POT1, TINF2 and CTC1), RAS signaling (PTPN11 and SOS1) and the JAK–STAT pathway (MPL). Also included were ETV6 and RUNX1, genes encoding transcription factors, SAMD9L, encoding a tumor suppressor, and ABCB11, which encodes a bile salt exporter pump in the liver. Most are known or hypothesized hematologic cancer predisposition genes. ABCB11 has not been previously linked to hematologic cancer. Although biallelic NBN mutations have been associated with hematologic cancer25, heterozygous NBN carriers have not been linked to subtypes of hematologic malignancy, although there is an association with overall cancer predisposition26. We tested for an association between these genes and CH in five validation cohorts: All of Us, Mass General Brigham Biobank (MGBB), TCGA, Memorial Sloan Kettering–Integrated Mutation Profiling of Actionable Cancer Targets (MSK-IMPACT) and Center for Common Disease Genomics (CCDG), which included a total of 24,803 CH carriers among 303,305 individuals. In total, eight were significantly associated with CH in the replication cohorts (RUNX1 (P = 1.5 × 10⁻² for CH-heme), MPL (P = 1.2 × 10⁻²⁴ for mCA-auto), TP53 (P = 2.0 × 10⁻⁶ for CH-heme), ATM (P = 2.0 × 10⁻² for CH-heme; P = 8.9 × 10⁻¹² for mCA-auto), NBN (P = 4.7 × 10⁻² for mCA-auto), CHEK2 (P = 2.9 × 10⁻⁷ for CH-heme), ETV6 (P = 1.1 × 10⁻³ for CH-heme) and PTPN11 (P = 4.7 × 10⁻² for CH-heme)) (Fig. 2a, Supplementary Table 11 and Supplementary Fig. 2). All were directionally consistent besides SOS1 where only a small number of germline carriers were observed (n = 15) and none had CH. Out of the eight genes that were significantly associated with CH in the replication cohort, two have not been previously associated with CH (NBN and PTPN11). Among CH-positive individuals, some but not all CH susceptibility germline carriers showed slightly higher CH VAF and mutational burden compared with individuals without germline pathogenic variants (Extended Data Fig. 2a).
Fig. 2: Germline predisposition to CH.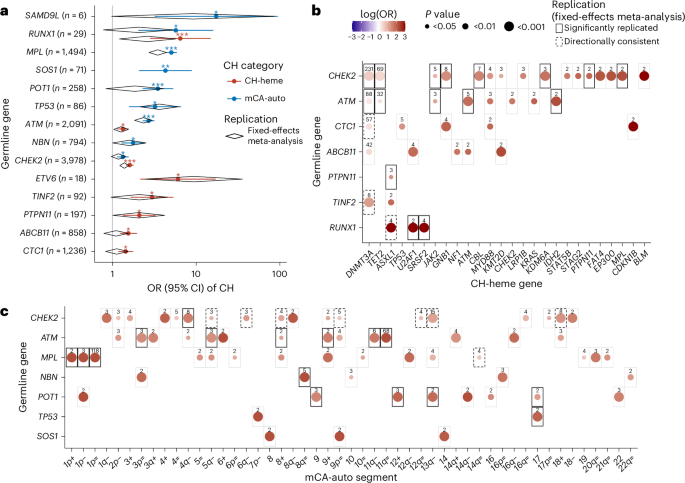
a, Within the UKBB, we identified 14 cancer predisposition genes that were associated with CH-heme (red) or mCA-auto (blue). Data are presented as OR (dot) ± 95% CI (whiskers). Black diamonds indicate ORs and 95% CIs from a fixed-effects meta-analysis in our replication cohorts, which include the All of Us (n = 192,003), MGBB (n = 49,941), the Washington University CCDG (n = 37,184), TCGA (n = 7,161) and MSK-IMPACT (n = 17,016) cohorts. b, Heatmap showing the log(OR) within the UKBB between CH-heme in specific genes and germline genes that were statistically significantly (FDR-corrected P < 0.05) associated with higher risk of overall CH-heme. c, Heatmap showing the log(OR) between specific mCA-auto types and germline genes that significantly increased overall mCA-auto. The color scale is the same for b and c. Pair-wise associations that were statistically significant (P < 0.05, two sided with no correction for multiple testing) are shown in the black box in our replication cohort (solid line) and those that were directionally consistent (dashed line). For all analyses, the OR for CH was calculated using multivariable, Firth’s bias-reduced, logistic regression comparing germline carriers with individuals without germline variants, adjusted for age at blood draw, the first three genetic PCs and exome sequencing batch. *q (FDR-corrected P) < 0.05, **q < 0.01, ***q < 0.001.
Tumors from germline mutation carriers can show unique mutational signatures. To this end, we investigated whether the trinucleotide context of CH mutations differed between germline carriers and noncarriers. Even among mismatch repair germline carriers with tumors that are known to show distinct signature patterns27, the SBS1 ‘clock-like’ mutational signature predominated for CH mutations (Extended Data Fig. 2b and Supplementary Fig. 3). The SBS1 signature is characterized by a predominance of C>T substitutions, in particular when cytosine is followed by guanine (CpG). Among both noncarriers and germline carriers, the proportion of CpG substitutions was not significantly different even after adjusting for age (P = 0.50). This suggests that, similar to CH in individuals without PGVs, CH in middle-aged germline variant carriers is driven largely by age-related mutational processes.
Among the 14 germline CH-predisposition genes that we identified in the UKBB, we observed marked heterogeneity in the strength of associations with acquired mutations in specific genes (Fig. 2b). Some of these reflect known patterns of acquired mutational selection in PGV carriers (for example, PGVs in RUNX1 and acquired SRSF2) or patterns of co-mutational selection in hematologic cancers (for example, TP53 with 7p- in AML). However, most have not been reported (Supplementary Table 12). Among 24 CH-germline gene-specific associations where we observed ≥1 co-occurring events in our validation cohorts, 18 were significant (P < 0.05) and an additional 4 were directionally consistent. We tested the association between CH functional classes and the eight CH-predisposition genes that were replicated in our validation cohorts. We observed that CHEK2 germline variation was positively associated with CH in genes involved in DNA methylation (odds ratio (OR) = 1.71, 95% confidence interval (CI) = 1.51–1.92, P < 0.001) but negatively associated with DDR genes (OR = 0.32, 95% CI = 0.13–0.81, P = 0.016). We also observed heterogeneity in the strength of the associations between germline variants and specific acquired chromosomal alterations (Fig. 2c). Among the strongest associations that we observed, many were between germline variation in cancer-predisposing genes and acquired CNLOH or deletion in overlapping regions (for example, ATM and 11q CNLOH, MPL and 1p CNLOH, and NBN and 8q CNLOH). Among 24 mCA-germline gene-specific associations with ≥1 co-occurring events, 16 were significant (P < 0.05) and the other 8 were directionally consistent in our validation cohort (Supplementary Table 12).
We hypothesized that heterogeneity between the strength of the association across germline variants and CH in specific genes and/or genetic regions likely reflected differences in CH fitness. In the absence of longitudinal data, we used a recently published method16 to quantify the fitness of specific CH mutations based on their VAF distribution. We focused on the association between germline CHEK2 and DNMT3A CH, on the association with the most co-occurring events. Comparison of the VAF distribution of CH in DNMT3A (overall and R882) between CHEK2 PGV carriers and noncarriers suggested a substantial increase in mutation rate and a modest increase in fitness of DNMT3A CH among CHEK2 germline carriers (Supplementary Fig. 4). However, within this framework there are multiple scenarios where an increased fitness effect can mimic an increase in mutation rate, including a relative increase in fitness for smaller VAF clones, which decreases for higher VAF events as clone-specific factors predominate.
Based on our findings of heterogeneity between germline–CH associations by CH gene and genetic regions, we explored whether we might identify additional genes that predisposed to CH in specific genes or genetic regions, but not CH globally. We detected an additional 262 associations with q < 0.05, involving 84 genes (Supplementary Table 13). Out of 55 associations with ≥1 co-occurring events, 30 were significantly associated (P < 0.05) and an additional 24 were directionally consistent in our validation cohorts. The 30 germline–CH associations that we replicated in the validation cohort consisted of 23 genes (ATR, BUB1B, CBL, DOCK8, ERCC1, ERCC2, ERCC3, ERCC4, ERCC6L2, FANCI, FH, KIT, LIG4, LZTR1, MRE11, MUTYH, NTHL1, PRDM9, RAD51D, RTEL1, SH2B3, SPRED1 and TGFBR1). Most genes (n = 20) have not been previously linked to CH except for FH, MRE11 and SH2B3. Out of 23, over half (14 genes) have been previously associated with hematologic cancer predisposition. However, for most (n = 10) disease manifestation has been noted only when present in the biallelic state. In contrast, the associations with CH that we observed here were with heterozygous germline carriers. This included DOCK8, a regulator of lymphocyte differentiation, members of Fanconi’s anemia pathway (FANCI), the base-excision repair pathway (ERCC1, ERCC2, ERCC3 and ERCC5), spindle checkpoint regulation (BUB1B), double-strand break repair (MRE11 and LIG4) and centromere maintenance (ERRCC6L6).
There is little knowledge about the mutational profile of hematologic cancers among biallelic mutations in these genes. However, individuals with biallelic mutations in ERCC6L6 (ref. 28) and telomere biology disorders29 are known to be prone to acute myeloid leukemia (AML) driven by mutations in the DDR pathway, including TP53 and PPM1D. Similarly, we observed a higher frequency of CH in PPM1D (OR = 3.41, 95% CI = 1.57–7.40, P = 0.002) among heterozygote carriers of ERCC6L6. Within the context of telomere disorders, CH in the DDR pathway, particularly PPM1D, is common and thought to be compensatory, resulting in suppression of apoptosis triggered by telomere dysregulation30. Although heterozygote carriers of these autosomal-recessive hematologic cancer predisposition genes may not show strong increased risks for cancer, similar cellular stressors may be shared between heterozygote and biallelic carriers, reflected by shared patterns of CH. Taken together, our findings suggest that germline predisposition to CH is largely characterized by gene-specific associations likely reflecting somatic–germline interactions influencing HSPC fitness.
Germline predisposition to hematologic malignancies
As CH is a precursor of hematologic malignancy, we hypothesized that CH-predisposition genes would also increase the risk of hematologic malignancy. During up to 15 years of follow-up, 5,248 UKBB participants developed hematologic malignancy, including 1,303 cases of myeloid malignancies and 3,963 with lymphoid malignancies. We tested for an association between germline carriers and risk of hematologic malignancy for the 98 CH-predisposition genes that we identified in the UKBB, including 14 genes associated with CH overall and 94 genes associated only with CH in specific genes or genetic regions. Overall, we found 16 germline genes associated with an increased risk of hematologic malignancy, most of which (n = 8) were associated with CH overall (Fig. 3 and Supplementary Table 14). Among these 16 genes, most are known hematologic malignancy predisposition genes including CBL31 and POT1 (refs. 32,33) with lymphoid malignancies, and ETV6 (ref. 34), RUNX1 (ref. 20), TP53 (ref. 35), DDX41 (ref. 36), SOS1 (ref. 37), CBL38, PTPN11 (ref. 39) and RTEL1 (ref. 40) with myeloid malignancies. Overall, among UKBB participants, 5% (n = 20,943) were germline carriers for a hematologic cancer predisposition gene with a dominant inheritance mode. It is interesting that we identified several genes in which heterozygous germline variants have not previously linked to hematologic malignancy. This included XRCC2 (hazard ratio (HR) = 4.2, 95% CI = 1.4–13.2, P = 0.012) and SLX4 (HR = 2.8, 95% CI = 1.2–6.7, P = 0.022) associated with increased risk of myeloid malignancies and MLH1 (HR = 2.1, 95% CI = 1.05–4.2, P = 0.037) and NTHL1 (HR = 1.5, 95% CI = 1.1–2.2, P = 0.023) associated with increased risk of lymphoid malignancies. These four genes have been linked to cancer, including hematologic malignancy when present as homozygous or compound heterozygous state previously41,42,43,44, but not in heterozygous PGV carriers. We also identified increased risk of myeloid malignancies among people with heterozygous PGVs in POLE (HR = 2.5, 95% CI = 1.2–5.3, P = 0.02) where biallelic mutations result in immunodeficiency45.
Fig. 3: Association between CH-predisposition genes and hematologic malignancy in the UKBB.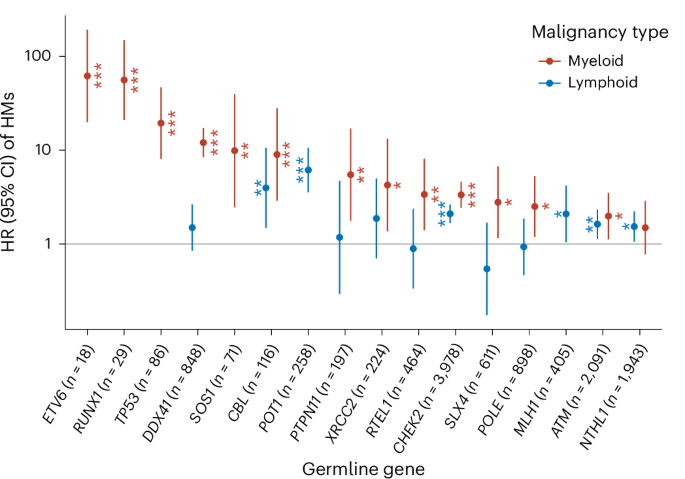
Germline CH-predisposition genes are shown that were also associated with the risk of hematologic malignancy (HM). Data are presented as HR ± 95% CI for myeloid (n = 1,303) or lymphoid (n = 3,963) malignancies that were calculated using Cox’s regression adjusted for age at blood draw, the first three genetic PCs and exome sequencing batch. *P < 0.05, **P < 0.01, ***P < 0.001. The two-sided P value has no correction for multiple testing. See Supplementary Table 14 for exact P values.
We further refined the spectrum of hematologic malignancy associated with CHEK2 and ATM. Although PGVs in ATM have been previously linked to lymphoid malignancies46, we also observed an association with the development of myeloid malignancies (HR = 2.0, 95% CI = 1.1–3.5, P = 0.018). Several small (<400 individuals) studies have linked CHEK2 PGVs to myeloid malignancies47,48. We show robust evidence in a large population of 3,978 PGV carriers that CHEK2 is linked to risk of both lymphoid (HR = 2.1, 95% CI = 1.7–2.6, P = 1.9 × 10⁻¹⁰) and myeloid neoplasm (HR = 3.3, 95% CI = 2.4–4.6, P = 1.1 × 10⁻¹³). Both ATM and CHEK2 were associated with a wide range of hematologic cancer subtypes, including both primary and secondary (occurring after a solid tumor diagnosis) hematologic cancers (Extended Data Fig. 3). Mutation-specific effects for cancer predisposition genes on solid tumor risk have been observed but are not well characterized for hematologic cancers. For example, loss of function (LOF) mutations in CHEK2 may confer higher risks of cancer compared with missense mutations47. We compared the strength of the association between CH and germline LOF versus missense variants in CHEK2 and ATM (Extended Data Fig. 4a and Supplementary Table 15). LOF germline variants in CHEK2 were associated with higher risk of CH (driven largely by the del1100C European founder mutation) compared with missense mutations. In contrast, the frequency of CH was similar for missense and LOF germline ATM variants. The risk of hematologic cancer appeared similar for misense and LOF variants in both ATM and CHEK2, but would require larger numbers of hematologic cancers for a more refined estimation of potential heterogeneity (Extended Data Fig. 4b and Supplementary Table 16).
Germline–CH interactions influence hematologic malignancy risk
Given that germline variation predisposes to both CH and hematologic malignancy, we sought to characterize the interaction between PGVs and CH on hematologic malignancy risk. First, among germline carriers, we compared the risk of hematologic malignancy between individuals with and those without CH. We observed a multiplicative interaction between germline predisposition and CH on hematologic malignancy risk (P = 0.014). CH carriers with pathogenic germline variants have a higher risk of developing hematologic malignancy (HR = 1.3, 95% CI = 1.1–1.5, P = 2.4 × 10⁻⁵) compared with CH carriers without PGVs. We next investigated this across individual hematologic malignancy predisposition genes. In the presence of CH, germline carriers generally showed marked increased risks of hematologic malignancy, with significantly lower risks in the absence of CH (Fig. 4a and Supplementary Table 17). This pattern was observed for both myeloid and lymphoid malignancies. An exception to this pattern was DDX41, which showed similar risks in the presence and absence of CH. Progression to myeloid neoplasms among DDX41 PGV carriers is characterized by the acquisition of subclonal, second somatic mutations in DDX41. Perhaps as a result of the low depth of the sequencing data, we did not observe secondary somatic DDX41 events among DDX41 PGV carriers. Taken together, these data suggest that CH is a strong risk stratification tool for hematologic malignancy risk among germline carriers.
Fig. 4: Germline–CH interactions stratify the risk of hematologic malignancy.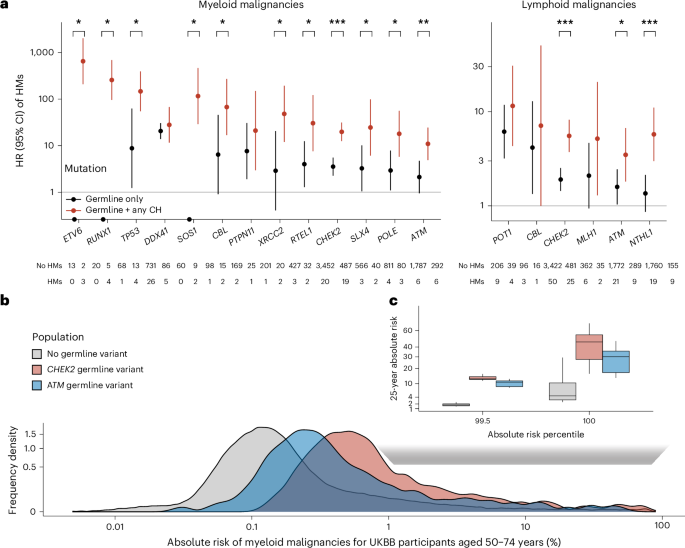
a, HRs (center dot) and 95% CIs for myeloid or lymphoid malignancy among people with pathogenic variants in germline genes that predispose to both CH and hematologic malignancy (HM) stratified by the presence of any CH (including any CH-heme and mCA-auto). Differences between the risk of hematologic cancer across CH-positive and CH-negative germline carriers were calculated using Firth’s bias-reduced logistic regression limited to germline variant carriers. *P < 0.1, **P < 0.01, ***P < 0.001. The two-sided P value has no correction for multiple testing (see Supplementary Table 17 for exact P values). b, Predicted distribution of 25-year absolute risk of myeloid malignancies among UKBB individuals aged 50–74 years with CHEK2 (n = 3,012), ATM (n = 1,592) or no pathogenic germline variants (n = 269,050). Analyses in both a and b were performed using Cox’s regression adjusted for age at blood draw, first three genetic PCs and exome sequencing batch. c, Comparison of distribution of 25-year absolute risk of myeloid malignancy among people at the top percentiles of risk across people with CHEK2 (n = 30), ATM (n = 14) or no germline variant (n = 2,690). The center line represents the median, the box limits the upper and lower quartiles and the whiskers 1.5× the interquartile range (IQR).
To evaluate the extent to which CH and germline profiles, together with clinical phenotypes, can identify individuals at a clinically meaningful risk of myeloid malignancy, we estimated the 25-year absolute risk of myeloid malignancy among individuals in the UKBB. First, we compared the number of individuals needed to screen to identify at least one individual at a moderate (≥5%) absolute risk of myeloid malignancy using CH alone or CH plus germline mutation status. Using CH plus clinical factors, we estimated that it would require 432 individuals whereas incorporation of germline mutation profile would reduce this slightly by ~10% to 392 individuals. Next, we estimated the absolute risk among those with different germline backgrounds. A substantially higher fraction of germline CHEK2 carriers (2%) and ATM carriers (1%) showed a 25-year absolute risk >5% compared with noncarriers (0.2%; Fig. 4b). To identify at least one individual at 5% absolute risk of myeloid malignancy, it would require CH screening of 454 noncarriers but only 48 CHEK2 carriers and 76 ATM carriers. For people at the highest risk (top 0.5%), the median 25-year absolute risk of myeloid neoplasm was 46% for CHEK2 and 30% for ATM carriers compared with only 4% among noncarriers (Fig. 4c). Thus, screening for CH among germline carriers can more efficiently identify individuals at higher absolute risk for myeloid malignancy compared with a population-level screening agnostic of inherited predisposition.
If heterogeneity in the strength of associations between germline predisposition genes and specific CH mutations reflects differential fitness effects, we reasoned that this should influence the gene-specific risk of CH progression to hematologic malignancy. To test this hypothesis, we classified CH among germline carriers into two categories: CH genes that showed a moderate or strong association with PGVs in a specific gene (referred to as germline-selected CH) and CH in genes showing weak or no association with the germline gene (referred to as nonselected CH) (Fig. 5a). Among germline carriers with CH, those with germline-selected CH showed a markedly higher risk of both myeloid and lymphoid malignancy compared with those with nonselected CH (Fig. 5b and Supplementary Table 18). Overall, the risks of progression were 2.7-fold and 13.1-fold higher, respectively, for germline-selected CH compared with germline-nonselected CH. We further investigated whether this pattern was consistent across germline carriers or limited to specific germline genes. Among germline carriers with at least two hematologic cancer cases in both germline-selected and nonselected CH, we observed consistent effects across genes (Fig. 5c,d and Supplementary Table 18). Finally, we sought to understand whether the risk of progression for specific CH genes varied by germline genetic backdrop. We tested for differences in the risk of CH progression to myeloid malignancy for DNMT3A, the most commonly mutated CH gene, among CHEK2 germline carriers, the most commonly mutated germline gene. In accordance with our finding of a higher fitness advantage of DNMT3A CH among CHEK2 germline carriers, the risk of DNMT3A progression to myeloid malignancies was higher among CHEK2 germline carriers compared with noncarriers (HR = 2.8, 95% CI = 1.01–7.5, P = 0.047; Fig. 5e).
Fig. 5: Risk of CH progression to hematologic cancer varies by germline background.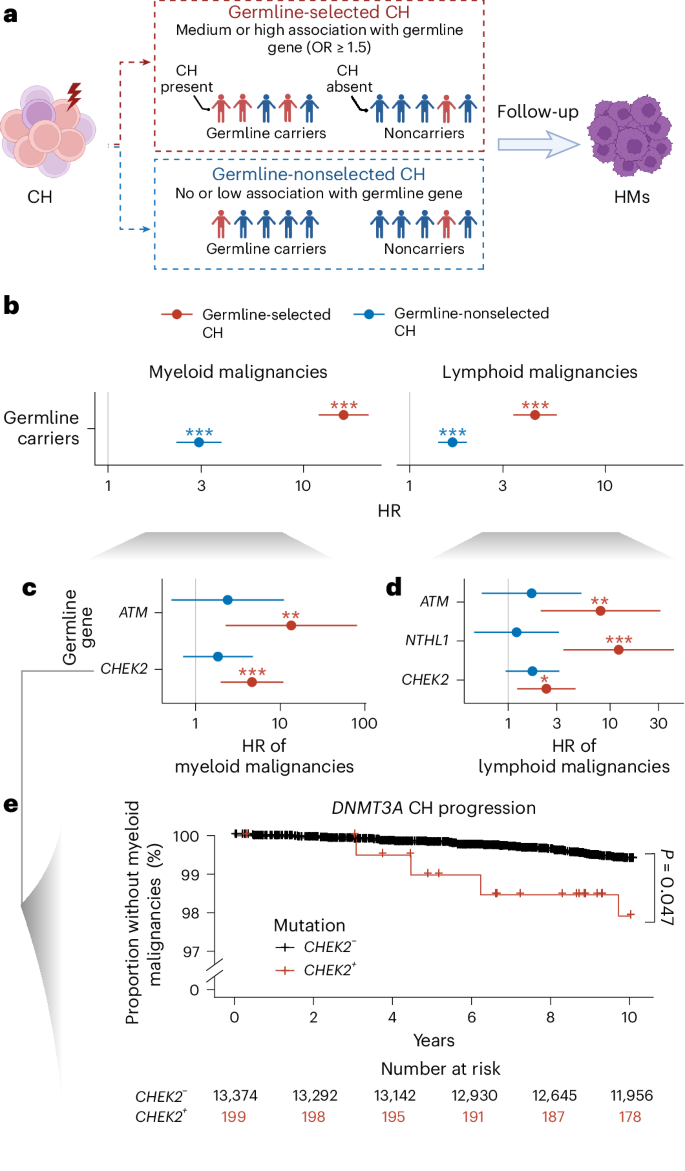
a, Graphic illustration describing our analysis studying the impact of germline-selected CH on risk of hematologic cancer. We defined germline-selected CH in a given germline carrier as the presence of a CH mutation showing evidence of enrichment in that specific germline gene. b–d, Risks for myeloid or lymphoid malignancy among individuals with germline-selected CH (red) compared with those with germline-nonselected CH (blue) calculated using Cox’s regression adjusted for age at blood draw, the first three genetic PCs and exome sequencing batch. Data are presented as HRs ± 95% CIs. b, HRs among all germline carriers. c,d, HRs for myeloid (c) and lymphoid (d) malignancies among specific germline gene carriers. The number of samples is as follows: germline carriers (n = 73,781), CHEK2 (n = 3,337), ATM (n = 1,736) and NTHL1 (n = 1,608). *P < 0.05, **P < 0.01, ***P < 0.001 (see Supplementary Table 18 for exact P values). e, Kaplan–Meier plot for 10-year, myeloid malignancy-free survival probability among people with DNMT3A CH mutation stratified by CHEK2 germline carrier status. The P value was derived from Cox’s regression limited to DNMT3A CH carriers, testing for a difference in the HR for developing myeloid malignancies between CHEK2 germline carriers and noncarriers. All P values are two-sided with no correction for multiple testing. Icons in a created with BioRender.com.