BRG1 binding exhibits a linear response to its dosage
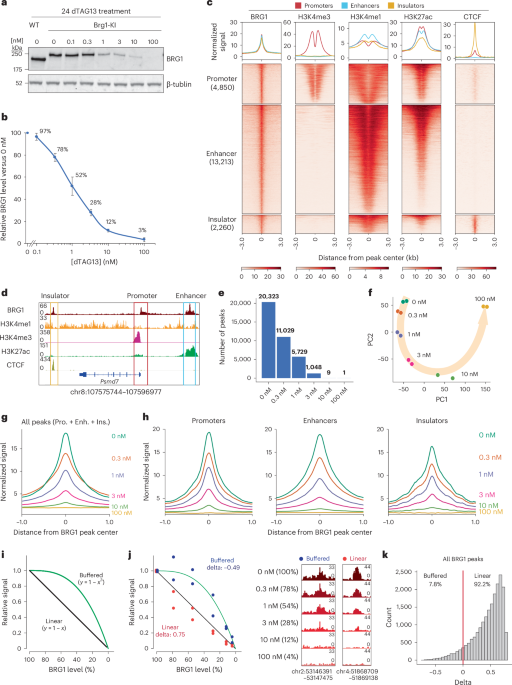
In mES cells, Brg1 encodes the major catalytic subunit of mSWI/SNF, as Brm is only weakly expressed12,41 (Extended Data Fig. 1a). To manipulate BRG1 levels, we used the dTAG system39,40,42 to perform targeted degradation of the BRG1 protein by introducing an FKBP12–F36V degron into the Brg1 locus, resulting in FKBP12–F36V Brg1-knock-in cells. In the presence of heterobifunctional molecule dTAG13, the degron directs the fusion protein to the proteasome for degradation39 (Extended Data Fig. 1b,c), a process that is completed within 60 min (Extended Data Fig. 1d). Addition of the degron tag did not affect the ability of BRG1 to form complexes with other mSWI/SNF components, including ARID1A (cBAF), PBRM1 (PBAF) and BRD9 (ncBAF), as evidenced by our finding that the immunoprecipitation efficiency of Brg1-knock-in cells was comparable to that of the untagged wild-type cells (Extended Data Fig. 1e). As a previous study found that mSWI/SNF inhibition for 24 h mirrored the effects of genetic manipulation12, we treated cells with dTAG13 for 24 h to modulate BRG1 levels in a dose-dependent manner (Fig. 1a,b). Immunostaining confirmed a population-wide decrease in BRG1 levels (Extended Data Fig. 1f). These results demonstrated that we had successfully established a system that allowed precise control of BRG1 dosage for study of its dosage-sensitive function.
Fig. 1: Chromatin binding of BRG1 exhibits a linear response to its dosage.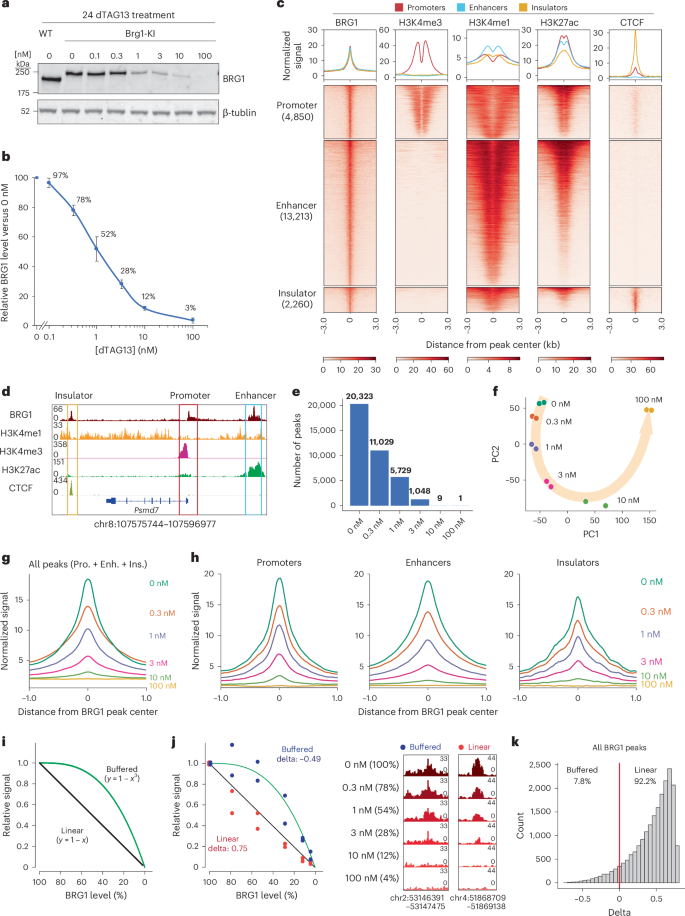
a, Western blot analysis of BRG1 in Brg1-knock-in (KI) and wild-type (WT) mES cells after treatment with the indicated concentrations of dTAG13 for 24 h. Data are representative of six independent experiments. b, Quantification of relative BRG1 abundance following dTAG13 treatment. BRG1 expression was normalized to that of tubulin and then to that of DMSO-treated (0 nM) Brg1-KI mES cells within each biological replicate. Data represent the mean ± s.e.m. from six independent experiments. c, Heatmap showing profiles of protein and histone modifications (CUT&RUN and ChIP–seq) for regions associated with different genomic elements (bottom). The top panel shows aggregate coverage plots with mean enrichment at promoters (red), enhancers (cyan) and insulators (orange). d, Representative genome browser views of BRG1 binding at a promoter, enhancer and insulator. e, Numbers of BRG1 binding peaks identified at different dTAG13 concentrations. f, PCA of BRG1 CUT&RUN data across varying dTAG13 concentrations. g, Aggregate coverage plot showing mean BRG1 enrichment at different dTAG13 concentrations. h, Aggregate coverage plot of BRG1 enrichment at promoters, enhancers and insulators across different dTAG13 concentrations. i, Diagram illustrating models of linear (black) and buffered (green) dosage-sensitive responses. j, BRG1 signals at representative linear (red) and sensitive (blue) regions (left). The relative signal was calculated by normalizing with 0 nM signals. Genome browser view showing BRG1 binding at regions with linear and buffered responses (right). The genome locations of the browser view are indicated at the bottom of the panels. The linear and buffered models are illustrated in the diagram. k, Histogram of delta values for all 20,326 BRG1-binding sites. The red line indicates delta = 0. Enh., enhancer; Ins., insulator; Pro., promoter.
To this end, we first investigated the genome-wide binding profile of BRG1 by performing a cleavage under targets and release using nuclease (CUT&RUN) assay using Brg1-knock-in cells (Extended Data Fig. 1g). BRG1 binding was enriched at promoters (23.9%, marked by histone H3 trimethylated at Lys4 (H3K4me3)), enhancers (65.0%, marked by H3 monomethylated at Lys4 and H3 acetylated at Lys27 (H3K27ac)) and insulators (11.1%, marked by CTCF) (Fig. 1c,d), consistent with its known roles at both proximal and distal regulatory elements6,16,43. The presence of BRG1 at insulators was consistent with its reported interaction with CTCF and ncBAF complex localization patterns43,44,45. These results confirm that the tagged BRG1 mirrors the endogenous binding profile and primarily targets promoters, enhancers and insulators.
The nature of the mechanisms underlying the target selectivity of remodelers remains a fundamental question. TFs and histone modifications have been reported to recruit mSWI/SNF, likely through physical interactions46,47,48,49,50. Given that TFs exhibit nonlinear binding profiles and preferentially occupy high-affinity targets at low concentrations40,51,52,53, we hypothesized that the binding profile of BRG1 would follow that of TFs, assuming that its recruitment was determined by physical interactions with TFs. In this case, high-affinity and low-affinity binding sites would exhibit differential dosage sensitivity. To test this hypothesis, we profiled BRG1 binding across five dTAG13 concentrations, corresponding to different BRG1 levels (Fig. 1a,b). Numbers of BRG1-binding sites were reduced by almost half following 0.3 nM dTAG13 treatment (78% of protein remaining), and further depletion nearly abolished detectable peaks (10 nM dTAG13, 12% of protein remaining) (Fig. 1b,e). Principal component analysis (PCA) confirmed a global shift in BRG1 binding as dTAG13 concentrations increased (Fig. 1f). Overall, BRG1-binding signals decreased in a gradual, dose-dependent manner (Fig. 1g).
Next, we investigated whether BRG1 binding at different types of regulatory element (promoters, enhancers and insulators) would exhibit distinct dosage sensitivity. Notably, all three classes showed similar gradual reductions in binding (Fig. 1h). To further analyze the kinetics of BRG1 binding, we generated two hypothetical models: a linear response model (with a proportional relationship between BRG1 dosage and binding signals); and a buffered response model (showing limited changes in binding with a subtle decrease in BRG1 levels) (Fig. 1i). We then calculated the delta values between the distances of observed signals and those of the two models. A positive delta value indicated proximity to the linear model, whereas a negative delta value indicated closeness to the buffered model (Fig. 1j and Methods). Of all BRG1-binding peaks, 92.2% followed the linear response model (Fig. 1k). As previous studies have implicated OCT4 and H3K27ac in BRG1 recruitment48,49,50, we assessed BRG1 binding at co-occupied sites. Both sites cobound by OCT4 and BRG1 and those co-occupied by H3K27ac and BRG1 also exhibited linear responses to BRG1 dosage (Extended Data Fig. 1h), suggesting that BRG1 binding at these loci does not heavily rely on recruitment by TFs or histone modifications.
Variable BRG1 dependency in accessibility among regulatory elements
Given that the major function of chromatin remodeler is to regulate chromatin accessibility, we next assessed the effects of BRG1 depletion on chromatin accessibility using transposase-accessible chromatin with sequencing (ATAC-seq) at different BRG1 levels, focusing on BRG1-binding sites. Numbers of differentially accessible regions (DARs) increased progressively with decreasing BRG1 levels (Extended Data Fig. 2a), with most DARs showing reduction in or loss of accessibility (Extended Data Fig. 2b). Notably, whereas chromatin accessibility at enhancers declined gradually in response to BRG1 depletion, it remained largely unchanged at promoters and insulators (Fig. 2a,b). Specifically, 44.2% of BRG1-bound enhancers exhibited decreased accessibility, compared to only 16.1% of promoters and 17.8% of insulators (Fig. 2c,d). Of all DARs, 83.2% were located at enhancers, whereas only 11.1% and 5.7% were found at promoters and insulators, respectively (Fig. 2e). A previous Brg1-knockout study showed a similar trend, with enhancers affected more than promoters and insulators48 (Extended Data Fig. 2c). Collectively, these results indicate that BRG1 has a more important role in maintaining the accessibility of enhancers than that of promoters and insulators.
Fig. 2: Chromatin accessibilities at different regulatory elements exhibit varying dependencies on BRG1.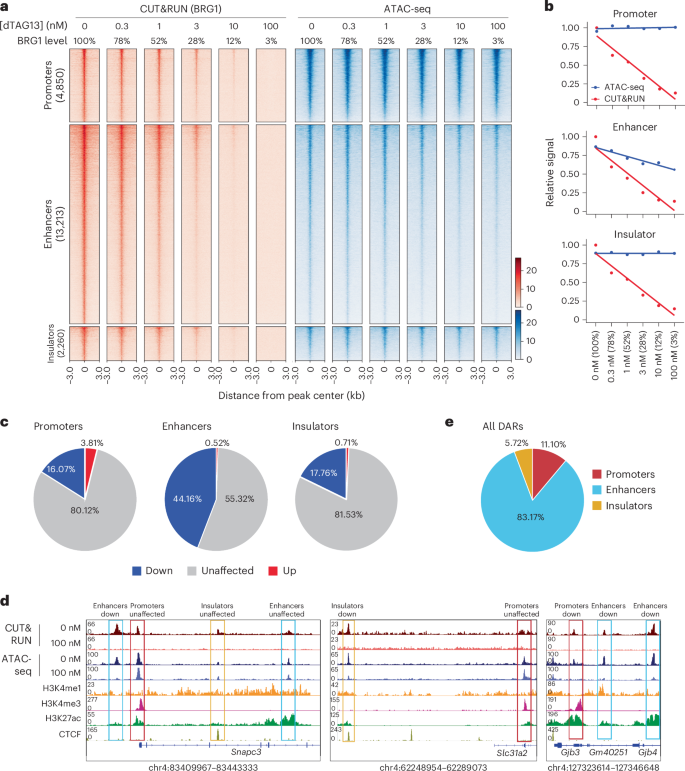
a, Heatmap showing BRG1 binding (red) and ATAC-seq (blue) for regions falling into genomic elements at the indicated dTAG13 concentration. b, Line plots depicting relative BRG1 binding (red) and ATAC-seq (blue) at promoters, enhancers and insulators. c, Pie chart depicting the percentages of significant changes in ATAC-seq signals at BRG1 target sites in promoters, enhancers and insulators. d, Genome browser view showing BRG1 binding and ATAC-seq signals across regions containing promoters, enhancers and insulators. e, Pie charts depicting the relative distributions of significant changes in ATAC-seq signals at promoters, enhancers and insulators.
Compensatory mechanisms maintain accessibility in the absence of BRG1
Next, we explored the factors that might determine BRG1 dependency. To this end, we first compared BRG1-binding signals and found that their levels alone did not distinguish BRG1-dependent and BRG1-independent regions (Extended Data Fig. 3a). We next performed motif enrichment analyses to explore whether TFs contributed to the maintenance of chromatin accessibility in the absence of BRG1. The NFY and SP1 binding motifs were significantly enriched at independent promoters, whereas CTCF and CTCFL motifs were enriched at independent insulators (Fig. 3a). By contrast, no specific motifs were uniquely enriched at independent enhancers; for instance, the OCT4 motif was identified in both dependent and independent enhancers (Fig. 3a). Reanalysis of public chromatin immunoprecipitation followed by high-throughput sequencing (ChIP–seq) datasets revealed that NFYA and CTCF preferentially bound to BRG1-independent promoters and insulators, respectively (Fig. 3b and Extended Data Fig. 3b). Conversely, OCT4 was more enriched at dependent enhancers (Extended Data Fig. 3b,c). Chromatin accessibility at OCT4-binding sites was decreased following BRG1 depletion, consistent with previous results demonstrating that BRG1 is necessary for maintenance of the accessibility of OCT4-binding sites in mES cells48 (Extended Data Fig. 3d).
Fig. 3: BRG1 and SNF2H cooperatively regulate insulator elements.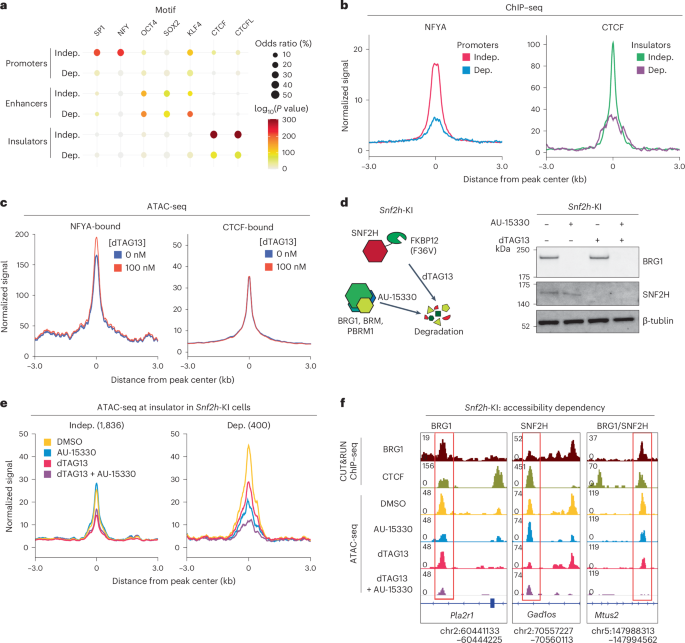
a, TF motif enrichment at BRG1-independent (Indep.) and BRG1-dependent (Dep.) ATAC-seq peaks in promoters, enhancers and insulators. The color scale represents the −log10(P value), and the dot size corresponds to the effect size measured as an odds ratio. Two-sided Fisher’s exact test was performed. b, Aggregate coverage plot showing mean NFYA and CTCF ChIP–seq signals at BRG1-dependent and BRG1-independent regulatory elements. c, Aggregate coverage plot showing mean ATAC-seq signals at NFYA and CTCF-bound regions. d, Schematic of SNF2H and BRG1 degradation system (left). SNF2H is fused with FKBP12–F36V (Snf2h-KI) to enable degradation by dTAG13. BRG1, BRM and PBRM1 are degraded by AU-15330. Western blot analysis of BRG1 and SNF2H in Snf2h-KI mES cells after treatment with 1 μM AU-15330 and/or 100 nM dTAG13 for 24 h. Data are representative of three independent experiments. e, Aggregate coverage plot of mean ATAC-seq peaks at BRG1-dependent and BRG1-independent insulators in mES cells after 24 h of AU-15330 and/or dTAG13 treatment. f, Representative genome browser view showing regions regulated by BRG1 and SNF2H and those coregulated by BRG1 and SNF2H (BRG1/SNF2H).
The distribution of the Polycomb repressive complex (PRC) is directed by mSWI/SNF14. As well as enrichment of PRC1 and PRC2 components (RING1B and SUZ12, respectively) at promoters, we found increased binding of these components at BRG1-dependent promoters following BRG1 loss (Extended Data Fig. 3e). Although Polycomb proteins themselves do not directly affect chromatin accessibility54,55, these results indicate that BRG1 depletion triggers broader chromatin reorganization at BRG1-dependent regulatory elements.
On the other hand, chromatin accessibility at NFYA-binding and CTCF-binding sites remained unchanged after BRG1 depletion (Fig. 3c), suggesting that these factors contribute to the maintenance of chromatin accessibility at BRG1-independent regions. Consistently, reanalysis of Nfya-knockdown datasets showed that chromatin accessibility was specifically decreased at NFYA-bound BRG1-independent promoters56 (Extended Data Fig. 3f). These results, together with the observation that NFYA was mainly enriched at the BRG1-independent promoters, suggest that NFYA plays a critical part in maintaining open chromatin states at BRG1-independent promoters.
CTCF can be recruited by SNF2H, the ATPase subunit of the ISWI complex7,57,58,59. As SNF2H and BRG1 have overlapping binding profiles5, we hypothesized that SNF2H might compensate for BRG1 at insulators. To test this hypothesis, we established Snf2h-dTAG mES cells, in which SNF2H could be degraded by dTAG13 and BRG1 could be degraded by AU-15330, a proteolysis-targeting chimera (PROTAC) that targets both BRG1 and BRM60 (Fig. 3d). Cells were treated for 24 h, consistent with our previous experiments. As expected, AU-15330 alone had a minor effect on BRG1-independent insulators. By contrast, SNF2H depletion alone led to reduced accessibility at both BRG1-dependent and BRG1-independent insulators, with a greater effect observed at BRG1-independent insulators (Fig. 3e,f). Simultaneous depletion of SNF2H and BRG1 further decreased accessibility at BRG1-dependent insulators but not at independent insulators (Fig. 3e,f and Extended Data Fig. 3g). BRG1-dependent insulators showed slightly higher enrichment of TFs in motif and ChIP–seq analyses, suggesting that BRG1-dependent insulators were occupied by more regulatory factors than BRG1-independent insulators (Extended Data Fig. 3b,h). Overall, these results indicate that the SNF2H–CTCF axis has a dominant role in regulation of accessibility at BRG1-independent insulators, whereas both SNF2H and BRG1 contribute to the accessibility of BRG1-dependent insulators.
Enhancer activity defines dosage sensitivity to BRG1
Next, we characterized the dosage response properties of BRG1-dependent regulatory elements with respect to chromatin accessibility. To investigate the kinetics of chromatin accessibility following BRG1 depletion, we applied the linear and buffered response models described above (Fig. 1i and Methods). Overall, BRG1-dependent regulatory elements displayed an approximately equal distribution between linear and buffered responses (50.7% linear versus 49.3% buffered) (Fig. 4a, first panel). Whereas enhancers showed slight preference for a linear response (Fig. 4a, third panel), both promoters and insulators exhibited a clear preference for a buffered response (Fig. 4a, second and fourth panels). This indicates that lower levels of BRG1 are enough to maintain accessibility at promoters and insulators, but higher levels are required for maintaining enhancer accessibility.
Fig. 4: BRG1 dosage sensitivity of enhancer accessibility is associated with enhancer activity.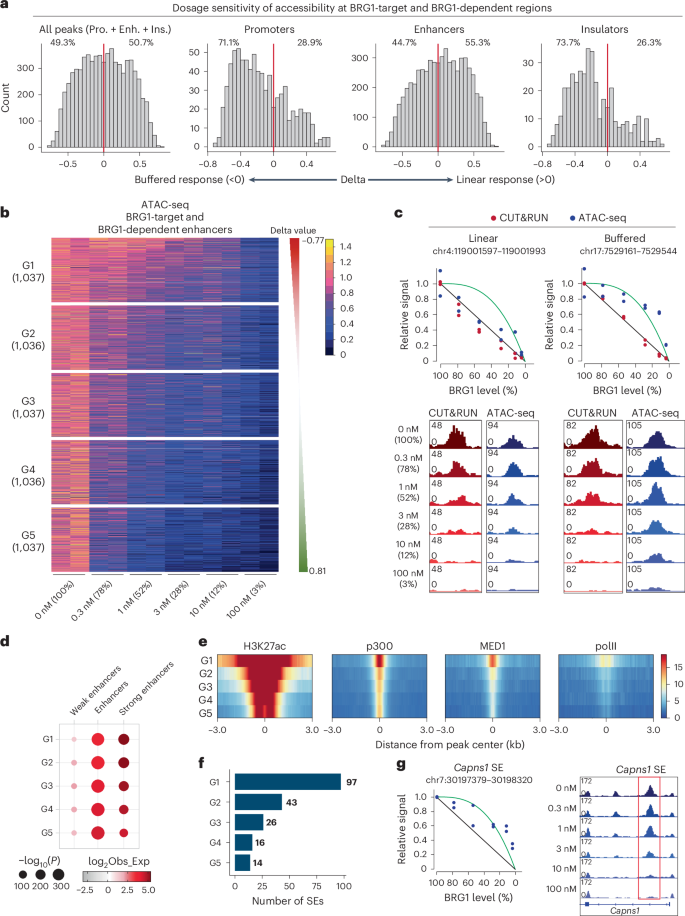
a, Histograms of delta values for BRG1-dependent regulatory elements, including all elements, promoters, enhancers and insulators. The red line indicates delta = 0. b, Heatmap showing BRG1-dependent enhancer regulatory elements clustered into five groups based on delta values, ranging from buffered to linear response regions. c, Representative genome browser views showing linear and buffered responses to BRG1 dosage. Red dots represent CUT&RUN signals under different dTAG13 concentrations, and blue dots represent ATAC-seq signals (top) under different dTAG13 concentrations. Genome browser view showing BRG1 binding at regions with linear and buffered responses (bottom). The linear and buffered models are illustrated in the diagram. d, Enrichment analysis of different element types per group, with enrichment calculated against all consensus regions. Dot size represents −log10(P value), and the color scale corresponds to the effect size measured as an odds ratio. Two-sided Fisher’s exact test was used to compare enrichment to background regions. Obs_Exp represents observed divided by expected frequencies. e, Heatmap showing relative enrichment of chromatin marks and TF binding across different groups of ATAC-seq peaks. f, Number of SEs in each group. g, Genome browser view showing ATAC-seq signals at BRG1-bound Capns1 SE at different dTAG13 concentrations. The linear (black) and buffered (green) models are illustrated in the diagram.
As the major function of BRG1 is to modulate enhancer accessibility, we further explored the dosage sensitivity of BRG1-dependent enhancers by dividing them into five groups based on their sensitivity: group 1 (G1) represented the most buffered enhancers and group 5 (G5) the most linearly sensitive enhancers (Fig. 4b). When BRG1 levels were depleted to half their original value, G1 enhancers retained 80% of their original accessibility, whereas G5 enhancers retained less than 40% (Extended Data Fig. 4a). The BRG1 binding kinetics showed similar dosage sensitivity in the different groups (Fig. 4b and Extended Data Fig. 4b). As shown in representative regions, whereas BRG1 binding predominantly followed a linear model (Fig. 4c, red dots), enhancer accessibility exhibited different linear and buffered responses (Figs. 1k and 4c, blue dots), indicating that regulation of chromatin accessibility is not totally dependent on BRG1 binding.
Next, we examined the regulatory landscape in each BRG1-dependent enhancer group using ChromHMM. We found that dosage sensitivity was correlated with enhancer activity; buffered-response enhancers (G1) were more enriched for strong enhancers compared to linear-response enhancers (G5) (Fig. 4d). The temporal dynamics of accessibility after mSWI/SNF inhibition showed no substantial differences among groups16 (Extended Data Fig. 4c), indicating that dosage sensitivity cannot be explained by differences in the speed of the response to mSWI/SNF inhibition. We then analyzed the enrichment of histone modifications and transcriptional regulators across the five groups. Although TFs including NANOG were found in all groups, G1 enhancers exhibited higher levels of H3K27ac and acetyltransferase p300 (Fig. 4e and Extended Data Fig. 4d), both of which are markers of active enhancers61. These features suggest that G1 has features of SEs, which are characterized by broader chromatin domains and higher levels of H3K27ac and MED1 (ref. 62). Consistently, MED1 was specifically enriched at G1 compared to other groups (Fig. 4e). Among the 231 SEs defined in mES cells62,63, 97 (42%) were classified as G1 (Fig. 4f,g). Furthermore, 195 (84.4%) of SEs were among the BRG1-dependent enhancers (G1 to G5), highlighting the critical role of BRG1 in regulation of SE accessibility. Collectively, these results show that the dosage sensitivity of enhancers is more closely correlated with enhancer activity than with specific TFs. SEs, in particular, tend to exhibit buffered responses to BRG1 dosage.
ChromBPNet reveals sequence basis for BRG1 dosage sensitivity
To gain deeper insights into the sequence features underlying dosage sensitivity, we trained ChromBPNet on ATAC-seq data from control (0 nM dTAG13) and BRG1-depleted (100 nM dTAG13) conditions to predict chromatin accessibility64 (Extended Data Fig. 5a). The model achieved high accuracy, with a Pearson’s correlation of r = 0.84 across BRG1-bound peaks (Extended Data Fig. 5b).
Next, we applied the TF-MODISCO motif discovery algorithm to identify motifs with high contribution scores64,65. Motifs of SP1 and MAZ were enriched in buffered enhancers, whereas OCT4, SOX2 and KLF4 were enriched in linear enhancers (Extended Data Fig. 5c). Marginal footprinting analysis confirmed preferential binding of OCT4 and SOX2 in linear enhancers (Extended Data Fig. 5d). Notably, buffered enhancers exhibited significantly higher GC content than linear enhancers (Extended Data Fig. 5e), suggesting that sequence composition may shape enhancer properties and influence dosage sensitivity.
We then hypothesized that motif abundance within enhancers would contribute to dosage sensitivity. We quantified the numbers of high-score sites66 as putative TF binding sites. G1 enhancers exhibited the highest number of high-score sites. BRG1 depletion led to a reduction in the number of high-score sites; however, G1 enhancers retained more sites than G5 enhancers (Extended Data Fig. 5f,g). These results suggest that motif composition and abundance within enhancers are critical for their response to BRG1 dosage.
Dosage-sensitive transcriptional regulation by BRG1
As chromatin accessibility changes can affect transcription, we next examined how varying BRG1 levels influenced gene expression. Transcriptome analysis revealed a gradual increase in numbers of differentially expressed genes (DEGs) with decreasing BRG1 levels (Fig. 5a and Extended Data Fig. 6a). Despite this trend, the overall number of DEGs was relatively low, with 589 (5.2%) upregulated and 1,016 (9.0%) downregulated genes among the 11,303 expressed genes (fragments per kilobase of transcript per million mapped reads (FPKM) > 1). Genes with BRG1-dependent promoters were downregulated with decreased BRG1 dosage, whereas genes with BRG1-independent promoters showed no major change (Extended Data Fig. 6b). Enhancer-proximal genes followed a similar pattern, although with milder effects; only BRG1-dependent enhancer target genes showed modest but significant reductions in expression (Extended Data Fig. 6c). Moreover, genes associated with linearly sensitive enhancers (G5) exhibited greater effects than those linked to buffered enhancers (G1) (Extended Data Fig. 6d). These results indicate that promoter regulation exerts a stronger transcriptional impact than enhancer regulation.
Fig. 5: Transcription of the majority of genes exhibits buffered response to BRG1 dosage.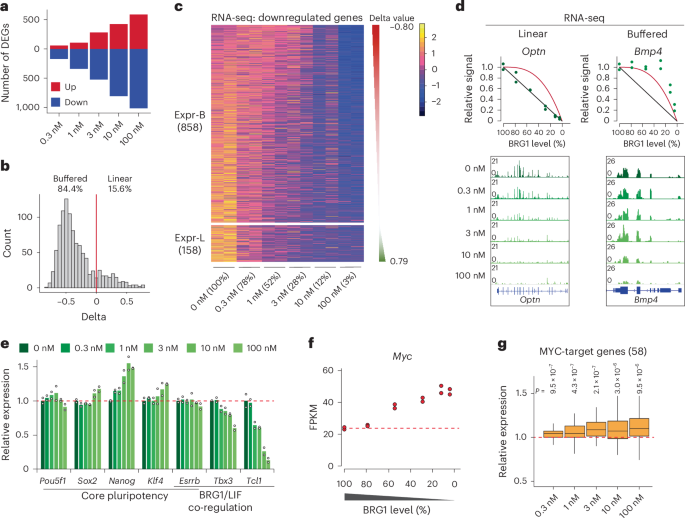
a, Numbers of DEGs at different dTAG13 concentrations (fold change >1.5). b, Histogram of delta values for all 1,016 DEGs. The red line indicates delta = 0. c, Heatmap showing BRG1-dependent genes, clustered into two groups based on delta values: negative or buffered (Expr-B) and positive or linear (Expr-L). d, Representative genes whose expression exhibited linear or buffered responses to BRG1 depletion. Green dots represent mean expression levels. Diagrams illustrating the linear (black) and buffered (red) models are shown. e, Relative gene expression of pluripotency factors at different BRG1 levels. Expression levels are normalized to the expression at 0 nM dTAG13 (DMSO), and the red dashed line represents the mean level at 0 nM. Data are from two independent experiments. f, Myc expression at different BRG1 levels. Data are from two independent experiments. g, Box plot showing expression changes of MYC-target genes under different concentrations of dTAG13. Boxes indicate the 25th to 75th percentiles, the median is shown as a horizontal black line, and whiskers extend up to 1.5 times the interquartile range from the quartiles. Expression levels are normalized to the expression at 0 nM (DMSO). Data represent two independent experiments, and P values were calculated with Wilcoxon’s t-test (two-sided, versus 0 nM).
To further dissect transcriptional responses, we modeled all downregulated genes into buffered or linear response categories (Fig. 5b,c). Notably, the majority of the downregulated genes (84.4%) exhibited buffered responses, with limited numbers of genes (15.6%) showing linear responses to BRG1 dosage (Fig. 5b). Buffered response genes retained more than 75% expression at half BRG1 levels, whereas expression of linear response genes dropped below 50% (Fig. 5d and Extended Data Fig. 6e). Downregulated genes were enriched for terms related to proliferation and the MAPK pathway, implying compromised self-renewal programs in mES cells (Extended Data Fig. 6f). Whereas core pluripotency genes including Oct4 (also known as Pou5f1) remained unchanged, we observed downregulation of Tbx3 and Tcl1, targets of BRG1 and LIF-STAT3 (refs. 67,68,69; Fig. 5e), linking BRG1 dosage to maintenance of mES cell identity.
To assess the phenotypic consequences, we cultured mES cells long-term in varying concentrations of dTAG13. Proliferation defects became noticeable at 10 nM dTAG13, with severe impairments at 100 nM41 (Extended Data Fig. 7a). Alkaline phosphatase staining, a hallmark of undifferentiated states, revealed decreased naive mES cell populations at 1 nM, with higher concentrations resulting in loss of pluripotency (Extended Data Fig. 7b). These results indicate that maintenance of pluripotency is more sensitive to BRG1 dosage than proliferation. We also observed a BRG1-dosage-sensitive inverse correlation in expression of oncogene Myc and Polycomb-target Hox genes (Fig. 5f and Extended Data Fig. 7c), consistent with their dysregulation upon BRG1 perturbation14,55,70. Notably, Myc levels were significantly increased at dTAG13 concentrations of 1 nM or higher, accompanied by activation of MYC-target genes (Fig. 5g), reinforcing Myc as a dosage-sensitive target of BRG1.
BRG1 dosage-sensitive regulation is conserved in human cells
To determine whether the BRG1 dosage-sensitive features observed in mES cells were conserved in other cell types, we investigated BRG1 dosage sensitivity in the BEAS-2B cell line, a normal human bronchial epithelial cell line widely used in lung carcinogenesis studies71,72,73. Approximately 35% of lung cancers, including non-small-cell lung cancers, harbor mutations in genes encoding mSWI/SNF subunits22,74. Conditional knockout of Brg1 and/or Brm in mouse lungs leads to cancer development and progression75, suggesting that dosage of mSWI/SNF components is critical for lung cell homeostasis. Unlike mES cells, BEAS-2B cells express both BRG1 and BRM (Extended Data Fig. 8a), which exhibit cooperative and antagonistic functions76. To simplify the BRG1 dosage analysis, we generated BRM-knockout BESA-2B cells (Extended Data Fig. 8b). Knockout of BRM did not alter cell morphology (Extended Data Fig. 8c), BRG1 binding (Extended Data Fig. 8d) or chromatin accessibility (Extended Data Fig. 9c; comparison of ATAC-seq results for wild-type versus BRM-knockout, 0 nM), indicating that the remaining mSWI/SNF complexes containing only BRG1 could maintain cell and chromatin states similar to those of wild-type cells.
We depleted BRG1 using AU-15330, a PROTAC targeting BRG1 and BRM60 that enables rapid BRG1 degradation within 2 h (Extended Data Fig. 8e), and observed dosage-dependent degradation after the treatment (Fig. 6a). Population-wide BRG1 depletion was confirmed by immunostaining (Extended Data Fig. 8f,g). Consistent with a previous report60, we observed degradation of PBAF-specific subunit PBRM1 (Extended Data Fig. 8h). These results indicate that AU-15330 allows precise control of BRG1 levels, similar to the dTAG system.
Fig. 6: Conserved dosage sensitivity in human lung epithelial cells.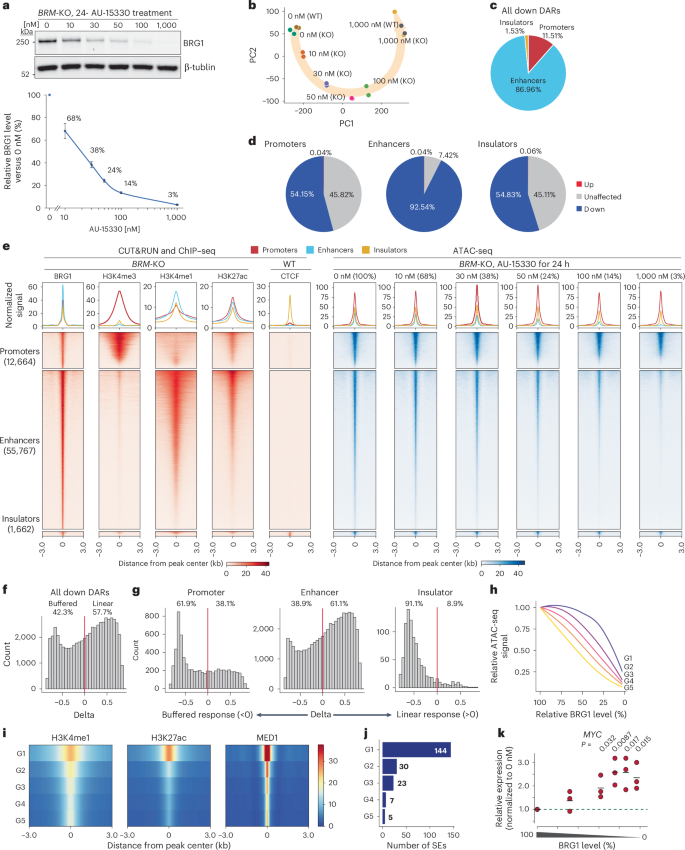
a, Western blot analysis of BRG1 in BRM-knockout (KO) BEAS-2B cells after treatment with the indicated concentrations of AU-15330 for 24 h (top). Data are presented as the mean ± s.e.m. from four independent experiments. Quantification of relative BRG1 abundance following AU-15330 treatment (bottom). BRG1 expression relative to that of tubulin was normalized to DMSO-treated (0 nM) BRM-KO BEAS-2B cells. b, PCA of ATAC-seq data across different AU-15330 concentrations. Cells were treated with AU-15330 for 24 h. c, Pie chart depicting relative percentages of significantly changed ATAC-seq signals at promoters, enhancers and insulators. d, Pie charts depicting percentages of significantly changed ATAC-seq signals at BRG1 target sites in promoters, enhancers and insulators. e, Heatmap showing profiles of protein and histone modifications (CUT&RUN and ChIP–seq89) (red) and ATAC-seq (blue) for regions falling into genomic elements at the indicated dTAG13 concentration (bottom). The top panel shows aggregate coverage plots with mean enrichment at promoters (red), enhancers (cyan) and insulators (orange). f, Histogram of delta values for BRG1-dependent regulatory elements (promoters + enhancers + insulators). g, Histograms of delta values for BRG1-dependent promoters, enhancers and insulators. The red line indicates delta = 0. h, Chromatin accessibility changes for each of the five groups of BRG1-dependent enhancers in BEAS-2B cells. Lines show the mean of each group, shaded areas indicate the s.e.m. i, Heatmap showing relative enrichment of chromatin marks and MED1 binding across different groups of ATAC-seq peaks. j, Number of SEs in each group. k, MYC expression relative to that of GAPDH at different BRG1 levels. The level was further normalized by 0 nM AU-15330 conditions. Data represent three independent replicates, each with three technical replicates. Bars indicate the average.
We then investigated changes in chromatin accessibility in response to varying BRG1 levels. As in mES cells, numbers of DARs progressively increased with BRG1 degradation levels (Extended Data Fig. 9a), with most DARs showing reduced accessibility (Extended Data Fig. 9b). PCA revealed that wild-type and BRM-knockout cells were clustered together under both control (0 nM AU-15330) and depletion (1,000 nM AU-15330) conditions, with a global shift correlated with AU-15330 concentration (Fig. 6b). BRG1 depletion predominantly affected enhancer accessibility (Fig. 6c), with more than 90% of BRG1-bound enhancers showing reduced accessibility (Fig. 6d,e). By contrast, only about half of the BRG1-bound promoters and insulators were affected (Fig. 6d,e). These differences among regulatory elements were consistent with our observations in mES cells. However, the numbers and proportions of affected regions were higher across all regulatory elements in BEAS-2B cells (Figs. 2c and 6d), suggesting a greater dependence on mSWI/SNF for chromatin accessibility in this cell type.
To understand the role of BRG1 in chromatin regulation, we compared BRG1-dependent and BRG1-independent regulatory elements (Extended Data Fig. 9c,d). BRG1-independent promoters exhibited greater H3K4me3 enrichment, a hallmark of strong promoters (Extended Data Fig. 9c). Motif enrichment analysis revealed that both BRG1-dependent promoters and enhancers, as well as BRG1-independent enhancers, were enriched for AP-1 components (FOS and FOSL1) and AP-1-associated factor ATF3 motifs, consistent with their cooperative functions77,78 (Extended Data Fig. 9e). Notably, BRG1-independent promoters were enriched for NFY and SP1 motifs, as observed in mES cells (Fig. 3a), suggesting a conserved regulatory mechanism across different cell types.
To explore the dosage sensitivity of these changes, we divided regions with decreased chromatin accessibility into buffered and linear response categories (Fig. 6f). Promoters and insulators exhibited mostly buffered responses, whereas enhancers showed both linear and buffered responses (Fig. 6g). We further classified enhancers based on their dosage sensitivity (G1–G5 groups) (Extended Data Fig. 9f). Buffered enhancers retained more ATAC-seq signal than linear enhancers at moderate BRG1 levels (Fig. 6h and Extended Data Fig. 9g). G1 buffered enhancers displayed strong H3K27ac enrichment, whereas G5 linear enhancers had weaker enrichment (Fig. 6i). Of the 276 SEs identified based on MED1 signals, 209 (75.7%) were affected by BRG1 depletion. Notably, SEs were preferentially enriched in the G1 group (Fig. 6j), consistent with our findings in mES cells.
MYC has a critical role in lung cancer79, and we found its expression to be highly sensitive to BRG1 dosage: it was upregulated 1.9-fold at 38% BRG1 (Fig. 6k). By contrast, the expression of oncogene KRAS was unaffected (Extended Data Fig. 9h). Near-complete depletion of mSWI/SNF led to growth defects, whereas partial depletion had a limited impact (Extended Data Fig. 9i).
Collectively, our results reveal conserved mSWI/SNF dosage sensitivity in regulation of chromatin accessibility, cellular homeostasis and MYC expression. Modest reductions in BRG1 levels led to upregulation of MYC without compromising proliferation, whereas further depletion impaired proliferation. These findings support the proposition that mSWI/SNF functions as a tumor suppressor while remaining essential for cancer cell growth21,22,80 and further suggest that its dosage-sensitive regulatory effects contribute to cancer progression, particularly via control of MYC oncogene activation.

