
Assembly and annotation of six representative peanut genomes
To determine the genome structure and genetic diversity of A. hypogaea, we sequenced six representative accessions: two diploid progenitors (A. duranensis, V14167; A. ipaensis, K30076), and four allotetraploid cultivars (Laiyang Silihong, S245; Chedouzi, HN873; Huayu23, HN51; Yunnan Rainbow Peanut, S83) (Fig. 1). These accessions exhibited diverse phenotypes, including differences in tiller angle, flower characteristics, and seed size, shape and number (Fig. 1). Heterozygosity rates ranged from 0.14% to 0.36% (Supplementary Table 1). Using PacBio sequencing, we generated 1.42 Tb (average depth of 116×) of HiFi reads (Supplementary Table 2), assembling genomes with an average contig N50 of 85.94 Mb using Hifiasm (v.0.19.5)22 (Table 1). High-throughput chromatin conformation capture (Hi-C) data (average depth of 112×) were used to corrected and orient contigs (Supplementary Fig. 1 and Supplementary Tables 2 and 3), and Oxford Nanopore Technologies (ONT) ultralong-read sequencing was used to fill gaps (average depth of 70×; Supplementary Tables 2 and 4), resulting in T2T peanut genomes ranging from 1.18 Gb to 2.63 Gb (Table 1). Telomeres were identified using 7-bp telomere repeats (CCCATTT at the 5′ end and TTTAGGG at the 3′ end). Assembly quality was assessed using metrics including BUSCO23 completeness score of 98.67% and long terminal repeat (LTR) assembly index (LAI)24 score of 21.76, indicating high completeness (Table 1). The accuracy was validated by a quality value25 of 47.52 and a mapping rate of 99.76% for Illumina short reads (Table 1 and Supplementary Table 5). In addition, k-mer distribution curves demonstrated high completeness in the duplicated regions (Supplementary Fig. 2). Transcriptome sequencing achieved a mapping rate of 92.93% (Supplementary Table 6). Our T2T genomes demonstrated superior quality and completeness compared to previously published genomes (Supplementary Fig. 3). Using ab initio, homology and transcript-based evidence, we predicted 34,406 to 75,143 protein-coding genes across the accessions, with an average functional annotation rate of 98.75% (Table 1 and Supplementary Table 7). The average gene length was 2,654 bp, with coding sequences (CDSs) between 1,080 bp and 1,123 bp in length (Supplementary Table 8). BUSCO evaluation showed that 98.88% of single-copy genes were completely annotated, further confirming the accuracy of gene annotations (Table 1).
Fig. 1: Phenotypes and genome characterization.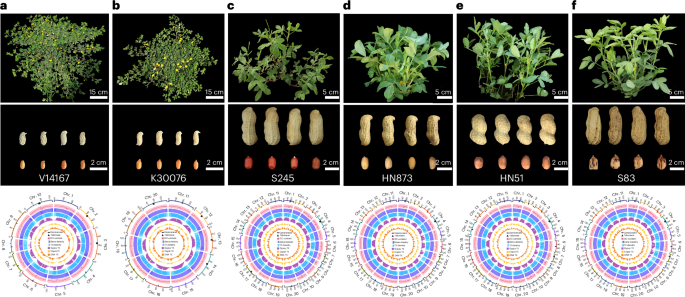 The alternative text for this image may have been generated using AI.
a–f, From top to bottom: plant structures, pods, seeds and Circos plot depicting the genomic features of the V14167 (a), K30076 (b), S245 (c), HN873 (d), HN51 (e), and S83 (f) accessions. The scale for the chromosomes (outer bars) is Mb. The triangles represent telomeres, and the bars represent centromeres. From outside to inside, the different tracks of the Circos plots represent GC content, gene density, TE density, and distributions of Gypsy, Copia and DNA TEs. The gene and TE densities were calculated based on a 200-kb window size.
Table 1 Overview of assembly and annotation statistics for diploid and tetraploid peanutsTEs and centromeres imply asymmetry evolution
Transposable elements (TEs) are crucial sources of lineage-specific genomic innovation and have vital roles in peanut genome evolution. TEs accounted for an average of 76.27% of each genome, ranging from 74.65% to 77.69% (Table 1 and Supplementary Table 9). The TE content in the Bt subgenomes (average 77.77%) was consistently higher than that in the At subgenomes (average 75.08%), and a similar difference was also observed between the B (77.69%) and A (74.65%) diploid genomes. Specifically, Gypsy elements constituted 52.40% (~605.50 Mb) of the A(t) genome/subgenomes, whereas they accounted for 58.91% of the B(t) genome/subgenomes (~865.57 Mb) (Supplementary Table 9). Analysis of base substitution rates using a rate of 1.64 × 10⁻⁸ revealed distinct rates of LTR expansion between the At and Bt subgenomes. The Gypsy family in the A(t) genome/subgenomes expanded approximately 0.20 million years ago (Ma), before tetraploidization, whereas two expansion peaks occurred at 0.69 Ma and 0.27 Ma in the B(t) genome/subgenomes (Fig. 2a). We observed different insertion times for Gypsy-type LTRs in the At and Bt subgenomes. The Athila, Retand, CRM and Ogre types experienced two expansions in the B(t) genome/subgenomes, but only the Reina type underwent two expansions in the A(t) genome/subgenomes (Supplementary Fig. 4). We categorized Gypsy and Copia TEs based on their insertion times into four periods: S1 (1–11,000 years ago), S2 (11,001–101,000 years ago), S3 (101,001–301,000 years ago) and S4 (>301,000 years ago). Counts for the A genome were 284, 1,445, 5,323 and 9,553 from S1 to S4; for the B genome, these counts were 467, 1,439, 3,433 and 15,873 (Supplementary Table 10). This indicates that TE insertion events occurred more frequently in the A genome during the S3 period. In the tetraploid subgenomes, counts in the At subgenomes were 343, 1,396, 4,655, and 9,747, whereas those in the Bt subgenomes were 416, 1,392, 3,314 and 15,592, respectively. Gypsy-type TEs were primary contributors to TE insertions in the A genome during the S3 phase, with counts of 4,388 in the A genome and 3,861 in the At subgenomes, compared to 2,417 and 2,259 in the B genome and Bt subgenomes, respectively. Comparative analysis of the two main types of Gypsy TEs, Athila and Retand, revealed shorter insertion times in the A(t) genome/subgenomes than in the B(t) genome/subgenomes (Supplementary Fig. 5). Full-length Athila phylogenetic trees indicate distinct evolutionary characteristics after the divergence of the A(t) and B(t)genome/subgenomes (Fig. 2b). Notably, several Athila and Retand TEs were absent from tetraploid subgenomes but present in the diploid genomes (Supplementary Fig. 5).
Fig. 2: Asymmetric subgenome evolution.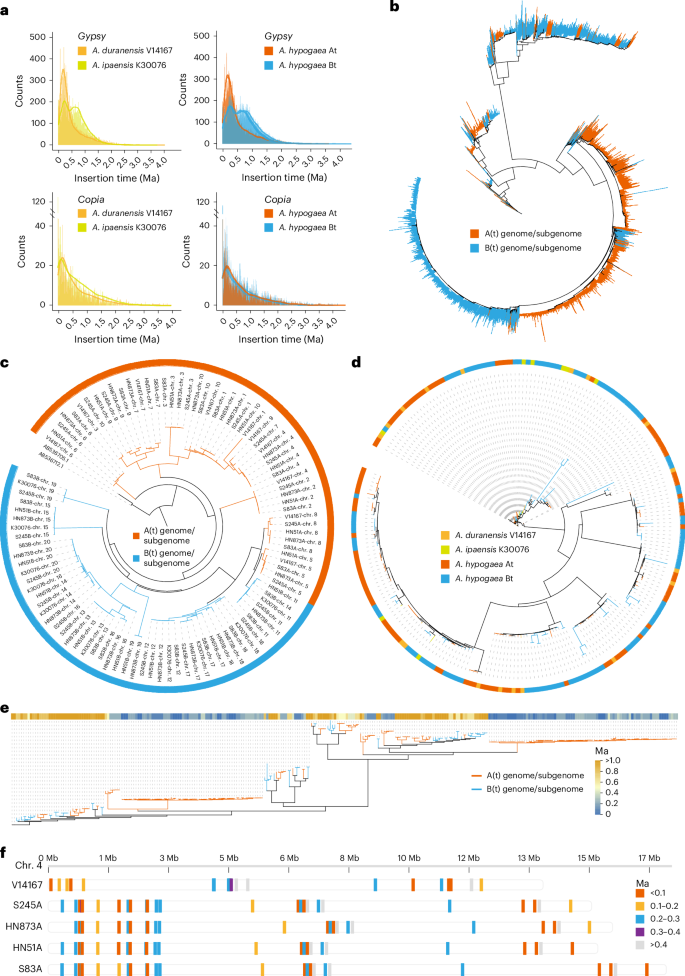 The alternative text for this image may have been generated using AI.
a, Insertion times obtained using the LTR retrotransposons (Gypsy and Copia) in the A. hypogaea At (S245A, HN873A, HN51A and S83A), A. hypogaea Bt (S245B, HN873B, HN51B and S83B), A. duranensis (V14167) and A. ipaensis (K30076) genomes. b, Phylogenetic analysis of the expansion of Athila LTR retrotransposons across the entire A(t) and B(t) genome/subgenomes. c, The phylogenetic relationships between the A(t) and B(t) genome/subgenomes, analyzed using the CentO repeat unit. d, Maximum likelihood phylogenetic tree based on alignments of the full-length CRM within the centromeric regions of the A(t) and B(t) genome/subgenomes. e, Phylogenetic relationships and insertion time of full-length Retand elements in the centromeric regions of the A(t) and B(t) genome/subgenomes. f, Synteny analysis and timing of insertion of full-length Retand elements in the At subgenomes and the diploid genome (V14167) in the centromeric region on chr. 4.
In the diploid genomes, the total lengths of centromeres were 44.70 Mb and 43.30 Mb; by contrast, the At subgenomes showed an increase in average length of 46.11 Mb, whereas the Bt subgenomes experienced a significant reduction, with an average length of 25.70 Mb (range: 23.18–29.81 Mb) (Supplementary Table 11). This difference was primarily due to a reduction in the number of repetitive units in the Bt subgenomes. Phylogenetic analysis based on centromere monomers revealed that monomers from the A(t) genome/subgenomes clustered together, as did those from the B(t) genome/subgenomes, indicating independent evolution of CentO units (Fig. 2c). Centromeric repetitive elements (CRMs) were interspersed between the At and Bt subgenomes, suggesting synchronous insertion and evolution of CRMs (Fig. 2d). The A(t) and B(t) genome/subgenomes showed different Retand element activity, with a later burst insertion observed in the A(t) genome/subgenomes but absent from the B(t) genome/subgenomes (Fig. 2e). The noncollinearity results for Retand elements on chromosome 4 indicated that following tetraploid formation, the A genome and At subgenomes experienced different reshaping in centromere regions (Fig. 2f and Supplementary Fig. 5).
SVs during peanut evolution and domestication
T2T genomes enable precise identification of SVs and rearrangements through comparison of diploid and tetraploid chromosomes. Using SyRI (v.1.5.3)26 and SVMU (v.4.0.0beta2)27, we detected 153,947 insertions, 182,467 deletions, 6,272 copy number variations (CNVs), 2,351 translocations and 644 inversions in four tetraploid peanut accessions compared to diploid genomes V14167 and K30076 (Supplementary Table 12 and Supplementary Fig. 6a,b). Specifically, the At subgenomes exhibited 128,260 insertions, 145,963 deletions, 4,495 CNVs, 2,174 translocations and 520 inversions, whereas the Bt subgenomes showed only 25,687 insertions, 36,504 deletions, 1,777 CNVs, 177 translocations and 124 inversions. Genes located within 2 kb upstream or downstream of the SV breakpoints (termed SV genes) were identified, with an average of 9,682 SV genes per accession (ranging from 9,522 to 10,006); 45.42% of the SV genes were TE-SV genes (Supplementary Table 13 and Supplementary Fig. 7a,b). Further comparisons among tetraploid cultivated accessions revealed a total of 17,216 insertions, 28,554 deletions, 1,692 CNVs, 177 inversions and 215 translocations when comparing S83 to S245, HN873 and HN51 (Supplementary Table 12 and Supplementary Fig. 6c). The At subgenomes averaged 8,370 insertions and 14,712 deletions, whereas the Bt subgenomes had 8,864 insertions and 13,842 deletions. SV gene analysis indicated a total of 4,886, 4,533 and 4,392 SV genes for the S245 versus S83, HN873 versus S83, and HN51 versus S83 comparisons, respectively, with an average of 2,015 classified as TE-SV genes (Supplementary Table 13 and Supplementary Fig. 7c). To validate the accuracy of SV identification, we confirmed 202 large SVs via PCR amplification (Supplementary Table 14 and Supplementary Fig. 8). Gene Ontology (GO) and Kyoto Encyclopedia of Genes and Genomes (KEGG) enrichment analyses of SV genes showed significant associations with pathways involved in flavonoid biosynthesis, brassinosteroid biosynthesis and fatty acid metabolism (Supplementary Tables 15–17). We also identified conserved SVs across all tetraploid subgenomes, indicating rearrangements from or before tetraploidization, particularly in the A(t) genome/subgenomes. By contrast, fewer specific rearrangements were noted in the B(t) genome/subgenomes, with a notable 4.48-fold difference in size between At:A and Bt:B (Supplementary Figs. 9 and 10).
Analysis of the relationship between SVs and domestication revealed unique variations among the tetraploid accessions. Compared to the landrace HN873, S245, HN51 and S83 had significantly more unique SVs and genes. Specifically, S245 contained 7,431 SVs (861 genes), S83 had 6,059 SVs (841 genes) and HN51 had 4,156 SVs (448 genes), whereas HN873 had 2,593 SVs (253 genes). In the GO enrichment analysis, the HN873 genes were significantly enriched in terms including calcium ion transport, metal ion transport and and monoatomic cation transport, whereas HN51 was linked to tissue development terms such as embryonic morphogenesis, flower development, pollen tube growth, post-embryonic development, shoot system development, vascular transport and phloem transport (Supplementary Table 18). Unique SV genes in S245 and S83 were enriched in fatty acid synthesis and metabolism, with S245 also enriched in defense responses and nutrient level regulation, whereas S83 was related to root development and endoderm formation. These findings suggest that SVs have a crucial role in shaping the domestication of different peanut varieties through artificial selection.
A 13.23-Mb insertion on chr. 14 was found in the K30076, S83, HN51 and HN873 accessions (Fig. 3a–e), with next-generation sequencing showing the insertion to be present in all 161 var. hirsuta but only 33 of 161 var. hypogaea accessions (Supplementary Fig. 11). This insertion could contribute to phenotypic differences between var. hirsuta and var. hypogaea. KEGG analysis of the 109 genes within the insertion regions highlighted enrichments in lipid metabolism, lignin biosynthesis and responses to environmental stressors (Fig. 3f,h and Supplementary Fig. 12). Genes of chr. 14.1804 homologous to OsLAC (Fig. 3g,i), which plays an important part in regulation of plant architecture and seed development in rice28, were expressed in peanut lateral branch, axillary bud and hypocotyl (Supplementary Fig. 12). Another gene, chr. 14.1829, which is homologous to WOX3A/B29,30, was specifically expressed in the embryo, axillary buds and stem apices (Fig. 3g,i and Supplementary Fig. 12), suggesting that the insertion may have a role in the unique phenotype of var. hirsuta.
Fig. 3: SVs among tetraploid peanuts.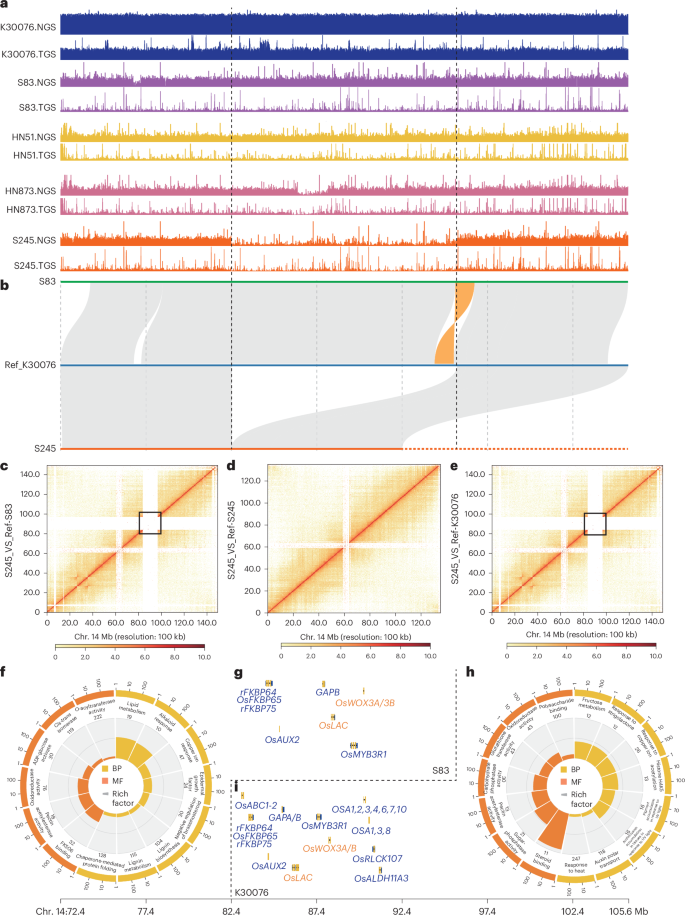 The alternative text for this image may have been generated using AI.
a, Coverage of SVs on chr. 14 of the K30076, S83, HN51, HN873 and S245 genomes using Illumina (next-generation sequencing) and HiFi (third-generation sequencing) reads. b, A large SV (deletion) was detected in S245 during collinearity analysis of S83, K30076 and S245. c–e, Hi-C heatmaps constructed using reads from the S245 accession and the reference genomes for S83 (c), S245 (d) and K30076 (e). f, GO enrichment analysis of genes located in the SV regions of the S83. g, Functional homologous rice genes of the SV genes in S83. h, GO enrichment analysis of genes located in the SV regions of K30076. i, Functional homologous rice genes of the SV genes in K30076. NGS, next-generation sequencing; TGS, third-generation sequencing; UV, ultraviolet.
Population structure
A total of 521 globally collected peanut accessions were sequenced, yielding an average depth of 16.76× and 96.71% genome coverage (Supplementary Table 19). Using the S245 genome as a reference, we identified 101,334,387 high-quality single-nucleotide polymorphisms (SNPs), averaging 39 SNPs per kilobase (Supplementary Table 20). Phylogenetic and population structure analyses classified the accessions into five genetic groups: wild (G1), var. fastigiata + admixture (G2), var. vulgaris (G3), var. hypogaea (G4) and var. hypogaea + var. hirsuta (G5) (Fig. 4a and Supplementary Figs. 13 and 14a). Principal component analysis (PCA) confirmed the five distinct clusters corresponding to lineages G1–G5 (Fig. 4b). The G5 population showed significant differentiation from G2 and G3 but not from G4. Genetic diversity analysis indicated that the most pronounced differences were between G2 and other groups, whereas G4 and G5 exhibited minimal differences (Fig. 4c). The linkage disequilibrium (LD) decay rate was lowest in G1 and highest in G2 (Fig. 4d). Divergence times estimates indicated that cultivated peanuts diverged into var. fastigiata (G2+G3) and var. hypogaea (G4+G5) around 9,400 years ago, with further differentiation occurring among groups at approximately 7,200 and 8,900 years ago, respectively (Supplementary Fig. 14b).
Fig. 4: Population structure and introgression analyses.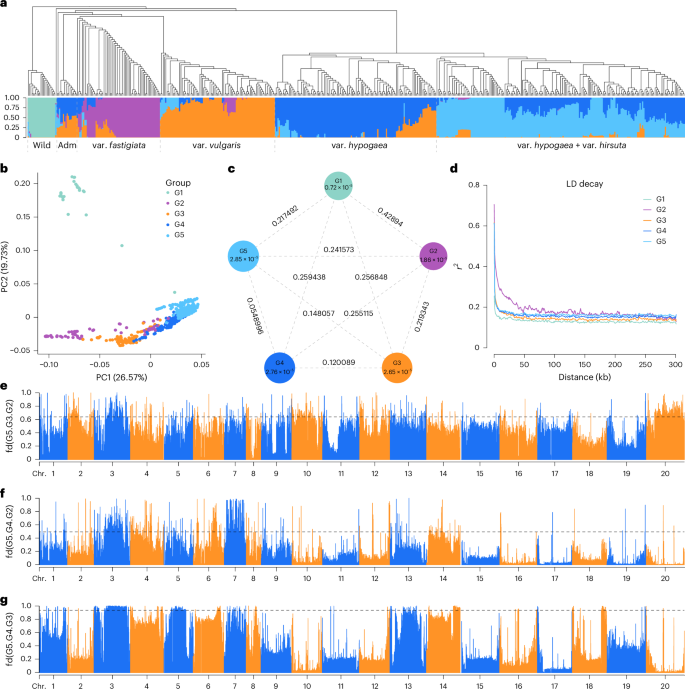 The alternative text for this image may have been generated using AI.
a, Phylogenetic tree and population structure analysis of 521 peanut accessions. b, PCA plot of the first two principal components (PC1 and PC2) of the five groups. c, Population differentiation (FST) and genetic diversity (π) across the five groups. d, LD decay estimation for the five groups. e–g, Introgression analysis (fd) among different groups: G2 to G3 (top 1% threshold line: 0.64 (e)), G2 to G4 (top 1% threshold line: 0.49 (f)) and G3 to G4 (top 1% threshold line: 0.94 (g)) on different chromosomes, with G5 as the outgroup. Adm, admixture.
Selected regions and introgressed tracts
Genomic regions under selection were analyzed by calculating population fixation statistic (FST) and cross-population composite likelihood ratio (XP-CLR) values between groups (Supplementary Tables 21 and 22). The top 1% of FST and XP-CLR intervals were retained to identify selected genes within the G2–G3, G2–G4, G2–G5, G3–G4, G3–G5 and G4–G5 groups. TE insertions were categorized into five time periods for assessment of their impact on these selected sweep regions; this showed that recent TE insertions had smaller effects compared to earlier ones (Supplementary Fig. 15). After filtering of TE intervals, the average length of selective sweep regions in the top 1% of FST was 69.39 Mb, containing an average of 2,463 genes (ranging from 697 to 3,838) (Supplementary Table 21). Notably, an average 4.98 Mb of differentially selected regions were identified in the Bt subgenomes, compared to only 2.47 Mb in the At subgenomes, indicating asymmetric evolution. Four-taxon fd statistics detected introgressed regions, with significant gene flow primarily observed in the At subgenome, especially in the G2–G3 and G4–G5 groups (Fig. 4e–g, Supplementary Fig. 16 and Supplementary Tables 23 and 24). Compared to diploids, 22.48%, 51.97% and 49.19% of SNPs were retained in the top 1% of FST, XP-CLR and introgression regions in tetraploids, respectively (Supplementary Figs. 17 and 18). GO and KEGG analyses identified selected genes related to fatty acid synthesis, flavonoid biosynthesis and nutrient metabolism (Supplementary Fig. 19).
Identification of peanut haplotypes linked to higher oil content
Genome-wide association study (GWAS) analysis identified significant signals on chromosome 8 associated with peanut oil content (Fig. 5a–c), pinpointing 151 genes in the 200-kb regions. Among these, we identified a candidate gene, chr. 8.2620 (named AhWRI1), located approximately 54,934 bp from the peak at chr. 8:54293412 (P = 3.02 × 10⁻⁸). Gene structure analysis revealed a base change (A to C) in the promoter region and a nonsynonymous SNP in the first exon (T to G) that altered an amino acid from arginine to methionine (Fig. 5d–f). Expression analysis of AhWRI1 indicated predominant expression during seed development (Supplementary Fig. 20). Based on 153 accessions with RNA sequencing (RNA-seq) data, the Hap1 type had an average fragments per kilobase million (FPKM) value of 16.30 and an oil content of 48.41%, whereas the Hap2 type had an average FPKM value of 24.81 and an oil content of 54.10% (Supplementary Table 25). Quantitative PCR with reverse transcription (RT‒qPCR) confirmed higher AhWRI1 expression in Hap2-type accessions (Supplementary Fig. 21). The correlation between promoter haplotype and expression level suggested causal variation in the promoter region. Subcellular localization studies confirmed that AhWRI1 is a transcription factor (Fig. 5g). Transgenic lines overexpressing AhWRI1 in rapeseed and soybean showed lipid droplet accumulation in the leaf mesophyll cells, as detected by confocal imaging and Nile red staining (green) (Fig. 5h,i and Supplementary Fig. 22a). We assessed total triacylglycerol content in seeds and found that AhWRI1 overexpression significantly increased fatty acid levels (Fig. 5j and Supplementary Fig. 22b). We also noted that four transcriptional regulators, LEAFY COTYLEDON1 (LEC1), FUSCA3 (FUS3) and ABSCISIC ACID INSENSITIVE3 (ABI3), were crucial for seed development31,32,33,34,35 and oil production36,37,38. We found that AhLEC1, AhFUS3, AhABI3 and AhWRI1 had higher expression in high-oil varieties compared to low-oil ones (Supplementary Fig. 21). Yeast one-hybrid and dual-luciferase assays showed that AhWRI1 regulated downstream plant fatty acid biosynthesis pathway protein genes AhACP1 and AhKAS1, whereas AhFUS3, AhABI3 and AhLEC1 bound to the AhWRI1 promoter (Fig. 5k,l). The E-box motif, identified in the phase promoter of beans with respect to its strict expression during embryogenesis39, was also recognized as an induced binding motif in cis-motifs associated with ABI3 binding peaks in Arabidopsis36. An A-to-C mutation was discovered in the 2,040-bp promoter region of AhWRI1, located within an E-box, with a conserved RY motif on the complementary strand recognized by seed-specific transcription factors (Fig. 5m). In yeast one-hybrid assays, cloning of the 52-bp sequence containing the RY and E-box motifs revealed that the C-to-A mutation eliminated interaction with FUS3 (Fig. 5n). In addition, dual-luciferase assays showed that the promoter activity of the C variant was significantly higher than that of the A variant, regardless of combination with SK (P = 4.14 × 10⁻⁵, n = 6) or FUS-SK (P = 1.04 × 10⁻⁶, n = 6) (Fig. 5o). This mutation affected binding with AhFUS3, leading to variations in transcriptional activity and expression of the AhWRI1 gene that resulted in differences in average oil content among varieties.
Fig. 5: Causal gene and haplotype controlling oil content.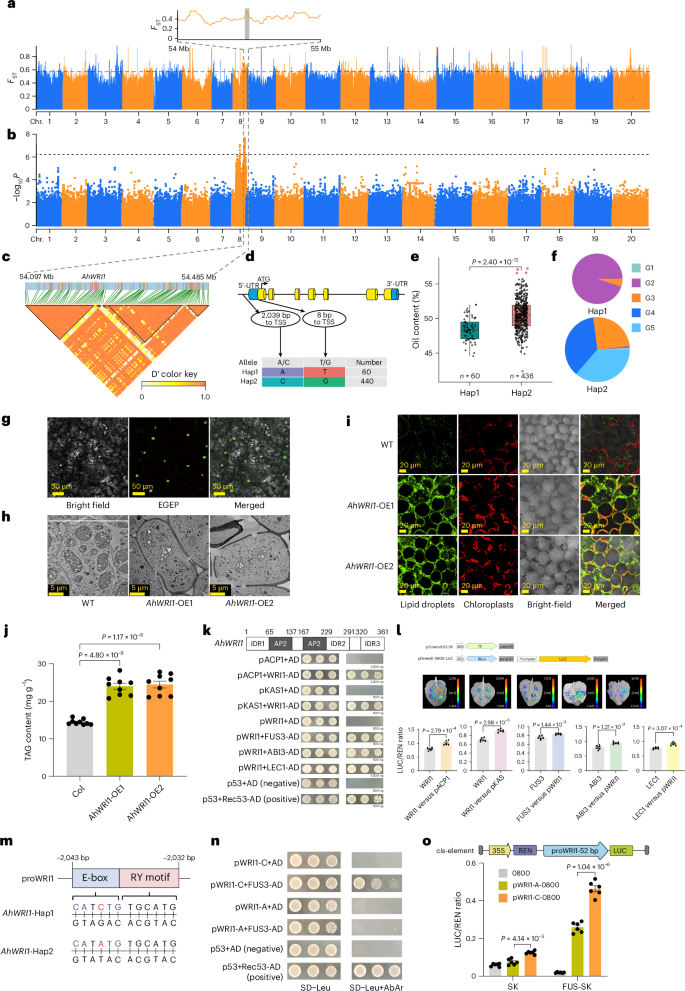 The alternative text for this image may have been generated using AI.
a, Genome-wide screening of selective sweep regions using FST analysis (F-statistics). The top 1% threshold line is at 0.57. b, Significant signals from a GWAS of oil-related traits on chr. 8. Horizontal lines represent the significance threshold (P = 6.26 × 10⁻⁷, Bonferroni correction). c, LD block of a candidate peak with 200-kb upstream and downstream regions. d, Structure of the AhWRI1 gene and two variants in the promoter and the first exon. e, Significant difference in oil content between the Hap1 (range: 44.56–52.00%; n = 60) and Hap2 (range: 42.38–57.23%; n = 436) accessions. Center line, median; box lower and upper edges, 25% and 75% quartiles, respectively; whiskers, 1.5× interquartile range; colored dots, outliers. f, The distribution of Hap1 and Hap2 across different groups. g, Subcellular localization of AhWRI1. h, Accumulation of lipid droplets in rapeseed leaf mesophyll cells overexpressing AhWRI1. i, Confocal images of Nile red-stained lipid droplets (LDs; green) in rapeseed leaves with the trans-AhWRI1 gene. j, Total triacylglycerol content in rapeseed leaves expressing AhWRI1. Quantitative data are mean ± s.e.m. n = 9 biologically independent samples. k, Yeast one-hybrid assays showing binding of AhWRI1 to the promoters of AhACP1 and AhKAS1 and binding of AhFUS3, AhABI3 and AhLEC1 to the AhWRI1 promoter. l, Dual-luciferase assays in N. benthamiana leaves showing that AhWRI1 activates the AhACP1 and AhKAS1 promoters, and that AhFUS3, AhABI3 and AhLEC1 activate the AhWRI1 promoter; an empty reporter (no promoter) served as a negative control. Quantitative data are mean ± s.e.m. n =6 biologically independent samples. m, Mutation site in the AhWRI1 promoter; the E-box motif is highlighted in blue and the RY motif in pink. n, Yeast one-hybrid assay showing that the C-to-A substitution in the AhWRI1 promoter abolishes interaction with AhFUS3. o, Dual-luciferase assay comparing activities of the AhWRI1 promoters carrying the A or C allele. Quantitative data are mean ± s.e.m. n = 6 biologically independent samples. P values were calculated by two-tailed Student’s t-tests (e, j, i and o). TAG, triacylglycerol; TSS, transcription start site; UTR, untranslated region; WT, wild type.
AhGSA1 gene for increased peanut seed size and weight
Seed size and weight are critical traits in peanut breeding, yet understanding of the natural causal variation underlying these traits remains limited despite numerous identified QTLs. Through a GWAS, we identified 62 candidate SNPs on chromosome 16, spanning 130 genes (Fig. 6a–d). These genes included chr. 16.3093 (named AhGSA1), annotated as glycosyltransferase, overexpression of which significantly increased grain size by modulating cell proliferation and expansion in rice40. Notably, an insertion–deletion within the promoter region (660 bp from the transcription start site) of AhGSA1 was identified (Fig. 6e). RT–qPCR analysis of 30 small-seeded and 30 large-seeded accessions further confirmed a significant difference in the expression levels of Hap1 and Hap2 (Fig. 6f). Forty-two accessions classified as Hap1 (ATT type) had an average thousand-grain weight of 490.82 g, whereas 293 accessions of the Hap2 (AT type) exhibited a significantly higher average thousand-grain weight of 846.34 g (P = 1.00 × 10⁻²⁰) (Fig. 6g). In addition, expression analysis showed that AhGSA1 had high expression levels in peanut pods at all developmental stages but was not expressed in the seed coat (Supplementary Fig. 23). The correlation between haplotypes in the promoter region and expression levels suggested that AhGSA1 contributes to variation in seed size and weight. Furthermore, Hap1 was predominantly found in the G2 (var. fastigiata) population, indicating differential selection among cultivated groups (Fig. 6h). We cloned the 1,000-bp promoter sequence harboring the ATT or AT mutation and demonstrated its ability to activate GUS reporter gene expression. The GUS expression driven by the AT promoter was stronger than that driven by the ATT promoter (Fig. 6i). Subcellular localization studies showed that AhGSA1 was localized to the cytoplasmic membrane (Fig. 6j). Dual-luciferase analysis confirmed that AT promoter activity was significantly greater than that of ATT (P = 1.02 × 10⁻⁴, n = 3) (Fig. 6k), highlighting the importance of the insertion–deletion in the promoter region for AhGSA1 transcription.
Fig. 6: Candidate gene associated with peanut seed size and weight.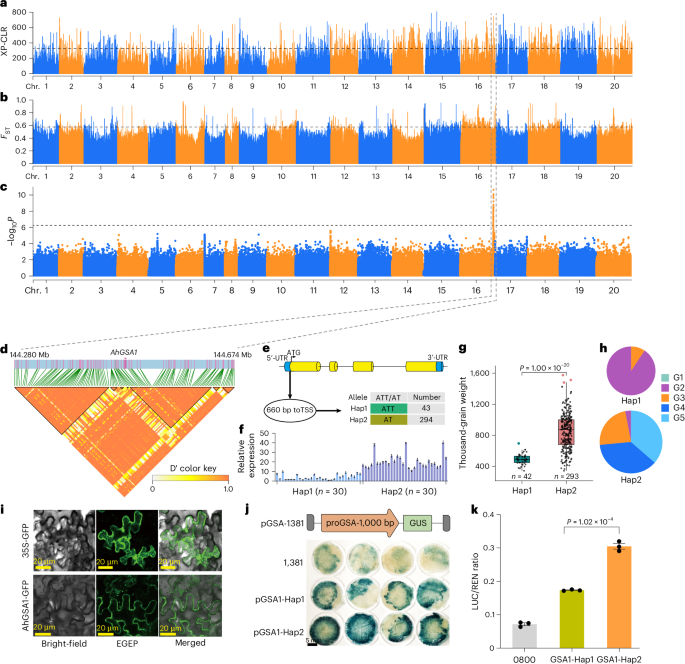 The alternative text for this image may have been generated using AI.
a,b, Genome-wide scans for selective sweeps using XP-CLR test (threshold line: 326.54) (a) and FST (threshold line: 0.58; F-statistics) (b). c, Significant signals from GWAS of oil-related traits on chr. 16. Horizontal lines represent the significance threshold (P = 6.26 × 10⁻⁷, Bonferroni correction). d, LD block around the candidate peak within a 200-kb interval. e, Gene structure and promoter variant of AhGSA1. f, RT–qPCR analysis of AhGSA1 expression in 30 Hap1 and 30 Hap2 accessions. Quantitative data are mean ± s.e.m. n = 3 biologically independent samples. g, Box plot showing significant differences in thousand-grain weight between Hap1 (range: 342–693; n = 42) and Hap2 (range: 342–1,563.64; n = 293) accessions. Center line, median; box lower and upper edges, 25% and 75% quartiles, respectively; whiskers, 1.5× interquartile range; colored dots, outliers. h, Distribution of Hap1 and Hap2 across different groups. i, Subcellular localization of AhGSA1. j, Histochemical GUS staining driven by the Hap1 and Hap2 AhGSA1 promoters. k, Dual-luciferase assay comparing Hap1 and Hap2 promoter activities. Quantitative data are mean ± s.e.m. n = 3 biologically independent samples. P values were calculated by two-tailed Student’s t-tests (g and k).
Gene networks for lipids and anthocyanins in seed development
Peanut seeds have a high oil content, accounting for approximately 50–80% of their weight. We performed integrated transcriptomic and metabolomic analyses of S83 and S245 at five developmental stages (Fig. 7a,b and Supplementary Tables 26–30). A total of 497 lipid metabolites were identified, including 300 glycerolipids, 153 glycerophospholipids, 24 sphingolipids and 18 fatty acids (Fig. 7c and Supplementary Table 27). Clustering based on lipid content revealed that S83 consistently had higher lipid levels than S245, especially during later developmental stages (Fig. 7d). Lipid accumulation, which is critical for seed development, is regulated by complex metabolic pathways (Fig. 7e). Distinct accumulation patterns for lipid metabolism were noted in both varieties, peaking at the end of stage S5 (Fig. 7f). To identify key genes related to lipid metabolism, we conducted weighted gene coexpression network analysis (WGCNA); this identified 11 coexpressed gene modules (Supplementary Fig. 24a,b). The module most correlated with lipid metabolite content contained several key genes, including those encoding fatty acid desaturase and ketoacyl-ACP synthase, which are crucial for fatty acid biosynthesis (Supplementary Table 28). Phylogenetic analysis of these enzymes revealed evolutionary relationships that could explain their roles in lipid biosynthesis (Supplementary Fig. 25a,b). Their expression patterns matched metabolite level trends, peaking during development (Fig. 7g).
Fig. 7: Transcriptomic and metabolomic analysis during seed development.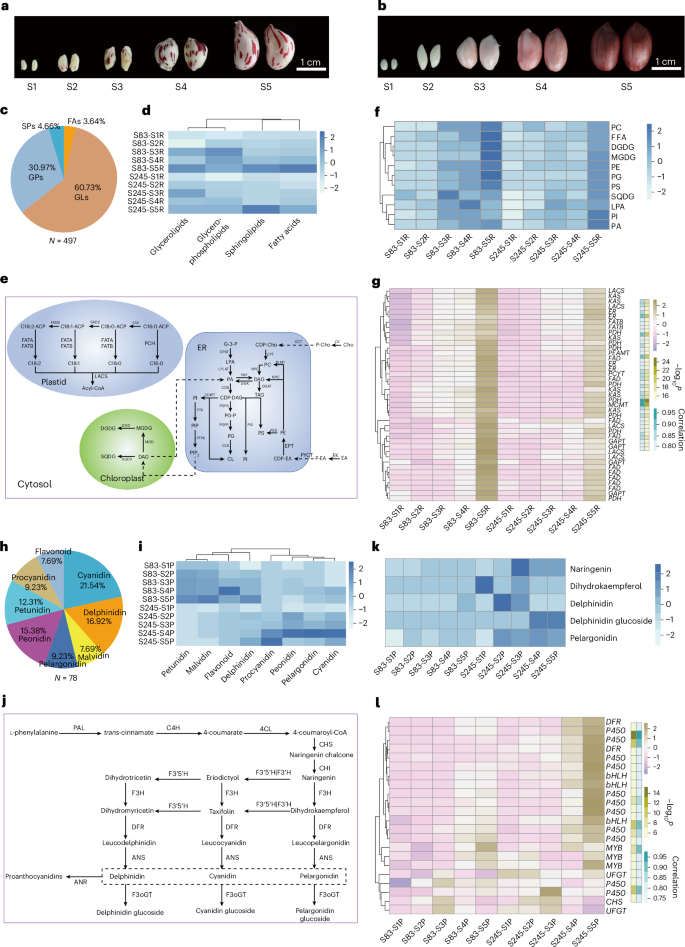 The alternative text for this image may have been generated using AI.
a,b, Seed diversity between two peanut subpopulations across five developmental stages for S83 (a) and S245 (b). c, Lipid metabolites (497) categorized into glycerolipids, glycerophospholipids, sphingolipids and fatty acids. d, Clustered heatmap of the levels of four classes of lipid in S83 and S245 across five developmental stages. e, Schematic of lipid metabolic pathways, with detected metabolites marked in bold black. f, Clustered heatmap displaying the contents of metabolites involved in the lipid metabolism pathway for S83 and S245. g, Heatmap of expression levels of candidate lipid metabolism genes; the correlation between gene expression and metabolite contents is indicated in teal, and significance is denoted by the olive gradient. h, Anthocyanidin contents of 78 metabolites with anthocyanins categorized into eight classes. i, Clustered heatmap of eight classes of anthocyanidins in S83 and S245 across five developmental stages. j, Schematic of anthocyanidin biosynthesis pathways, with detected metabolites marked in bold black. k, Clustered heatmap displaying the contents of candidate metabolites contributing to the difference in color between S83 and S245. l, Heatmap of the expression levels of candidate anthocyanidin biosynthesis genes; the correlation between gene expression and metabolite contents is indicated in teal, and significance is denoted by the olive gradient. CD, cardiolipin; CDP-DAG, cytidine diphosphate diacylglycerol; CDP-EA, cytidine diphosphoethanolamine; Cho, choline; DAG, diacylglycerol; DGDG, digalactosyldiacylglycerol; EA, ethanolamine; ER, endoplasmic reticulum; FAs, fatty acids; FFA, free fatty acids; G3P, glycerol-3-phosphate; GLs, glycerolipids; GPs, glycerophospholipids; LPA, lysophosphatidic acid; MGDG, monogalactosyldiacylglycerol; PA, phosphatidic acid; PC, phosphatidylcholine; P-Cho, phosphocholine; PE, phosphatidylethanolamine; P-EA, phosphoethanolamine; PG, phosphatidylglycerol; PG-P, phosphatidylglycerol phosphate; PI, phosphatidylinositol; PIP2, phosphatidylinositol 4,5-bisphosphate; PS, phosphatidylserine; SPs, sphingolipids; SQDG, sulfoquinovosyldiacylglycerol; TAG, triacylglycerol.
We also investigated anthocyanidin metabolism and identified 78 metabolites across eight classes (Fig. 7h and Supplementary Table 29). Clustering showed that S83 had higher concentrations of petunidin, malvidin, flavonoids and delphinidin, whereas S245 had more procyanidin, peonidin, pelargonidin and cyanidin (Fig. 7i). These metabolites could influence differences in seed coat color between S83 and S245 (Fig. 7j,k). WGCNA identified key genes with expression levels that were correlated with the abundances of differentially accumulated metabolites during seed development (Supplementary Fig. 24c,d), in particular, genes encoding the MYB and bHLH transcription factors, which are known to regulate anthocyanin biosynthesis19,41,42 (Supplementary Table 30). Phylogenetic analysis of these transcription factors, including those previously reported, provided insights into their evolutionary relationships and potential functional divergence (Supplementary Fig. 25c,d). The expression patterns of these key transcription factors were consistent with the accumulation trends of anthocyanin metabolites, implying roles in the regulation of pigment biosynthesis during seed development (Fig. 7l).
In summary, our analyses identified important genes involved in lipid and anthocyanin biosynthesis during peanut seed development. These genes may have central roles in determining oil content and seed coat color and could thus represent targets for future studies and crop improvement.