
Study cohort
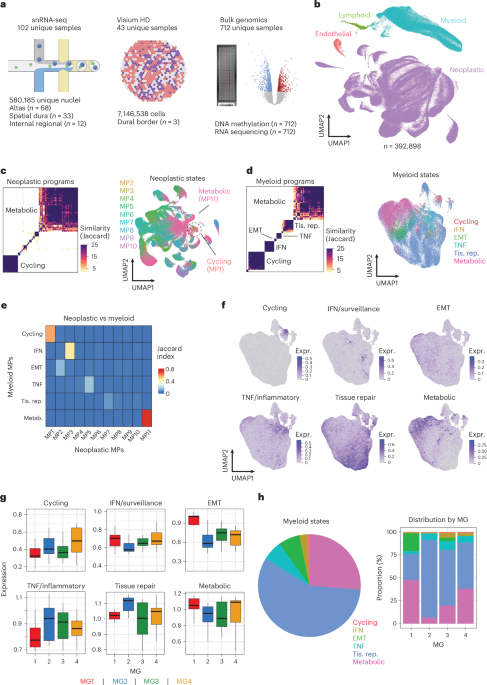
Our cohort focused on snRNA-seq (n = 102 samples and 580,185 high-quality nuclei) and spatial transcriptomics (Visium HD, n = 43 samples and 7,146,538 segmented cells). Bulk DNA methylation was used to classify cases by MG using our published model6. Paired bulk DNA methylation and RNA-seq was used to validate results from the single-cell resolution data and interrogate their influence on clinical outcomes. These bulk samples were obtained from University Health Network (Toronto), Indiana University, Case Western University, the Fred Hutchison Cancer Center, the RTOG-0539 clinical trial and publicly available datasets12,13 (n = 712; Fig. 1a). We also performed shotgun proteomics (n = 88) and plasma methylation sequencing20,21,22 (n = 59) on a subset of cases.
Fig. 1: The meningioma microenvironment exhibits considerable transcriptional diversity and can be defined by recurrent cell-type-specific metaprogams.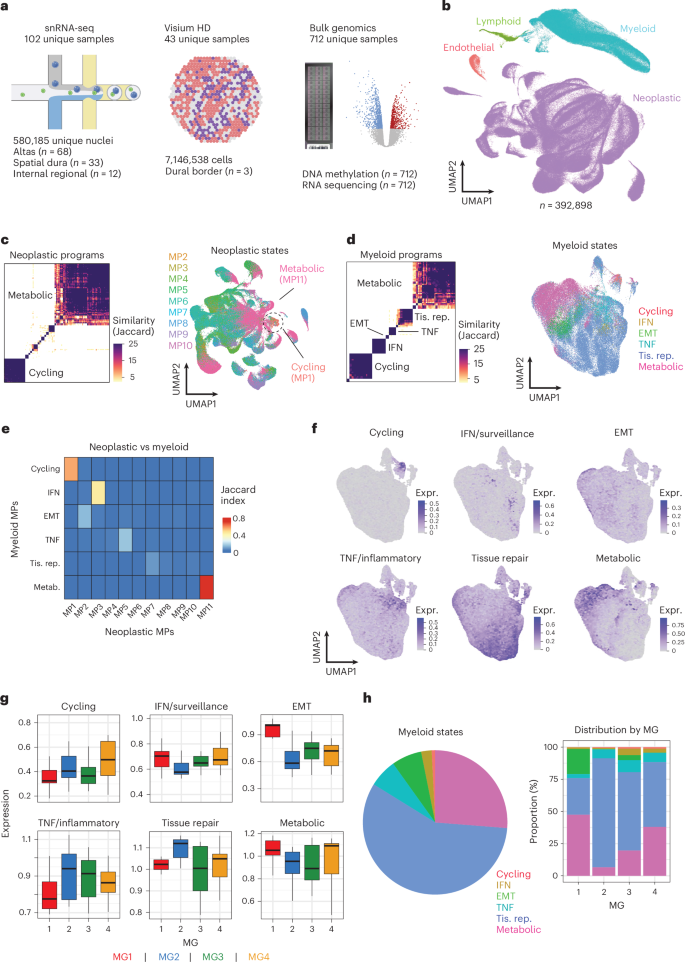 The alternative text for this image may have been generated using AI.
a, Graphical depiction of study cohort. Created in BioRender; Singh, O. https://BioRender.com/98ou2xy (2026). b, Uniform manifold approximation and projection (UMAP) representation of our ‘atlas’ cohort of 68 patients with meningioma, with color representing cell type. c, Heatmap of filtered neoplastic programs, clustered by Jaccard index (left). The two dominant MPs are labeled based on constituent overlapping genes. UMAP of neoplastic cells, with cell state assigned based on the highest expressed MP (right). The dominant MPs (cycling and metabolic) are labeled. d, Heatmap of filtered myeloid programs, clustered by Jaccard index (left). UMAP of cells, with cell state assigned based on the highest expressed MP (right). Tis. rep., tissue repair. e, Heatmap depicting similarity between myeloid (rows) and neoplastic (columns) MPs. Color is by Jaccard index of MP-defining gene lists for each comparison. f, Expression of each MP across each myeloid cell in the atlas cohort. Expr., expression. g, Pseudobulk expression of the cycling, EMT, TFN and tissue repair myeloid MPs stratified by MG (n = 11 MG1, 17 MG2, 17 MG3, 16 MG4). Boxplot center lines represent the median, with the box spanning the interquartile range (25th–75th percentile); whiskers extend to the most extreme values within 1.5 times the interquartile range from the quartiles. h, Pie chart depicting the relative proportion of each cell state across all myeloid cells in our atlas cohort (left). Stacked barplots depicting the relative proportions of each myeloid cell state stratified by MG (right).
A single-cell atlas of meningioma reveals recurrent transcriptional metaprograms
To understand the transcriptional diversity of meningioma cell populations, we first defined an ‘atlas’ cohort from our snRNA-seq data (n = 68 samples; 392,818 high-quality nuclei). Most cells were neoplastic (74.9%, n = 294,122), and myeloid cells dominated the non-neoplastic compartment (22.3% of all cells, n = 87,482). Lymphoid (1.5%, n = 5,778) and endothelial cells (n = 1.4%, 5,436) were comparatively rare (Fig. 1b and Extended Data Fig. 1). Non-negative matrix factorization (NMF) was used to identify recurrent transcriptional programs (metaprograms (MPs)) within each cell type. Among neoplastic cells, 11 MPs were identified, although only two (MP1 and MP11) were consistently shared across most samples, probably owing to known inter-individual variation of meningioma neoplastic cells4 (Fig. 1c and Supplementary Figs. 1a and 2). These highly shared MPs were defined by cell-cycle genes (cycling) and metabolic or ribosomal genes (metabolic), respectively. Other neoplastic MPs were identified only within smaller subsets of samples, suggesting considerable transcriptional diversity between neoplastic cell populations of different tumors, such that only a subset of transcriptional programs is shared across most cases. Of these rarer neoplastic MPs, some were defined by clear biological processes (interferon (IFN)-related pathways (MP3), tumor necrosis factor (TNF)-related pathways (MP5), epithelial-to-mesenchymal transition (EMT)-related pathways (MP6, MP9 and MP10) and inflammation-related pathways (MP7)). Others did not clearly map to a consistent biological function (MP2, MP4 and MP8).
Among non-neoplastic cells, seven myeloid MPs were identified. One was uniquely expressed in mast cells (representing <0.5% of myeloid cells). The remaining six were defined by (1) cell-cycle pathways (cycling); (2) IFN-related pathways (IFN/surveillance); (3) mixed pathway activation, with some specificity toward the EMT; (4) inflammatory or TNF-associated pathways (TNF/inflammatory); (5) tissue-repair-related pathways, including IL-6 and JAK–STAT (tissue repair); and (6) ribosomal and oxidative-phosphorylation-associated genes (metabolic) (Fig. 1d). Similarly, six lymphoid MPs (metabolic, cycling, IL-2, naive T cells, B cells and natural killer cells; Supplementary Fig. 1b) and four endothelial MPs (metabolic, TNF/hypoxia, complement and extracellular matrix (ECM)/EMT; Supplementary Fig. 1c) were identified. No MPs appeared to be driven by ambient RNA contamination, although one rare neoplastic MP (MP7) and one lymphoid MP (B cells) had a median ambient RNA content of >0.2 (Supplementary Fig. 3). Given that this lymphoid MP was clearly associated with a well-defined cell type, it was felt that removing cells based on inferred ambient RNA content risked removing meaningful biological signal.
We orthogonally validated these MPs using unsupervised clustering and by applying NMF to publicly available single-cell RNA cohorts of meningioma23,24,25, demonstrating an absence of meaningful new transcriptional MPs and highlighting that large cohorts are needed to identify rarer MPs such as the myeloid EMT and lymphoid B cell MPs (Supplementary Note, Supplementary Fig. 4 and Extended Data Fig. 2). We also found that the cycling state (based on highest expressed MP) was associated with the highest inferred developmental potential across cell types and that neoplastic states were generally associated with higher developmental potential than non-neoplastic states (Supplementary Note and Supplementary Fig. 5).
Comparing MPs across cell types based on shared MP-defining genes, we found the metabolic MPs to be most similar across all cell types, with the cycling MPs also similar between the myeloid, neoplastic and lymphoid cells (details in Supplemental Note). A subset of other neoplastic MPs also shared genes with myeloid MPs (IFN-like, EMT-like, TNF-like; Fig. 1e and Supplementary Fig. 1d). Similar findings were demonstrated by comparing MP expression across cell types (Supplementary Fig. 6a), wherein some MPs exhibited similar expression across cell types (that is, metabolic and cycling), while others were specific to one cell type (that is, the myeloid tissue repair MP).
Myeloid cell states are differentially enriched across existing biological classifications
Given that myeloid cells represent most non-neoplastic cells within meningioma and are not associated with the same degree of inter-tumoral heterogeneity as are neoplastic cells, we focused on further characterizing their MPs within the context of known meningioma biology (Fig. 1f). Specifically, we sought to understand whether meningioma MGs were associated with differences in not only the abundance (as previously demonstrated4), but also the transcriptional profiles of constituent myeloid cells. To do so, myeloid cell-specific gene expression was averaged across each tumor (pseudobulk data, to allow per-sample comparisons) and myeloid MPs quantified using single-sample gene set enrichment analysis (ssGSEA). The cycling MP was upregulated in proliferative cases (Wilcox P = 0.03), the EMT MP was upregulated in immunogenic cases (Wilcox P = 1.5 × 10⁻⁵), the TNF MP was downregulated in immunogenic cases (Wilcox P = 0.02) and the tissue repair MP was upregulated in NF2-wildtype cases (Wilcox P = 1.3 × 10⁻⁴) (Fig. 1g). The cycling MP also significantly increased with WHO grade (ANOVA P = 2.5 × 10⁻⁴), while the tissue repair MP was significantly upregulated in WHO grade 1 cases compared to WHO grade 2 or 3 cases (Wilcox P = 0.004; Supplementary Fig. 6b).
Comparing myeloid cell states between MGs, we found that tissue repair cells were most abundant overall (n = 50,374; 57.6%) and particularly common in MG2 (n = 20,493 out of 24,194 (84.7%), chi-squared P < 2.2 × 10⁻¹⁶ MG2 vs others). However, they were least common in MG1 (n = 7,251 out of 25,456 (29.5%), P < 2.2 × 10⁻¹⁶ MG1 vs others). Metabolic myeloid cells were next most common (n = 22,962; 26.2% overall) and were least frequent in MG2 (n = 1,585 (6.6%), P < 2.2 × 10⁻¹⁶ MG2 vs others). There were 5,890 EMT myeloid cells (6.7%) that were most common in MG1 meningiomas (4,954 out of 25,456 (19.4%), P < 2.2 × 10⁻¹⁶ MG1 vs others), whereas TNF myeloid cells were least common in MG1 (n = 792 (3.1%), P < 2.2 × 10⁻¹⁶ MG1 vs others). Cycling myeloid cells were rare overall, in keeping with prior literature26 (n = 685; 0.8%), but were enriched in MG3 and MG4 (n = 439 out of 34,539 (1.3%)) compared to MG1 and MG2 (P < 2.2 × 10⁻¹⁶) (Fig. 1h). These findings were validated with bulk deconvolution (Supplementary Note and Supplementary Fig. 7). Overall, we demonstrate that myeloid cells take on biological signatures that correlate with overall tumor biology, as reflected by MG and WHO grade, suggesting their important role within meningioma biology and potential influence on clinical outcomes.
Some myeloid MPs are consistent with myeloid gene programs from glioblastoma
To investigate whether myeloid MPs are meningioma-specific, we compared them to analogous gene programs identified in glioblastoma (GBM)16, identifying strong correlations with the cycling, IFN and TNF MPs and moderate correlations with the tissue repair and metabolic MPs; no GBM programs corresponded to the EMT MP (Supplementary Fig. 8 and Supplementary Note). This finding suggests that many myeloid transcriptional programs are conserved across GBM and meningioma to various degrees, adding additional context to our results.
Bulk proteomic analysis validates the biological correlates of myeloid MPs
We next used our bulk proteomics cohort to orthogonally validate the biology of each myeloid MP and identify candidate markers (details in Supplementary Note). Proteomic pathways largely corresponded with the RNA-based pathways associated with each MP27 (Supplementary Fig. 9). LMNB1 was found to be the best marker for the cycling myeloid MP; STAT1 for the IFN MP, NFIA for the EMT MP, SLC2A3 for the TNF MP, MRC1for the tissue repair MP and PHPT1 for the metabolic MP (Extended Data Fig. 3). Notably, specificity was imperfect, suggesting that single marker genes or proteins may not be as reliable as multi-gene signatures to identify these complex and overlapping myeloid cell states.
Some meningiomas exhibit considerable neoplastic transcriptional heterogeneity over space
Given the finding that the myeloid cells varied based on WHO grade and MG, we next sought to explore whether these myeloid MPs, in addition to neoplastic MPs, also vary across different physical regions of the same tumor. To do so, we leveraged a dedicated ‘internal regional’ cohort consisting of three regionally distinct samples from four meningiomas with snRNA-seq and bulk methylation profiling (n = 12 samples and 110,318 cells; Fig. 2a,b, Supplementary Fig. 10 and Supplementary Note).
Fig. 2: Regionally diverse sampling within the same meningiomas identifies transcriptional intra-tumoral heterogeneity but comparatively stable copy number alterations.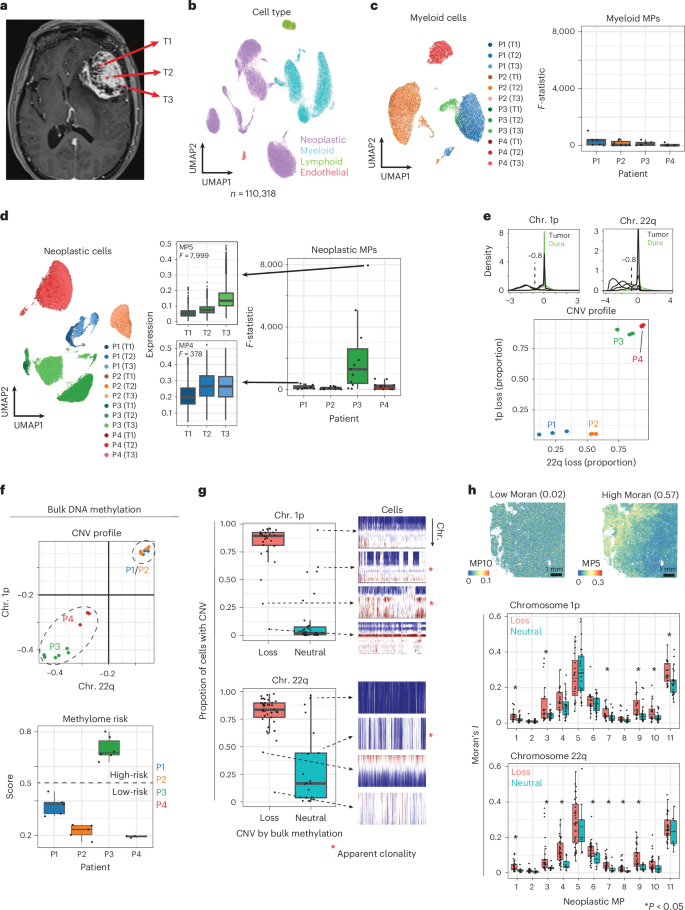 The alternative text for this image may have been generated using AI.
a, Example representative axial T1-weighted magnetic resonance imaging with gadolinium contrast of one patient in our internal regional cohort, with multiple stereotactically registered samples obtained from the same tumor. b, UMAP plot annotated by cell type. c, UMAP representation of myeloid cells in this cohort, annotated by sample of origin (left (P, patient; T, tumor)). Boxplot (and superimposed jitter plot) depicting F-statistic of myeloid MPs by patient (right, n = 6 MPs each). d, UMAP representation of neoplastic cells in this cohort, annotated by sample of origin (left). Boxplot depicting F-statistic of neoplastic MPs by patient (right, n = 11 MPs each). Example boxplots associated with the highest F-statistic in P3 (n = 1,255 cells for T1; 15,138 cells for T2; 11,717 cells for T3) and P1 (n = 2,911 cells for T1; 852 cells for T2; 1,789 cells for T3) are inset. e, Density plots of chromosome 1p and 22q deviations for all neoplastic cells from each individual patient (black lines) compared to normal dura reference (green lines), identifying −0.8 as an appropriate threshold to define a loss (top). Scatterplot depicting the proportion of cells from each sample with chromosome 1p or 22q losses based on this threshold, labeled by patient (bottom). Chr., chromosome. f, Scatterplot depicting log2(copy number variation, CNV) values for chromosome 1p and 22q from bulk DNA methylation (top) and boxplot of methylome risk scores by patient (bottom; n = 5 from P1, 5 from P2, 6 from P3, 3 from P4). g, Boxplots depicting inferred proportion of cells with chromosome 1p or 22q loss by snRNA, stratified by predicted CNV status by methylation on the full atlas cohort (n = 28 1p loss, 34 neutral; n = 61 22q loss, 21 neutral). Examples of discordance are plotted, with possible (albeit rare) cases of clonal heterogeneity highlighted (*). h, Analysis of local neoplastic transcriptomic heterogeneity using our spatial transcriptomic cohort. Example case of a meningioma with low spatial heterogeneity (indicated by low Moran’s index) in one neoplastic MP (MP10) and high spatial heterogeneity in another neoplastic MP from the same sample (MP5; top). Grouped boxplots of per-sample Moran’s indices within each neoplastic MP, stratified by the presence of a chromosome 1p loss (top boxplot; n = 20 loss, 23 neutral) or a chromosome 22q loss (bottom boxplot; n = 34 loss, 9 neutral). For all boxplots in this figure, center lines represent the median and the box spans the interquartile range (25th–75th percentile); whiskers extend to the most extreme values within 1.5 times the interquartile range beyond the quartiles.
To quantify the degree of per-sample transcriptional variance in the context of our established MPs, ANOVA was used to compare the expression of each MP between samples (Supplementary Fig. 11). The average F-statistic across all MPs (Favg) was used to represent the overall regionally driven transcriptional variation for a particular tumor. Differences in Favg among myeloid cells were not statistically significant (Fig. 2c), but among the neoplastic cells, one sample (P3) was associated with significantly higher heterogeneity than the others (Fig. 2d and Supplementary Note). These findings, although limited to a cohort of four meningiomas, suggest that neoplastic cells may exhibit considerable transcriptional variation across different regions, whereas myeloid populations do not appear to exhibit the same degree of regional heterogeneity.
Neoplastic chromosome 1p and 22q losses are largely stable across whole meningiomas
The identification of regional neoplastic heterogeneity in some meningioma samples could suggest spatial differences in chromosomal copy number alterations, which could have important implications if used as biomarkers. Specifically, this would indicate a need for multi-regional sampling in the clinical setting, which is not currently done. Given their increasingly established role as meningioma biomarkers, we compared the proportion of neoplastic cells with chromosome 22q and 1p losses over distinct regions7,9. Reassuringly, we found similar proportions among samples from the same patient, and importantly, all samples from P3 (associated with marked transcriptional heterogeneity) had similar proportions of chromosome 1p loss (0.90, 0.86, 0.87) and chromosome 22q loss (0.74, 0.84, 0.86). Similar patterns were also observed for the other tumors (Fig. 2e). This observation demonstrates that although some meningiomas have the potential to exhibit considerable neoplastic transcriptional heterogeneity over space, chromosome 22q and 1p losses appear to remain comparatively stable. Follow-up confirmation with large, multi-institutional cohorts will be needed to confirm this finding.
Bulk methylation validates the regional consistency in meningioma biomarkers
The regional stability of meningioma biomarkers was validated with bulk DNA methylation on 19 samples from the ‘internal regional’ cohort tumors (including all 12 with snRNA-seq). Chromosome 1p and 22q arm-level copy number values were highly stable within the same tumor, as were methylation-inferred outcome risk scores28,29 (Fig. 2f and Supplementary Note). Other chromosome arm gains or losses were also similar between snRNA-seq and methylation (Extended Data Fig. 4) and generally consistent within a particular meningioma (Extended Data Fig. 5 and Supplementary Note). This reinforces the observation that genomic biomarkers remain largely stable across meningiomas despite the observed neoplastic heterogeneity in some cases, supporting the notion that a single tissue sample is probably sufficient for clinical purposes. Nevertheless, it is noteworthy that within our atlas cohort, three cases that were discordant between snRNA-seq and methylation-defined chromosome 22/1p losses appeared to have possible evidence of internal heterogeneity in chromosome 1p (n = 2) or chromosome 22q (n = 1) status within the same tumor (Fig. 2g and Supplementary Note), suggesting a need for larger regionally sampled cohorts to more definitively explore the potential for rare copy number heterogeneity in meningioma.
Chromosome 22q and 1p loss incurs greater spatial neoplastic heterogeneity
Given that some meningiomas exhibited considerable regionally driven neoplastic transcriptional heterogeneity despite comparatively stable copy number alterations, we next leveraged spatial transcriptomics to further explore this spatial heterogeneity locally. For each sample (n = 43), Moran’s index (a measure of spatial autocorrelation) was used to represent the spatial heterogeneity of each neoplastic MP. The MP5 (TNF-like) MP was associated with the highest median Moran’s index overall (0.27; range, 0.07–0.58), suggesting that it is an important correlate of regional neoplastic heterogeneity. This was also the MP with the highest neoplastic F-statistic in P3 (internal regional cohort). Interestingly, we found that tumors with methylation-defined chromosome 1p and 22q losses were associated with higher Moran’s indices in multiple neoplastic MPs. Specifically, the presence of chromosome 22q loss was associated with higher Moran’s index for MP1 (cycling), MP3 (IFN-like), MP4, MP6 (EMT1), MP7 (inflammatory), MP8 and MP9 (EMT2; P < 0.05 for all cases, comparing 22q loss vs 22q neutral). Similarly, the presence of chromosome 1p loss was associated with higher Moran’s index for MP1 (cycling), MP3 (IFN-like), MP7 (inflammatory), MP9 (EMT2), MP10 (EMT3) and MP11 (metabolic; P < 0.05; Fig. 2h). This finding suggests that the presence of these alterations is correlated with increased regional neoplastic transcriptional heterogeneity, which may, in part, help explain the comparatively poor outcomes and treatment resistance exhibited by tumors with these alterations.
Spatially informed sampling provides insight into the immune reprogramming of meningioma
We next sought to understand how meningioma cell states may vary between the tumor itself and its surrounding non-tumor-associated tissue. Although roughly 10% of meningiomas invade underlying brain tissue30,31, almost all are physically connected to dura32. We therefore sought to study this dural attachment to gain insights into a possible source of tumor recurrence after surgery. To do so, we procured a ‘spatial dura’ snRNA-seq cohort, comprising one tumor sample and multiple surrounding dural samples per patient (Fig. 3a). In total, 156,480 cells from 33 samples were generated, partially overlapping with the atlas cohort (Fig. 3b). We also compared our results to normal-appearing dura samples collected from two patients with GBM, in which no dural attachment was present (n = 6,893 additional cells). Neoplastic cells were most common in the tumor and overlying dura, representing 44.5% and 53.5% of cells, respectively, decreasing to 6.0% of cells in the peripheral or marginal dura and <1% in both the 1 cm and 2 cm dural margins (chi-squared P < 2.2 × 10⁻²²). By comparison, fibroblasts and endothelial cells were more common in the normal-appearing dura, representing 76.2% and 19.8% of cells in the 2 cm dura, respectively. Importantly, myeloid cells accounted for <5% of cells from the adjacent and overlying dura samples (4.5% in overlying dura, 3.4% in peripheral dura, 3.3% in 1 cm dura and 2.7% in 2 cm dura; Fig. 3c) but accounted for 42.7% of cells in the tumor samples. This expansion of the myeloid cell population in tumors suggests a potential role of myeloid cell recruitment in the pathogenesis or maintenance of meningioma.
Fig. 3: Spatially resolved snRNA-seq and spatial transcriptomics reveals increased myeloid abundance and shifts in myeloid MP expression from dura to tumor.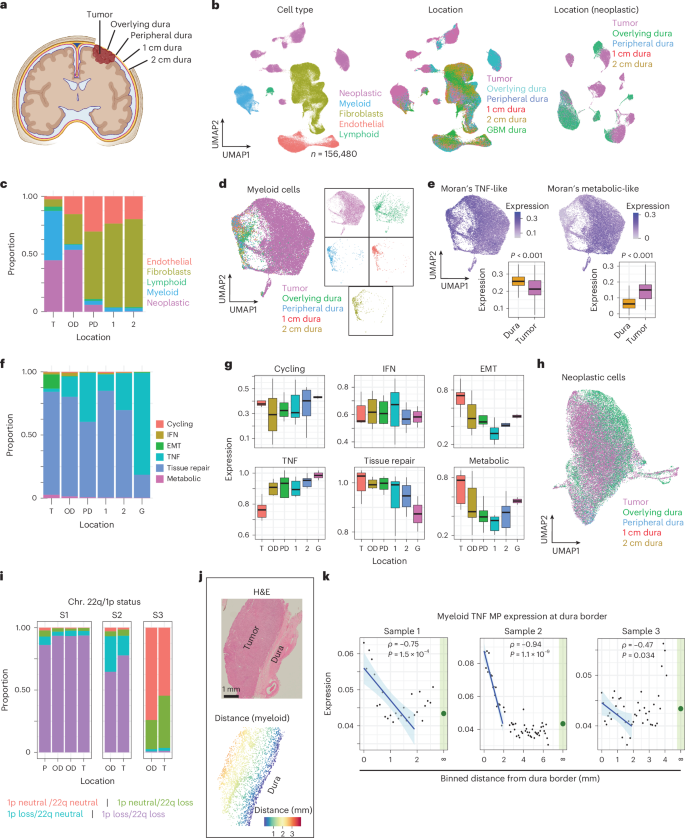 The alternative text for this image may have been generated using AI.
a, Graphical depiction of the sampling approach taken in our ‘spatial dura’ cohort. Created in BioRender; Singh, O. https://BioRender.com/ktepotx (2026). b, UMAP representation of this cohort, with each cell annotated based on type (left) and region of collection (right). GBM dura, normal-appearing dura collected from two patients with glioblastoma. c, Relative proportion of cell types by location of sample collection (T, tumor; OD, overlying dura; PD, peripheral dura; 1, 1 cm dura; 2, 2 cm dura). d, Patient-wise batch-corrected UMAP of all myeloid cells in our spatial dura cohort, with cells annotated by sample location. Individual location-specific UMAPs are plotted for clarity (right). e, Expression of a TNF-like program and a metabolic-like program, identified based on clustering of genes with Moran’s q < 0.001. Note the former is predominantly expressed among the non-tumor-derived cells, whereas the reverse is true of the latter (inset boxplots; n = 3,780 dura cells; 21,219 tumor cells; two-sided t-test P < 2.2×10⁻¹⁶ for both plots). f, Relative presence of myeloid cell states by sample location. G, glioblastoma control. g, Relative expression of myeloid MPs by sample location (pseudobulk; n = 7 T, 7 OD, 4 PD, 7 1 cm, 6 2 cm, 2 G). h, Patient-wise batch-corrected UMAP of all neoplastic cells in our spatial dura cohort, with cells annotated by sample location. i, Stacked barplots for each sample with at least 50 neoplastic cells in at least one dura sample, depicting the relative proportion of cells with each permutation of chromosome 22q and 1p neutral or loss. j, Representative H&E slide of a sample with a preserved meningioma-tumor border, profiled with Visium HD (top). Annotation of each myeloid cell by its distance to the segmented dural border on the same sample (bottom). This same analysis was performed on three total slides with an intact tumor–dura border. k, Scatterplots comparing the expression of the TNF myeloid MP as a function of median binned distance from the dural border, for each of the three samples with a preserved tumor–dura border. Fitted linear regression lines and Pearson correlation values for the first 2 mm are presented, with the shaded area corresponding to the 95% confidence interval of the regression line; two-sided P values are shown. The median expression across all myeloid cells in cases without a dural border present is indicated by the large green dot. For all boxplots, center lines represent the median and the box spans the interquartile range (25th–75th percentile); whiskers extend to the most extreme values within 1.5 times the interquartile range beyond the quartiles.
We next sought to explore whether this marked difference in myeloid cell abundance between dura and tumor was associated with differences in transcriptional MPs. We first performed unsupervised clustering of all myeloid cells in the ‘spatial dura’ cohort after patient-wise batch correction to remove inter-individual variations. Strikingly, we identified a clear separation between myeloid cells obtained from tumor and those sampled from overlying or adjacent dura (Fig. 3d). Two dominant gene programs were identified: one associated with TNF pathway-related genes (upregulated in dura-derived myeloid cells) and the other associated with genes related to metabolism (upregulated in the tumor-derived myeloid cells; Fig. 3e). Within our established myeloid cell states, we also found that TNF myeloid cells were most common in dura samples from patients with GBM, representing 80.7% of myeloid cells in these samples compared to only 2.6% of myeloid cells from meningioma tumors and 12.3–39.2% of myeloid cells from underlying or adjacent dura samples. Contrarily, metabolic myeloid cells were most common within tumors, representing 2.6% of myeloid cells compared to <1% in all dura samples. Similarly, the EMT state represented 11.3% of tumor-associated myeloid cells, but <1% of myeloid cells in all dura-derived samples (Fig. 3f). Pseudobulk analysis, allowing for sample-level comparisons, yielded similar findings, with the EMT and metabolic MP significantly upregulated in tumor compared to dura samples (P < 0.001 and P = 0.005, respectively), while the TNF MP was strongly suppressed in tumor (P = 0.002) (Fig. 3g). Interestingly, this clear difference in MP expression between tumor and dura-derived myeloid cells was not observed in other cell types, suggesting a particular role for myeloid reprogramming in meningioma pathogenesis (Fig. 3h, Supplementary Fig. 12a and Supplementary Note).
The myeloid TNF MP is suppressed across the dura–tumor interface
Given the observed differences in myeloid states between meningioma and dura by snRNA-seq, we next leveraged our spatial transcriptomics cohort to explore the transcriptional evolution of myeloid MPs across the meningioma–dura border itself, which was present in three Visium HD samples (Supplementary Fig. 12b). Computing average myeloid MP expression at each 100 µm bin from the dural border (Fig. 3j), we found that the TNF MP was consistently negatively correlated with distance over the first 2 mm from the dural border (Fig. 3k and Supplementary Note). This indicates that the TNF MP is suppressed over very short physical distances within the meningioma tumor compared to its surrounding dura, suggesting the importance of downregulating this myeloid MP for meningioma development and progression.
Myeloid–neoplastic interactions are state-specific and influence the tumor microenvironment
Given the observation that myeloid cells found in meningioma tumors are distinct from those found in the surrounding dura and that they also differ according to tumor biology and aggressiveness (MG and WHO grade), we reasoned that myeloid cells have a role in meningioma progression through state-specific myeloid–neoplastic interactions, as has been shown in other brain tumors16,17,18. Indeed, we used CellChat33 to infer multiple myeloid (ligand)–neoplastic (receptor) interactions that were specific to each myeloid state, including multiple that have previously been associated with cancer progression and/or the establishment of a pro-tumoral microenvironment, suggesting a potential targetable role for myeloid cells in meningioma progression34,35,36,37,38,39,40,41,42,43,44,45 (Fig. 4a,b and Supplementary Note).
Fig. 4: Each myeloid cell state is associated with unique neoplastic–myeloid interactions and spatial dependencies.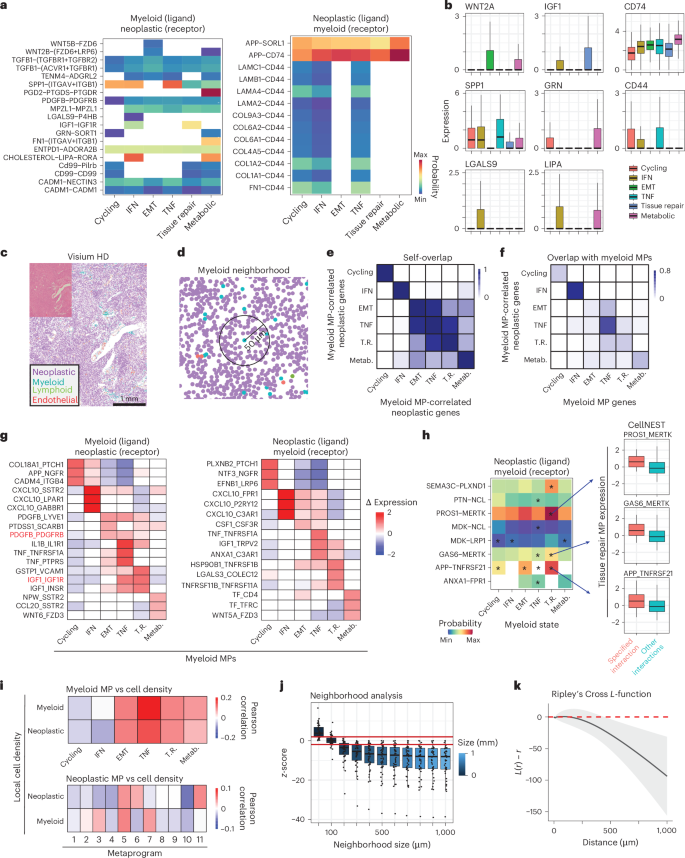 The alternative text for this image may have been generated using AI.
a, Myeloid state-specific receptor–ligand interactions with neoplastic cells overall. The left tileplot depicts interactions in which myeloid cells express ligands and neoplastic cells express receptors, and the right tileplot depicts interactions in which neoplastic cells express ligands and myeloid cells express receptors. Only interactions with P < 0.01 (one-sided permutation test as implemented in CellChat) are shown. Interaction strength is proportional to tile color. b, Myeloid state-specific expression of various ligands and receptors identified using CellChat (n = 685 cells MP1; 2,062 MP2; 5,890 MP3; 5,509 MP4; 50,374 MP5; 22,962 MP6). c, Graphic depicting cell type assignments within a single Visium HD slide (inset H&E image; single example from 43 similar samples). d, Graphic illustration demonstrating the principle of myeloid neighborhood analysis, whereby the expression of all neoplastic cells within 50 μm of a particular myeloid cell is averaged (repeated on all 43 Visium HD samples). e, Symmetric heatmap depicting the degree of overlap (overlap coefficient) between myeloid MP-correlated neoplastic genes. f, Heatmap depicting the overlap coefficient between myeloid MP-correlated neoplastic genes and myeloid MP-defining genes. g, Heatmaps depicting the top three myeloid state-specific receptor–ligand interactions between myeloid and neoplastic cells based on the greatest associated change in myeloid MP expression compared to baseline of all interactions present in at least 50 myeloid–neoplastic pairs. Only values with adjusted P < 0.05 (two-sided Wilcoxon-rank sum test adjusted using the Benjamini–Hochberg method). Two interactions from the left heatmap (myeloid ligands to neoplastic receptors) are also present in the snRNA-seq (CellChat) data and are highlighted in red. h, CellChat output interactions (P < 0.01 by one-sided permutation test) that overlap with significant outputs from the CellNEST output (neoplastic ligands and myeloid receptors). Example cases of myeloid MP expression stratified by the presence of these interactions are plotted to the right (n = 58 cells with PROS1_MERTK vs 185,228 without; 71 with GAS6_MERK vs 185,215 without; 378 with APP_TNFRSF21 vs 184,908 without). Asterisks (*) indicate interactions that are also upregulated in the CellNEST analysis (adjusted P < 0.05, analogous to the values presented in g). i, Heatmap depicting the Pearson correlation coefficient between myeloid MP expression and local myeloid and neoplastic cell density (top), calculated using a 2D density kernel estimation. Analogous correlation matrix of neoplastic MPs (bottom). j, Boxplot depicting average CRAWDAD z-scores (generated by binomial proportion testing comparing observed neighborhoods to shuffled null backgrounds) across all samples with myeloid cells as reference and neoplastic cells as targets (n = 43 samples per distance). Horizontal red lines are plotted at z = ± 1.96, indicating statistical significance. k, Output of the Ripley’s inhomogeneous L-function from myeloid to neoplastic cells relative to distance (r). The line represents the mean value at all distances; the shaded area represents one standard deviation. For all boxplots in this figure, center lines represent the median and the box spans the interquartile range (25th–75th percentile); whiskers extend to the most extreme values within 1.5 times the interquartile range beyond the quartiles.
The cell state-specificity of myeloid–neoplastic interactions was further explored with spatial transcriptomics to assess whether myeloid states may induce unique transcriptional changes in surrounding neoplastic cells, or vice versa (Fig. 4c). For each myeloid cell in our cohort (n = 603,414), the expression of its MPs was correlated to the average value of all genes from all neoplastic cells within a neighborhood of radius 50 µm (Fig. 4d and Supplementary Note). Neoplastic genes that correlated with a particular local myeloid MP were termed ‘MP-correlated genes’. Interestingly, we found that cycling, IFN/surveillance and metabolic MP-correlated genes were largely unique, whereas considerable overlap was identified between the EMT, TNF and tissue repair MP-correlated genes; there were also some shared genes with the metabolic program (Fig. 4e and Supplementary Note). This uniqueness of neoplastic gene expression profiles as a function of their nearby myeloid cell states reinforces the presence of state-specific myeloid–neoplastic interactions.
To further explore the function of these neoplastic MP-correlated genes, we compared them to the genes that define each myeloid MP. Surprisingly, we found that many neoplastic genes that correlated to the IFN and TNF myeloid MPs were the same as those that actually defined the myeloid IFN and TNF MPs (0.68 and 0.57 overlap indices, respectively), with lesser overlap also identified in analogous comparisons for the cycling MP (0.17), the tissue repair MP (0.16) and the metabolic MP (0.21) (Fig. 4f). This observation suggests that myeloid cells not only influence nearby neoplastic cells to exhibit unique expression profiles, but that these expression profiles resemble the expression profile of the myeloid cells themselves. Similar patterns were observed when repeating this analysis with 25 µm and 100 µm neighborhood sizes (Supplementary Fig. 13a).
Finally, we used the deep-learning-based spatial transcriptomics tool CellNEST46 to identify recurrent and spatially informed receptor–ligand interactions between myeloid and neoplastic populations. Notably, the most state-specific interactions strongly aligned with the expected biology of each cell state (Fig. 4g and Supplementary Note). Comparing inferred receptor–ligand interactions from CellNEST to those inferred from snRNA-seq, the IGF1 (myeloid)–IGF1R (neoplastic) interaction was strongly associated with the tissue repair MP in both data types, reinforcing its relevance to this myeloid state (Fig. 4a,g). Multiple interactions involving myeloid receptors were also present in both data types, most commonly involving the tissue repair MP, including two involving the MERTK receptor (Fig. 4h and Supplementary Note).
Interestingly, we also found that myeloid and neoplastic MP expression correlated with both myeloid and neoplastic cell density (Fig. 4i). Specifically, local density of both cell types correlated most strongly with the myeloid TNF MP, with weak positive associations also noted with the EMT, tissue repair and metabolic MPs. Taken together, these findings demonstrate that myeloid cells have an important role in shaping the meningioma microenvironment, which may explain the observed tumor-specific differences in myeloid recruitment and activation.
Spatial transcriptomics reveals global spatial dependencies between cell types
We next explored global spatial dependencies within the meningioma microenvironment (see Supplementary Note for details). We found that neoplastic cells clustered around myeloid cells at small scales but dispersed over large scales (Fig. 4j,k). Analysis of lymphoid and endothelial cells further suggested the presence of ‘immune-active’ regions involving all non-neoplastic cells as well as ‘neoplastic-rich’ areas with comparatively few non-neoplastic cells (Supplementary Fig. 13b). Notably, the cell density analysis (Fig. 4i) identified two neoplastic MPs correlated with neoplastic, but not myeloid, cell density (MP6 (EMT1) and MP11 (metabolic)), suggesting that they are preferentially enriched in the neoplastic-rich regions. This finding provides insight into global patterns of meningioma organization, suggesting that the influence of myeloid cells on neoplastic cells may be largely relegated to so-called ‘immune-active’ regions.
Meningioma cell states are prognostic, independent of MG and cell abundance
Having demonstrated differences in myeloid states between meningioma MGs and WHO grade, as well as state-dependent myeloid–neoplastic interactions, we sought to directly explore the role of myeloid cells on meningioma progression. Myeloid-specific expression was deconvolved from our bulk RNA cohort and per-sample MPs quantified using ssGSEA. The cycling and metabolic MPs were both associated with shorter progression-free survival (PFS) in a multivariable Cox regression analysis after adjusting for MG (hazard ratio (HR), 4.04 (1.27–12.86), P = 0.018 and 194.84 (10.90–3,485.34), P = 3.4 × 10⁻⁴, respectively). By contrast, the EMT and tissue repair MPs were protective in analogous models (HR, 0 (0–0.13), P = 0.005 and 0.12 (0.01–1.0), P = 0.05; Supplementary Fig. 14a and Fig. 5a). Dichotomizing all cases by median MP expression, the cycling MP identified high-risk and low-risk cases within both WHO grade 2 and 3 cases that were associated significantly different median PFS (4.38 (95% CI, 3.22–6.80) vs 9.87 (6.11–infinity) years, P = 0.012 and 2.9 (2.05–4.84) vs 7.2 (3.81–infinity) years, P = 0.050, respectively). The EMT MP also significantly stratified WHO grade 2 cases (median PFS 4.43 (3.08–6.56) vs 8.35 (6.66–infinity) years, P = 0.010; Fig. 5b). The neoplastic and lymphoid metabolic MPs were also independently associated with shorter PFS, as was the lymphoid cycling MP (Supplementary Fig. 14b,c). Importantly, each of these MPs remained significantly prognostic when adjusting for the inferred proportion of their respective cell type (P < 0.05 for all cases), whereas none of the cell type abundances themselves were prognostic after adjusting for MG. Moreover, using a small cohort of 59 patients, we demonstrated as a proof of principle that robust signatures for each prognostic myeloid MP could be generated from plasma methylation (Extended Data Fig. 6) and that the plasma-inferred cycling myeloid MP remained prognostic (Fig. 5c), suggesting potential utility for such non-invasive biomarkers (details in Supplementary Note). We conclude that the meningioma microenvironment is a diverse ecosystem with major influence from myeloid cells, whose activation states are deeply associated with meningioma behavior at a clinical level.
Fig. 5: Multiple cell states are prognostic and can be used to refine outcome prediction beyond existing molecular tools.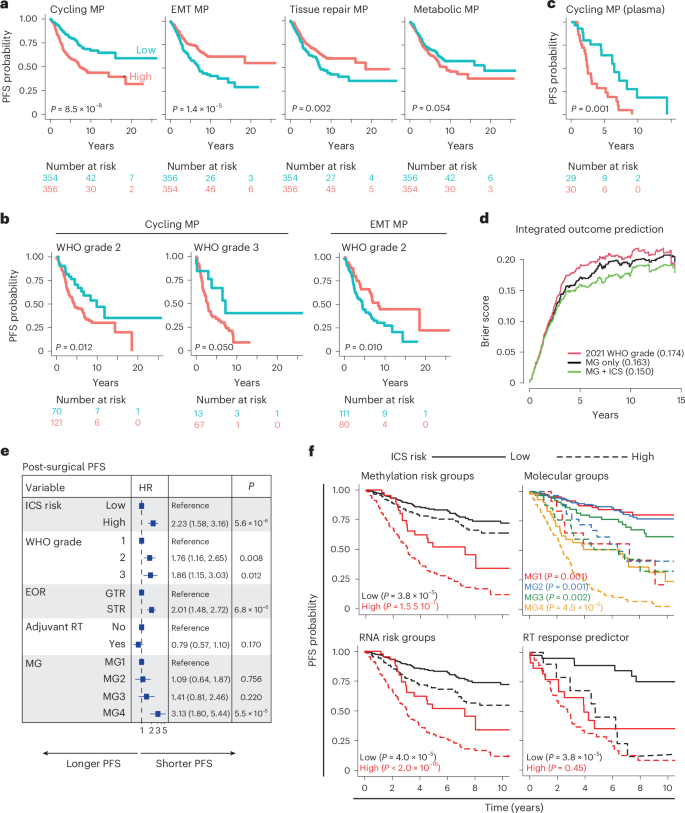 The alternative text for this image may have been generated using AI.
a, Kaplan–Meier curves depicting progression-free survival outcomes of patients when stratified by the median expression of multiple myeloid MPs. b, Kaplan–Meier curves depicting progression-free survival outcomes of a subset of patients from a, stratified by WHO grade. c, Kaplan–Meier curve depicting outcomes stratified by the median plasma methylation signature of the cycling myeloid MP. d, Brier curves comparing outcome prediction error based on WHO grade alone, MG alone and the integration of MG and seven prognostic MPs. e, Forrest plot depicting outputs of a multivariable Cox regression model with post-surgical PFS as the target variable and ICS risk group, WHO grade, extent of resection (EOR), receipt of adjuvant radiotherapy (RT) and MG as regressors. P values were generated from the Wald test (two-sided). f, Kaplan–Meier curves depicting the added outcome granularity provided by the ICS risk groups in the context of existing bulk molecular classification tools. Each subgroup is further stratified by ICS risk, with dotted lines representing high risk and solid lines representing low risk. Notably, the Kaplan–Meier on the bottom right includes only cases that underwent adjuvant RT, with outcome representing time to recurrent post RT (n = 122). Two-sided log-rank P values are presented in a, b, c and f.
Integrating meningioma cell states can refine outcome predictions in addition to existing MGs
We next sought to integrate individually prognostic MPs to refine the existing outcome prediction afforded by WHO grade or MG. An elastic net regularized Cox model identified seven MPs (myeloid EMT, TNF, tissue repair and metabolic; neoplastic inflammatory; and lymphoid cycling and metabolic) and MG as prognostic features. Adding these variables to Cox regression models resulted in improved Brier error compared to analogous models based on MG or WHO grade alone (Fig. 5d). Finally, we developed an integrated cell state (ICS) score by computing a weighted sum of the above seven MPs with their respective Cox model coefficients, which was then dichotomized into ICS risk groups (high vs low). These groups were strongly prognostic after adjusting for WHO grade, extent of resection, receipt of adjuvant radiotherapy and MG (HR, 2.23 (95% CI, 1.58–3.16), P = 5.6 × 10⁻⁶; Fig. 5e). They also added considerable granularity to outcome predictions afforded by existing molecular outcome prediction models (methylation risk groups, MGs and RNA-defined risk groups) generated using bulk data (log-rank P < 0.05 for ICS-high vs ICS-low within each subgroup; Fig. 5f). Examining only the subset of cases that received adjuvant radiotherapy (n = 122), we found that the ICS risk groups identified a subset of predicted radiotherapy-sensitive cases (based on our previously published model8) that were associated with poor outcomes (log-rank P < 0.001 ICS-low vs ICS-high), suggesting a role in radiotherapy response prediction (Fig. 5f). Overall, this observation suggests that the cell state composition of the meningioma microenvironment, inferable with bulk RNA-seq, imparts strong influence on tumor progression, allowing for increasingly refined outcome prediction in addition to what is achieved by modern MGs of meningioma alone.