
Animals
All mice were maintained according to the National Institutes of Health guidelines and all procedures used in this study were approved by the University of California, San Francisco Institutional Animal Care and Use Committee. Mice were housed under a 12-h light/12-h dark cycle at 22–25 °C and 50–60% humidity, with food and water provided ad libitum. Mice were randomly assigned to the experimental groups at the time of injection, and both male and female mice were used. In accordance with approved protocol, mice were monitored postinjection, and if signs of distress appeared, they were documented and killed promptly. The mice used in this study are LSL-dCas9-KRAB (LSL-CRISPRi) mice (B6;129S6-Gt(ROSA)26Sortm2(CAG-cas9*/ZNF10*)Gers/J, RRID: IMSR_JAX:033066)17 and dCas9-KRAB mice (B6.Cg-Igs2tm1(CAG-mCherry,-cas9/ZNF10*)Mtm/J, RRID: IMSR_JAX:030000). A summary of the individual mice used for CRISPR screening and select in vivo experiments is provided in Supplementary Table 1.
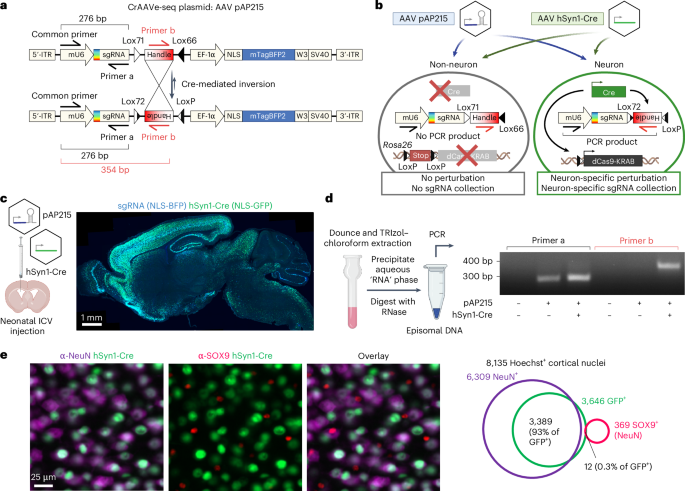
Plasmids
The screening vector pAP215 is shown in Fig. 1a (a fully annotated map is available on Addgene plasmid 217635). Details on cloning pAP215 are provided in Supplementary Protocols. Additional plasmids in this study include pENN.AAV.hSyn.HI.eGFP-Cre.WPRE.SV40 (Addgene, 105540; a gift from J. M. Wilson, University of Pennsylvania), pENN.AAV.CamKII.HI.GFP-Cre.WPRE.SV40 (Addgene, 105551; a gift from J. M. Wilson), CN1851-rAAV-hI56i-minBglobin-iCre-4X2C-WPRE3-BGHpA (Addgene, 164450; a gift from J. Ting, The Allen Institute for Brain Science; ref. 27) and pAAV-FLEX-GFP (Addgene plasmid 28304; a gift from E. Boyden, Massachusetts Institute of Technology). The NLS-mScarlet and NLS-mNeonGreen AAV plasmids were generated by restriction cloning, replacing the GFP sequence in plasmid CAG-NLS-GFP (Addgene, 104061; a gift from V. Gradinaru, California Institute of Technology)18 and replacing the NLS sequence with one from the pMK1334 plasmid1.
sgRNA cloning
We transferred the sgRNA sequences from our pooled mCRISPRi-v2 sgRNAs, subpools M1-top 5 (targeting kinases, phosphatases and drug targets) and M3-top 5 (targeting the proteostasis network)22 into the pAP215 plasmid backbone to create the pAP215-M1 and pAP215-M3 sgRNA libraries, respectively. The mouse chaperone targeting library was designed by selecting the mouse orthologs of a human chaperone targeting library that we previously developed31 and included 350 nontargeting control sgRNAs. Oligonucleotide pools were synthesized by Agilent, amplified by PCR, and cloned into the pAP215 backbone. Steps for library cloning are detailed in Supplementary Protocols.
Individual sgRNAs were cloned into the pAP215 backbone, digested with BstXI and Bpu1102I using annealed oligonucleotides (Integrated DNA Technologies) with compatible overhangs. The protospacer sequences for the specific sgRNAs used in this study include sgCreb1 (GGCTGCGGCTCCTCAGTCGG), sgHspa5 (GAACACTGACCTGGACACTT’), sgRabggta (GCGGCGAACTCACCTGCTCA) and a nontargeting control (sgNTC; GGATGCATAGATGAACGGATG).
AAV packaging, purification and titering
To generate AAV for in vivo injections, two 15-cm dishes were each seeded with 1.5 × 10⁷ HEK293T cells (ATCC, CRL-3216) in 25 ml DMEM complete medium—DMEM (Gibco, 11965-092) supplemented with 10% FBS (VWR, 89510; lot, 184B19), 1% penicillin–streptomycin (Gibco, 15140122) and 1% GlutaMAX (Gibco, 35050061). The next day, 20 µg of pAdDeltaF6 (Addgene, 112867; a gift from J. M. Wilson), 7 µg of library plasmid, 7 µg of pUCmini-iCAP-PHP.eB (Addgene, 103005; a gift from V. Gradinaru)18 and 75 µl of 1 mg ml−1 polyethenylamine (PEI; Linear, MW 25,000, Polysciences, 23966) were diluted into 4 ml of Opti-MEM (Gibco, 31985062), gently mixed, and incubated at room temperature for 10 min. The PEI/DNA transfection complex was then pipetted dropwise onto the HEK293T cells. After 24 h, the media was replaced with 27 ml of fresh Opti-MEM.
Seventy-two hours after transfection, AAV precipitation was performed as previously described32, with modifications. Cold 5× AAV precipitation solution (40% polyethylene glycol (Sigma-Aldrich, 89510) and 2.5 M NaCl) was prepared. The cells and media were triturated and collected (~30 ml) into a 50 ml conical tube, followed by the addition of 3 ml chloroform and vortexing for approximately 30 s. The homogenate was centrifuged at 3,000g for 5 min at room temperature, and the aqueous (top) phase was transferred to a new 50 ml conical tube and 5× AAV precipitation solution was added to a final 1× concentration, followed by incubation on ice for at least 1 h. The solution was centrifuged at 3,000g for 30 min at 4 °C. The supernatant was completely removed and the viral pellet was resuspended in 1 ml of 50 mM HEPES and 3 mM MgCl2, and incubated with 1 µl DNase I (New England Biolabs, M0303S) and 10 µl RNase A (Thermo Fisher Scientific, EN0531) at 37 °C for 15 min. An equal volume of chloroform was added, followed by vortexing for 15 s, and centrifuged at 16,000g for 5 min at room temperature; this step was repeated once. Using 400 µl at a time, the aqueous phase was passed through a 0.5-ml Amicon Ultra Centrifugal Filter with a 100 kDa cutoff (Millipore, UFC510024) via 3 min of centrifugation at 14,000g, followed by buffer exchange twice with 1× DPBS. Titering was performed by quantitative RT–PCR as previously described33 using primers (Integrated DNA Technologies) listed in Supplementary Table 4. This method of AAV production is available as a companion protocol in ref. 34.
To prepare AAV for testing in primary neuronal cultures (for longitudinal imaging and qRT–PCR), HEK293T cells were seeded into a 6-well plate containing 1.5 ml of complete DMEM medium. The cells were transfected with 1 µg of pAdDeltaF6, 350 ng of pUCmini-iCAP-PHP.eB and 350 ng of the AAV transgene using PEI as described above. Approximately 48 h after transfection, the cells and media were collected in a 2-ml microfuge tube, 200 µl of chloroform was added to each tube, vortexed for 15 s, and centrifuged at 16,000g for 5 min at room temperature. The aqueous (top) phase was transferred to a new tube and AAV precipitation solution was added to 1× dilution, and incubated on ice for at least 1 h. The precipitated AAV was centrifuged at 16,000g for 15 min at 4 °C. The supernatant was removed, the pellet was resuspended in 100 µl of 1× PBS and centrifuged again at 16,000g for 1 min to remove excess debris. The supernatant (purified virus) was transferred to a new microfuge tube. Ten microlitres of purified virus were used per well in primary neuronal cultures in a 24-well plate.
ICV injection
ICV injections were performed as previously described, with minor modifications35. Briefly, neonatal mice were placed on a gauze-covered frozen cold pack and monitored for complete cryoanesthesia. The scalp was gently cleaned with an alcohol swab. AAVs were diluted in 1× PBS with 0.1% trypan blue into a 2 µl final volume per mouse and loaded into a 10-µl syringe (Hamilton, 1701). The syringe was equipped with a 33-gauge beveled needle (Hamilton, 7803-05; 0.5 inches in length). The needle was inserted through the skull at a point two-fifths of the distance from the lambda suture to the eye, to a depth of 3 mm, to target the left lateral ventricle. Following a one-time unilateral injection, the neonate was placed on a warming pad for recovery and returned to the parent cage. The number of viral particles injected in each mouse is listed in Supplementary Table 1.
sgRNA recovery and sequencing for CrAAVe-seq
Animals were killed using CO2, and their whole brains were removed and stored at −80 °C. The sex of the mice was recorded before killing.
Initial protocol for sgRNA recovery
This protocol for episome recovery was used in the following figures—Fig. 1d, M1 library screen in Fig. 3; the hSyn1-Cre screen in Fig. 5d, the hSyn1-Cre versus no Cre screens in Extended Data Fig. 6 and the screens in Extended Data Fig. 7. Each brain was placed in a PYREX 7 ml Dounce Homogenizer (Corning, 7722-7) with 2 ml of TRIzol (Invitrogen, 15596026) and thoroughly homogenized using the a pestle (0.0045 nominal clearance) for ten or more strokes. A volume of 0.4 ml chloroform was added, vigorously shaken for 30 s and centrifuged at 12,000g for 15 min at 4 °C. The aqueous phase (top) was collected and nucleic acids precipitated using 1 ml isopropanol, incubated on ice for 10 min and centrifuged at 12,000g for 10 min at 4 °C. The supernatant was discarded and the pellet was washed in 2 ml of 75% ethanol in DNase/RNase-free water and spun down at 7,500g for 5 min. The supernatant was then removed and the pellet was allowed to air dry for 10 min, and then resuspended in 100 µl of DNase/RNase-free water and incubated with 1 µl of RNase A (Thermo Fisher Scientific, EN0531) at 37 °C overnight. The sample was then column purified using Zymo DNA Clean and Concentrator-25 kit (Zymo Research, D4033) and eluted in 50 µl of DNase/RNase-free water to yield recovered viral DNA. The remaining RNAse-treated samples were considered recovered episomes for use in PCR, as described below.
Optimized protocol for sgRNA recovery
An optimized protocol for episomal sgRNA recovery was used in the following figures—the M3 library screen in Fig. 3, the CaMKII-Cre screens in Fig. 4, the hi56i-Cre screens in Fig. 5 and for the digital PCR experiments in Fig. 5. All steps in this protocol are the same as the above initial protocol except for two modifications. First, each brain was homogenized in 4 ml of TriZOL, phase separated using 0.4 ml chloroform and the aqueous phase precipitated with 2 ml isopropanol, before resuspending in 100 µl of DNase/RNase-free water. Second, following overnight RNase A treatment as above, the sample was directly transferred to −20 °C without column purification. The optimized protocol is available as a companion protocol in ref. 14.
PCR amplification of sgRNAs and sequencing
The PCR was performed using Q5 High-Fidelity 2× master mix (New England Biolabs, M0492L). Each reaction contained 100 µl of recovered episomes, 110 µl of Q5 2× master mix and 5.5 µl of each primer. For amplification of the AAV sgRNA libraries, the purified AAV was diluted tenfold into H2O, and 1 µl of the diluted AAV was used as a template in a 100 µl PCR reaction. The reaction was distributed into PCR tubes at the maximum volume allowed by the PCR equipment. The following PCR cycling conditions were used: 98 °C for 30 s; followed by 23 cycles of 98 °C for 30 s, 60 °C for 15 s and 72 °C for 15 s; with a final extension at 72 °C for 10 min.
Each 100 µl PCR reaction was purified using 1.1× SPRI beads (SPRIselect Beckman Coulter, B23317) and resuspended in 25 µl elution buffer (Machery Nagel, 740306). The purified products were pooled and sequenced on an Illumina HiSeq 4000 at the UCSF Center for Advanced Technologies or on an Illumina NextSeq 2000 and demultiplexed with Illumina Dragen BCL Convert. The amplification primers (with adapters) and custom sequencing primers (Integrated DNA Technologies) are listed in Supplementary Table 4. See Supplementary Information for details of digital PCR experiments.
Mouse cortical neuron primary cultures and immunocytochemistry
Neonates were briefly sanitized with 70% EtOH and decapitated using sharp scissors, and the brains were removed and placed into cold HBSS (Gibco, 14175095). The meninges were removed under a dissecting microscope, and the cortices were transferred to a 15-ml conical tube containing 10 ml of 0.25% trypsin–ethylenediaminetetraacetic acid (EDTA) (Gibco, 25200056) and incubated at 37 °C for 30 min. The trypsin was removed and the brains were gently rinsed twice in 5 ml of DMEM complete media, followed by trituration of brains in 5 ml of DMEM complete media filtered through a 40 µm nylon cell strainer (Corning, 352340), and diluted into DMEM complete media in a volume as needed for plating. An equivalent of one brain was plated across each BioCoat poly-d-lysine 24-well TC-treated plate (Corning, 356414). The following day, day in vitro 1 (DIV1), the DMEM complete media was replaced with neuronal growth media composed of Neurobasal-A Medium (Gibco, 10888022), 1× B-27 Supplement minus vitamin A (Gibco, 12587010), GlutaMAX Supplement (Gibco, 35050079) and 1% penicillin–streptomycin (Gibco, 15140122). On DIV2, the cultures were further supplemented with cytarabine (AraC) to a final concentration of 200 µM (Thermo Scientific Chemicals, 449561000). The primary neuronal cultures were transduced with AAV on DIV4 and imaged starting 4 days after transduction. See Supplementary Information for details on RNA isolation, qRT–PCR, live-cell imaging and quantification of cell death.
Mouse brain immunofluorescence staining
Whole brains were removed and fixed overnight at 4 °C in 4% paraformaldehyde (Electron Microscopy Sciences, 15710) diluted in 1× PBS. The following day, the fixative was replaced with 30% sucrose dissolved in 1× PBS for at least 48 h. Fixed brains were blotting dry, cut down the midline with a razor blade, and mounted into a cryomold (Epredia, 2219) using OCT compound (Sakura Finetek, 4583). To snap freeze, cryomolds were partially submerged in a pool of 2-propanol cooled by a bed of dry ice. Brains were sectioned in the sagittal plane at 40 µm on a cryostat (Leica, CM1950) with a 34° MX35 Premier+ blade (Epredia, 3052835). The resulting brain sections were stored free-floating in 1× PBS + 0.05% NaN3 at 4 °C. When ready for staining, representative brain sections were washed thrice in 1× PBS and incubated in a 24-well plate at room temperature for 1 h in blocking buffer—10% goat serum (Gibco, 16210064), 1% BSA (Sigma-Aldrich, A7906) and 0.3% Triton X-100 (Sigma-Aldrich, T8787) diluted in 1× PBS. The brain sections were incubated overnight in primary antibodies diluted in blocking buffer at 4 °C on a gentle shaker. The sections were washed three times in 1× PBS, then incubated in secondary antibodies for 2 h at room temperature in the dark on a gentle shaker. Sections were washed thrice in 1× PBS and moved to charged glass microscope slides (Thermo Fisher Scientific, 12-55015). After PBS was removed, Fluoromount-G with DAPI mountant (Invitrogen, 00-4959-52) was added, and a No. 1.5 coverslip (Globe Scientific, 1415-15) was placed on top. Slides were dried at room temperature in the dark overnight and sealed with nail polish. For experiments without DAPI, ProLong Gold Antifade mountant (Invitrogen, P10144) was used instead. For experiments with Hoechst instead of DAPI, sections were lastly incubated for 15 min in Hoechst 33342 (BD Pharmingen, 561908) diluted 2 µg ml−1 in 1× PBS, then washed thrice in 1× PBS before mounting using ProLong Gold mountant.
The following primary antibodies were used: rabbit anti-CREB (1:1,000 dilution; clone, 48H2; Cell Signaling Technologies, 9197), rabbit anti-SOX9 (1:2,000 dilution; polyclonal; EMD Millipore, AB5535), guinea pig anti-NeuN (1:500 dilution; polyclonal; Synaptic Systems, 266004), alpaca FluoTag-Q anti-TagFP nanobody (1:500 dilution; clone, 1H7; Alexa647 pre-conjugated; NanoTag Biotechnologies, N0501-AF647-L), which reacts to mTagBFP2 but not eGFP. The following secondary antibodies were used: goat antirabbit IgG Alexa Fluor 488 (1:1,000 dilution; Invitrogen, A-11034), goat antirabbit IgG Alexa Fluor 568 (1:1,000 dilution; Invitrogen, A-11011), goat antirabbit IgG Alexa Fluor 647 (1:1,000 dilution; Invitrogen, A-21245), goat antiguinea pig IgG Alexa Fluor 488 (1:1,000 dilution; Invitrogen, A-11073) and goat antiguinea pig IgG Alexa Fluor 647 (1:1,000 dilution; Invitrogen, A-21450). All secondary antibodies were highly cross-absorbed. See Supplementary Information for imaging parameters and quantification.
CRISPR screen analysis
Computational analysis of the screen data was performed using a newly developed bioinformatics pipeline, which is publicly available (Code availability). Raw sequencing results were mapped to the M1 protospacer library using ‘sgcount’36. Briefly, ‘sgcount’ is a tool to match protospacers against a reference protospacer library with exact pattern matching. The resulting count matrices, containing guide and gene information along with count data for each sample, were used as input for subsequent analyses.
The ‘crispr_screen’37 was used to perform differential sgRNA abundance analysis and gene score aggregation analysis. The ‘crispr_screen‘ is a reproduction of the original MAGeCK analysis, but performs differential sgRNA analysis using a negative binomial as originally described in the study, and not a truncated normal distribution as used in the current MAGeCK implementation.
In brief, sgRNA abundances are median normalized across samples, then a weighted linear regression (weighted ordinary least squares) is used to fit the log variance to the log mean of the control samples (representing sgRNA abundances in the AAV library). The fit variance and mean are then used to parameterize negative binomial distributions for each sgRNA and a survival function or cumulative distribution function is used to calculate a P value for sgRNA underabundance and overabundance. We excluded any sgRNAs that were represented with fewer than 100 reads across the control AAV samples.
To calculate a gene-level aggregated metric across sgRNAs of the same gene group, we established a new algorithm, geometric P value aggregation or geopagg. We performed the following operations on the underabundance and overabundance P values in parallel. First, the differential abundance P values for sgRNAs were corrected for multiple hypothesis correction using the Benjamini–Hochberg correction procedure to calculate an FDR for each sgRNA. Next, FDRs for sgRNAs belonging to the same gene grouping were collected and sorted in ascending order. We then calculated a weighted geometric mean FDR (\({q}_{i}\)) for each gene (\({i\in N}\)) across the FDRs (\({x}_{j}\)) for sgRNAs within the gene group (\({j\in M}\)).
$${q}_{i}\,={\mathrm{exp}}\left(\mathop{\sum }\limits_{j}^{{M}_{i}}\frac{{w}_{j}{\mathrm{ln}}{x}_{j}}{\mathop{\sum }\limits_{j}^{{M}_{j}}{w}_{j}}\right)$$
We calculated a weighted geometric mean to down-weight the relative impact of the first sgRNA within the group using a ‘Drop-First’ weighting strategy. The first sgRNA (or top-performing sgRNA) is down-weighted because we generally aim to capture genes with multiple high-performing sgRNAs. The weights for each gene grouping (\({M}_{i})\) are defined as follows:
$${w}_{j}\,=\,\left\{\begin{array}{c}0.5\;{\rm{if}}\;{x}_{j}={\text{min}}\left[{x}_{k}\,\forall \,k\in {M}_{i}\right]\\ 1.0\;{\text{if}}\;{x}_{j}\ne {\text{min}}\left[{x}_{k}\,\forall \,k\in {M}_{i}\right]\end{array}\right.$$
We also performed an aggregation of the log2-fold-changes in abundance (a gene’s phenotype score) of each sgRNA (\({\varphi }_{j}\)) within the gene group with an arithmetic mean:
$${\varphi }_{i}=\frac{1}{{M}_{i}}\left(\mathop{\sum }\limits_{j}^{{M}_{i}}{\varphi }_{j}\right)$$
We then created random groupings of sgNTC, which we denote as the amalgam gene set (\(A\)), to match the gene membership distribution of the input sgRNA library. This was performed by determining the membership size (number of sgRNAs) of each gene (\({M}_{j}\)) and sampling an equal amount of sgRNAs without replacement from the nontargeting controls. We next performed an identical calculation as above for each of the newly created amalgam genes.
We then calculated a ‘gene score’ for each gene and each amalgam gene within the dataset using the calculated weighted geometric mean of the FDR values \({q}_{i}\)) and their phenotype score (\({\varphi }_{i}\)).
$${{\rm{\gamma }}}_{i}=\left({\varphi }_{i}\right)\left(-{\log }_{10}{q}_{i}\right)$$
We next sort the gene scores (\({\gamma }_{i}\)) in an ascending order or a descending order for the underabundant and overabundant tests, respectively.
Finally, we calculated an empirical FDR (δi) by stepping through the weighted geometric mean (q) arrays and determining for each rank (i) how many amalgam genes (\({g}_{i}\in A\)) are preceding it. Because the true empirical FDR will be zero for all genes preceding the first amalgam gene, we provided a nonzero score by constraining the reported FDR to be the maximum of the empirical FDR and the weighted geometric mean of that gene.
$${\delta }_{i}\,={\mathrm{max}}\left(\frac{{c}_{i}}{i}\,|\,{q}_{i}\right)$$
$${c}_{i}\,=\,\mathop{\sum }\limits_{1}^{i}\left\{\begin{array}{c}1\;\text{if}{\;g}_{i}\in A\\ 0\;\text{if}{\;g}_{i}\notin A\end{array}\right.$$
This empirical false discovery is further constrained for explicit monotonicity by requiring the current score to be greater than or equal to the previous one.
$${\delta }_{i}\,={\mathrm{max}}\left({\delta }_{i}\,|\,{\delta }_{i-1}\right)\,\forall \,i\, > \,1$$
The geopagg algorithm is performed for the sgRNA underabundant and overabundant P values in parallel and the final scores for each gene are reported as the most significant of the two tests.
A total of 151 genes in the M1 library and 129 genes in the M3 library are targeted at two different transcriptional start sites by different sets of sgRNAs. These sets were evaluated independently, labeled as P1 and P2 (for example, GeneA_P1 and GeneA_P2). In cases where only one set is significant and labeled on a heatmap or volcano plot, the P1 or P2 label is not shown, but this information is included in Supplementary Tables 2 and 3.
Details on the bootstrapping analysis are provided in Supplementary Information.
Statistics and reproducibility
No statistical methods were used to predetermine sample sizes, but our sample sizes are similar to those reported in previous publications, as cited in Main. Numbers of replicates and number of mice used are stated in figures or figure legends (Figs. 2–5, 7 and 8 and Extended Data Figs. 4 and 7–9). In all figures that show a representative fluorescence micrograph (Figs. 1, 2, 4, 5 and 8 and Extended Data Figs. 2–5), the experiments were repeated at least once to verify similar findings. No repeat measurements were made on the same samples. Data were assumed to be normally distributed except for instances within the ‘crispr_screen’ pipeline where geopagg uses a negative binomial distribution to calculate P value. The ‘crispr_screen’ pipeline was used with FDR < 0.1 and controls for multiple comparisons using the Benjamini–Hochberg correction. For cell culture experiments, randomization was not performed because the treatment groups of cells were derived from the same parent population. Data collection and analysis were not performed in a blinded manner to the conditions of the experiments. No animals or data points were excluded from the relevant analyses. Major findings were validated using independent samples and orthogonal approaches.
Reporting summary
Further information on research design is available in the Nature Portfolio Reporting Summary linked to this article.