
Adapting prime editing for mammalian histone mutagenesis
Mouse canonical histone H3 is encoded by nine H3.1 and three H3.2 genes expressed in a replication-dependent manner. The noncanonical H3.3 variant is encoded by two genes (H3f3a and H3f3b) and is expressed throughout the cell cycle, being predominantly incorporated at actively transcribed and heterochromatic regions, including telomeres and pericentromeres13.
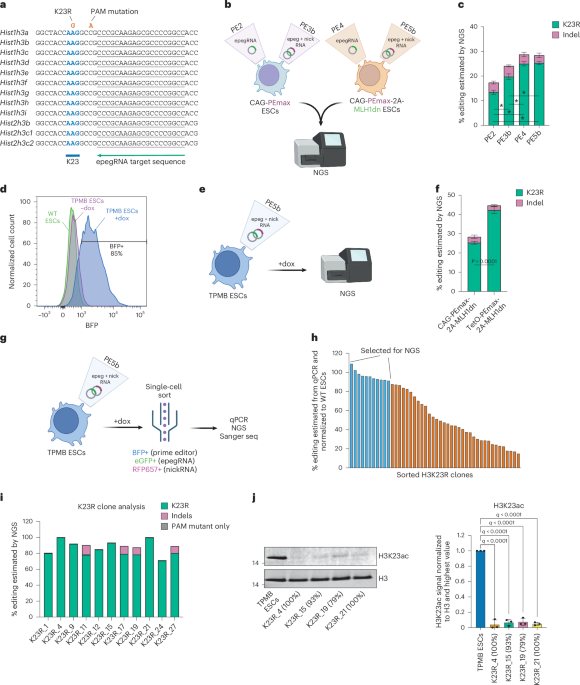
To establish prime editing for histone mutagenesis, we designed an enhanced pegRNA (epegRNA)14 targeting all 12 canonical mouse H3 genes to introduce a lysine-to-arginine (K-to-R) mutation at codon 23 (K23R) and a silent PAM-disrupting mutation (Fig. 1a). The epegRNA-expressing plasmid was transiently transfected into ESCs, which constitutively express the PEmax prime editor (PE2 system15). We additionally tested PE3b, which incorporates a nicking RNA12, PE4, which inhibits mismatch repair through expression of a dominant-negative MLH1 mutant (MLH1dn), and PE5b, which combines both strategies15 (Fig. 1b). Editing outcomes in the resulting cell pools were assessed by PCR across all 18 H3.1 alleles followed by amplicon-based next-generation sequencing (NGS). PE4 and PE5b, both of which inhibit mismatch repair, yielded the highest editing efficiencies and lowest indel frequencies (Fig. 1c). Although PE4 and PE5b performed similarly, we selected PE5b for subsequent experiments because previous studies reported modest improvements in efficiency and precision relative to PE4 (refs. 15,16).
Fig. 1: Adapting prime editing for mammalian histone mutagenesis.
a, Nucleotide sequence of Mus musculus histone H3.1/H3.2 genes surrounding lysine 23, with the H3K23R epegRNA spacer and desired mutations indicated. b, Schematic of the prime editing systems tested. Mutagenesis is calculated using amplicon-based NGS of 18 H3.1 alleles. c, Bar plot showing the percentage of reads containing the H3K23R mutation or indels in the tested prime editing systems. Data are presented as mean ± 1 s.d. of n = 3 biological replicates (that is, independent transfections), and statistical significance assessed by one-way ANOVA followed by Tukey’s multiple comparisons test. *q < 0.05. Only significant comparisons are highlighted. d, Flow cytometry histogram showing BFP expression in WT and TPMB ESCs before and after the addition of doxycycline. e, Schematic of testing our inducible prime editing cell line, TPMB, using the PE5b system. Mutagenesis is calculated using amplicon-based NGS of 18 H3.1 alleles. f, Bar plot showing the percentage of reads containing the H3K23R mutation or indels in the constitutive and doxycycline-inducible PE5b system. Data are presented as mean ±1 sd. of n = 3 biological replicates (that is, independent transfections), and statistical significance assessed by two-tailed unpaired t test (P < 0.05). Only significant comparisons are highlighted. g, Schematic of establishing clonal H3K23R cell lines. PE5b components are delivered to TPMB ESCs, single-cell clones are obtained by sorting triple BFP, eGFP and RFP657 cells, and are then screened using qPCR, Sanger sequencing and amplicon-based NGS. Schematics in b, e and g created in BioRender; Radzisheuskaya, A. https://BioRender.com/zvoto5r (2026). h, Bar plot showing the percentage of target mutagenesis across canonical H3.1 in H3K23R clones estimated by qPCR. Estimations are calculated by comparing the difference in Cq values between WT and H3K23R-specific primers (ΔCq) in H3K23R clones to ΔCq values generated using synthetic DNA fragments with defined WT-to-mutant ratios (Extended Data Fig. 1d). The clones highlighted in blue were taken for subsequent amplicon-based NGS analysis. i, Bar plot showing the percentage of reads containing the H3K23R mutation, indels or PAM-only mutations in 11 H3K23R clones preselected using qPCR. j, Western blot showing the change to H3K23ac signal in the selected H3K23R clones compared to parental TPMB cells. Total H3 is used as a loading control. Quantification is presented as mean ± 1 s.d. of n = 3 biological replicates (that is, independent blots from independent cell pellets). Statistical significance was assessed by one-way ANOVA followed by Dunnett’s multiple comparisons test (q < 0.05). ANOVA, analysis of variance; Cq, quantification cycle.
Because prolonged mismatch repair inhibition can promote genomic instability and mutational burden16, we generated a doxycycline-inducible TetO-PEmax-2A-MLH1dn-2A-BFP (TPMB) ESC line. TPMB ESCs demonstrated tight doxycycline-dependent control of prime editor expression (Fig. 1d) and superior editing efficiency using the PE5b system (Fig. 1e,f). Notably, TPMB ESCs maintained pluripotency and, upon embryoid body differentiation, expressed markers for all three germ layers (Extended Data Fig. 1a). TPMB ESCs also efficiently formed gastruloids, three-dimensional models of early gastrulation17 (Extended Data Fig. 1b,c), supporting their suitability for studying histone modifications.
To determine whether fully edited H3K23R clonal lines could be established, TPMB ESCs were transiently transfected with epegRNA-expressing and nickRNA-expressing plasmids carrying eGFP and RFP657 reporters, respectively. After doxycycline induction, triple BFP, eGFP and RFP657 positive cells were single-cell sorted (Fig. 1g). Clones were initially screened using a qPCR assay18, estimating the ratio of edited-to-wild-type (WT) H3 genes. This identified high editing efficiencies, with 35% clones exceeding 80% editing (Fig. 1h and Extended Data Fig. 1d). Notably, amplicon-based NGS identified two H3K23R clones fully mutated across the 18 H3.1 alleles (Fig. 1i). Complete editing of all H3.1 and H3.2 alleles in these clones was further confirmed by individual H3 gene genotyping (Extended Data Fig. 2a,b) and mass spectrometry (MS; Extended Data Fig. 2c), indicating that amplicon-based NGS of H3.1 loci accurately reflects editing across all histone H3 alleles. H3K23R clones showed near-complete loss of H3K23ac western blot signal (Fig. 1j), demonstrating that canonical H3K23 is dispensable for ESC self-renewal.
H3K14R and H3K18R mutations reduce cellular fitness
Next, we applied the optimized prime editing strategy to two additional canonical H3 lysines. H3K14 and H3K18 are highly acetylated residues predominantly modified by KAT7 (HBO1) and KAT3A/KAT3B (CBP/p300), respectively19,20. We designed a single epegRNA for each site, leveraging the >96% sequence similarity among canonical mouse H3 genes (Fig. 2a,b). The H3K14R spacer contained a 1-bp mismatch with Hist1h3a, whereas Hist1h3e and Hist1h3a carried noncanonical NAG PAMs for H3K14R and H3K18R epegRNAs, respectively (Fig. 2a,b), which can still be recognized by WT Cas9 (ref. 21).
Fig. 2: H3K14R and H3K18R mutations reduce cellular fitness.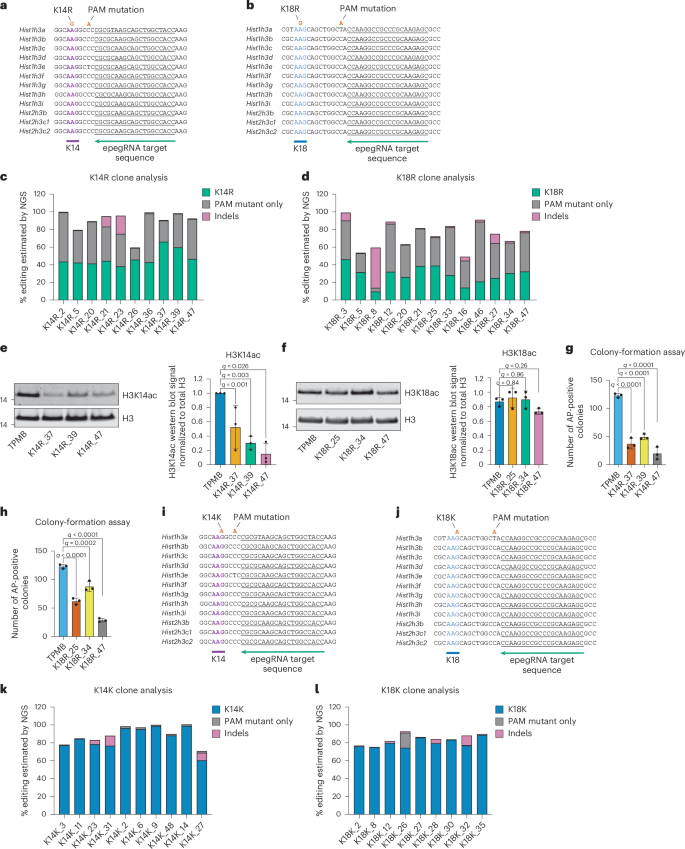
a,b, Nucleotide sequence of M. musculus histone H3.1/H3.2 genes surrounding lysine 14 (a) and lysine 18 (b), with the H3K14R or H3K18R epegRNA spacer and target mutations indicated. c,d, Bar plot showing the percentage of reads containing the H3K14R (c) or H3K18R (d) mutation, indels or PAM-only mutations in H3K14R or H3K18R clones preselected using qPCR. e,f, Western blot showing the change to H3K14ac signal in H3K14R clones (e) or H3K18ac signal in H3K18R clones (f) compared to parental TPMB cells. Total H3 is used as a loading control. Quantification is presented as mean ± 1 s.d. of n = 3 biological replicates (that is, independent blots from independent cell pellets). Statistical significance was assessed by one-way ANOVA followed by Dunnett’s multiple comparisons test (q < 0.05). g,h, The number of AP-positive colonies recovered after plating TPMB and H3K14R (g) or H3K18R (h) cells at clonal density. Quantification is presented as mean ± 1 s.d. of n = 3 biological replicates (that is, independently plated wells). Statistical significance was assessed by one-way ANOVA followed by Dunnett’s multiple comparisons test (q < 0.05). i,j, H3.1/H3.2 target of the H3K14K (i) or H3K18K (j) epegRNA spacer with the target mutations indicated. k,l, Bar plot showing the percentage of reads containing the H3K14K (k) or H3K18K (l) mutation, indels or PAM-only mutations in H3K14K or H3K18K clones preselected using qPCR. AP, alkaline phosphatase.
Notably, incorporation of the desired mutation at both residues was markedly less efficient than at H3K23, and no fully mutant clones were obtained (Fig. 2c,d). Mutagenesis of H3K14 was below 67% (~16/24 alleles; Fig. 2c), whereas H3K18R editing did not exceed 50% (Fig. 2d). These maximal editing efficiencies were consistently achieved after multiple (two to three) rounds of epegRNA/nickRNA transfection and qPCR prescreening of 47 clones per condition (Extended Data Fig. 3a). Additional transfections of partially edited H3K14R and H3K18R clones failed to increase editing efficiency further (Extended Data Fig. 3b,c). Partial editing of these sites was confirmed by MS (Extended Data Fig. 3d,e).
Notably, partially edited H3K14R and H3K18R clones showed a high frequency of alleles carrying only the PAM-disrupting mutation without the intended K-to-R substitution (Fig. 2c,d), indicating that reduced mutagenesis was unlikely due to low prime editing activity. Instead, these data suggest a biological constraint on the number of H3K14R and H3K18R alleles tolerated by ESCs, with continued mutagenesis leading to accumulation of incomplete editing products.
Individual genotyping of H3 genes in two partial H3K14R clones revealed no gene-specific editing bias (Extended Data Fig. 3f,g), including editing of Hist1h3e despite its NAG PAM and Hist1h3a despite the spacer mismatch. Using antibodies which we validated by sample normalization and antibody profiling chromatin immunoprecipitation (SNAP–ChIP)22 (Extended Data Fig. 3h,i), we found that partial H3K14 mutagenesis led to more than 50% decrease in H3K14ac western blot signal (Fig. 2e), whereas changes to H3K18ac signal were minor in H3K18R partial mutants (Fig. 2f), potentially reflecting compensation by remaining WT alleles. Partially edited H3K14R and H3K18R mutants exhibited impaired self-renewal capacity in colony-formation assays (Fig. 2g,h), which supports the negative impact of these mutations on cellular fitness.
To test whether the inability to generate fully mutant H3K14R and H3K18R cells reflected a biological constraint, we designed control epegRNAs introducing silent lysine-to-lysine (K-to-K) substitutions at codon 14 (Fig. 2i) or 18 (Fig. 2j) but otherwise identical to the corresponding K-to-R epegRNAs. In contrast to K-to-R editing, K-to-K mutagenesis produced predominantly highly edited clones, reaching 70–100% editing at H3K14 and 75–90% editing at H3K18, with few PAM-only alleles (Fig. 2k,l). Together, these findings suggest that H3K14R and H3K18R mutations confer a fitness defect, leading to outcompetition by less-edited ESCs.
Prime editing enables reversible and combinatorial histone mutation
We then tested whether introduced histone mutations could be reverted. We designed an epegRNA/nickRNA pair programmed to restore lysine at codon 23 in fully mutant H3K23R ESCs (Fig. 3a). Transient transfection produced efficient editing in bulk cell populations (Fig. 3b). Single-cell cloning yielded highly reverted lines (Fig. 3c) with restored H3K23ac western blot signal (Fig. 3d), demonstrating that prime editing enables reversible histone mutagenesis.
Fig. 3: Prime editing enables reversible and combinatorial histone mutation.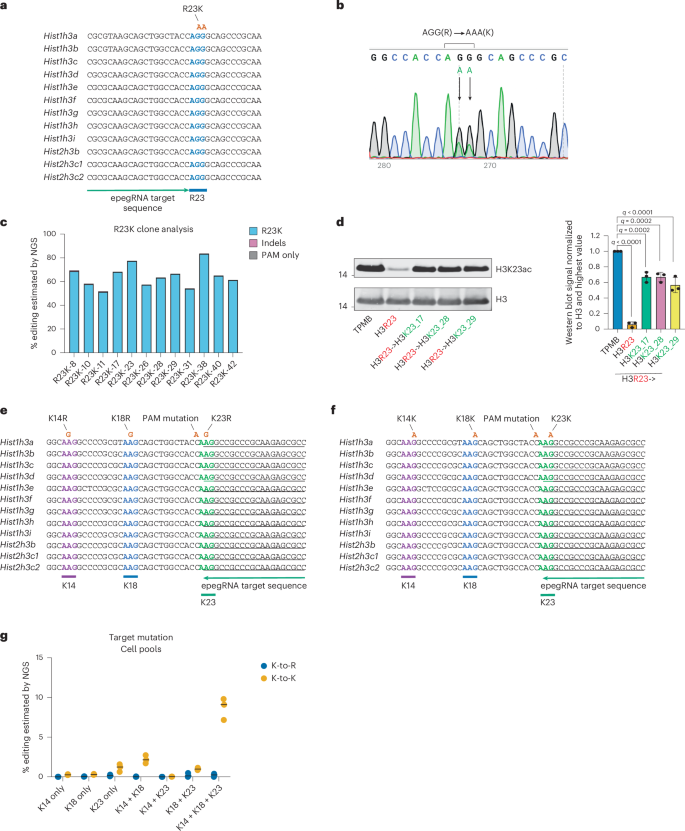
a, Nucleotide sequence of M. musculus histone H3.1/H3.2 genes surrounding installed arginine 23, with the H3R23K epegRNA spacer and target mutations indicated. PAM mutation in this strategy will be introduced by the target mutation. b, Sanger sequencing trace demonstrating the efficient emergence of AGG-to-AAA (R-to-K) mutation in the pool of transfected cells. c, Bar plot showing the percentage of reads containing the H3R23K mutation or indels in 12 H3R23K clones preselected using qPCR. d, Western blot showing H3K23ac levels in parental TPMB ESCs, fully mutant H3K23R clone and H3R23K reverted clones derived from it. Total H3 is used as a loading control. Quantification is presented as mean ± 1 s.d. of n = 3 biological replicates (that is, independent blots from independent cell pellets). Statistical significance was assessed by one-way ANOVA followed by Dunnett’s multiple comparisons test (q < 0.05). e, Nucleotide sequence of M. musculus histone H3.1/H3.2 genes surrounding lysine 14 to lysine 23, with the triple K-to-R epegRNA spacer and target mutations indicated. f, Nucleotide sequence of M. musculus histone H3.1/H3.2 genes surrounding lysine 14 to lysine 23, with the triple K-to-K epegRNA spacer and target mutations indicated. g, Scatterplot showing the percentage of reads containing single, double or triple K14, K18, K23 mutations in the pools of transfected cells (n = 3 biological replicates, that is, independent cell transfections).
Next, we asked whether the system supports combinatorial histone editing. To test this, we designed an epegRNA encoding simultaneous K-to-R or synonymous K-to-K mutations at H3K14, H3K18 and H3K23 across a 28-bp editing window containing four nucleotide substitutions (Fig. 3e,f). We found efficient installation of synonymous triple-K mutations, whereas triple K-to-R editing was markedly reduced (Fig. 3g), consistent with fitness defects associated with H3K14R and H3K18R mutations. Triple-K editing efficiencies were approximately fourfold to fivefold lower than those observed for single-residue mutagenesis.
Pan-H3 mutagenesis uncovers histone variant compensation
Although H3.3 is dispensable for ESC viability23, it may compensate for mutations in canonical H3.1/H3.2. We therefore tested whether H3.3 could be efficiently mutated using our system. Because sequence conservation between the two H3.3 genes is substantially lower than among canonical H3 genes, separate epegRNA/nickRNA pairs were required for each locus. Simultaneous transfection of both targeting pairs into fully mutant H3.1/H3.2K23R ESCs, followed by single-cell sorting and clonal analysis, generated pan-H3K23R mutants (Fig. 4a,b), which showed complete loss of residual H3K23ac western blot signal (Fig. 4c).
Fig. 4: Pan-H3 mutagenesis uncovers histone variant compensation.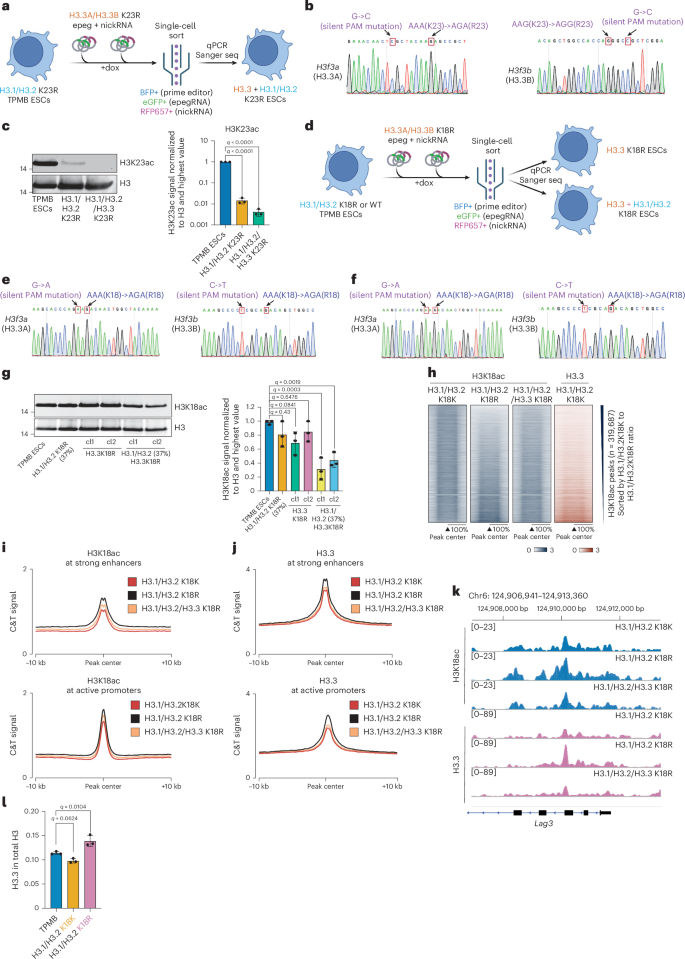
a, Schematic of establishing clonal H3.1/H3.2/H3.3K23R cell lines. H3.3A/H3.3B epegRNA/nickRNAs are delivered to H3.1/H3.2K23R ESCs, single-cell clones are obtained by sorting triple BFP, GFP and RFP657 cells and are then screened using qPCR and Sanger sequencing. b, Sanger sequencing traces demonstrating the complete K23R and PAM mutations at both H3f3a and H3f3b genes. c, Western blot showing the change to H3K23ac signal in H3.1/H3.2K23R and H3.1/H3.2/H3.3K23R clones compared to parental TPMB cells. Total H3 is used as a loading control. Quantification is presented as mean ± 1 s.d. of n = 3 biological replicates (that is, independent blots from independent cell pellets). Statistical significance was assessed by one-way ANOVA followed by Dunnett’s multiple comparisons test (q < 0.05). d, Schematic of establishing clonal H3.1/H3.2/H3.3K18R and H3.3K18R cell lines. H3.3A/H3.3B epegRNA/nickRNAs are delivered to partial H3.1/H3.2K18R or TPMB ESCs, single-cell clones are obtained by sorting triple BFP, GFP and RFP657 cells, and are then screened using qPCR and Sanger sequencing. Schematics in a and d created in BioRender; Radzisheuskaya, A. https://BioRender.com/zvoto5r (2026). e,f, Sanger sequencing traces demonstrating the complete K18R and PAM mutations at both H3f3a and H3f3b genes in TPMB (e) or partial H3.1/H3.2K18R (f) cells. g, Western blot showing the change to H3K18ac signal in H3.1/H3.2/H3.3K18R and H3.3K18R clones compared to parental TPMB cells. Total H3 is used as a loading control. Quantification is presented as mean ± 1 s.d. of n = 3 biological replicates (that is, independent blots from independent cell pellets). Statistical significance was assessed by one-way ANOVA followed by Dunnett’s multiple comparisons test (q < 0.05). h, Heatmaps of H3K18ac C&T signal in H3.1/H3.2K18K, H3.1/H3.2K18R and H3.1/H3.2/H3.3K18R cells and of H3.3 C&T signal in the control H3.1/H3.2K18K cells across all the H3K18ac peaks (the peaks are shown as length normalized). The experiment was performed in three biological replicates (that is, independent cell pellets). i, Average profiles of H3K18ac C&T signal across all strong enhancers (top) and active promoters (bottom) in H3.1/H3.2K18K, H3.1/H3.2K18R and H3.1/H3.2/H3.3K18R cells. The experiment was performed in three biological replicates (that is, independent cell pellets). j, Average profiles of H3.3 C&T signal across all strong enhancers (top) and active promoters (bottom) in H3.1/H3.2K18K, H3.1/H3.2K18R and H3.1/H3.2/H3.3K18R cells. The experiment was performed in three biological replicates (that is, independent cell pellets). k, H3K18ac and H3.3 C&T signals in H3.1/H3.2K18K, H3.1/H3.2K18R and H3.1/H3.2/H3.3K18R cells at a representative locus. l, MS-based quantification of H3.3-to-H3.1/H3.2 ratio in the chromatin of TPMB, H3.1/H3.2K18K and H3.1/H3.2K18R cells based on the intensity of the unmodified peptides 27–40, which differs between H3.1/H3.2 and H3.3 by the presence of S31 in H3.3. Quantification is presented as mean ± 1 s.d. of n = 3 biological replicates (that is, independent cell pellets). Statistical significance was assessed by one-way ANOVA followed by Dunnett’s multiple comparisons test (q < 0.05).
Because partially edited H3.1/H3.2K18R mutants retained near-normal H3K18ac levels (Fig. 2f), we hypothesized that H3.3 may compensate for the loss of canonical H3K18ac. To test this, we introduced H3.3K18R mutations into both WT and partially edited H3.1/H3.2K18R ESCs (Fig. 4d). Complete mutagenesis of H3f3a and H3f3b was achieved in both genetic backgrounds (Fig. 4e,f). Introduction of H3.3K18R into a partial H3.1/H3.2K18R mutant resulted in a reduction in H3K18ac levels (Fig. 4g), supporting partial compensation by H3.3 for the loss of canonical H3K18ac.
To further investigate this compensatory mechanism, we performed CUT&Tag (C&T) profiling of H3.3 and H3K18ac levels in WT (H3.1/H3.2K18K), H3.1/H3.2K18R and H3.1/H3.2/H3.3K18R ESCs. H3.1/H3.2K18R mutant exhibited marked redistribution of H3K18ac across the genome (Fig. 4h). Regions showing increased H3K18ac strongly correlated with H3.3 localization, whereas depletion of H3K18ac was largely confined to H3.3-poor regions. Introduction of H3.3K18R into partially edited H3.1/H3.2K18R cells abolished this redistribution and resulted in a genome-wide mild reduction in H3K18ac levels (Fig. 4h).
We then examined enhancer and promoter regions, which are typically enriched for H3.3 (refs. 24,25,26). At both classes of regulatory elements, increased H3K18ac in H3.1/H3.2K18R cells was accompanied by increased H3.3 incorporation, an effect that was lost upon introduction of the H3.3K18R mutation (Fig. 4i–k). Consistent with these findings, MS analysis revealed increased H3.3-to-H3.1/H3.2 ratios in H3.1/H3.2K18R cells relative to WT ESCs (Fig. 4l), providing independent evidence of histone variant compensation.
Genomic by-products of histone mutagenesis by prime editing
Because histone prime editing involves simultaneous targeting of multiple genomic loci, we assessed whether this approach induces large-scale (>1 kb) genomic alterations within histone clusters. Shallow whole-genome sequencing of several partial H3K18R and fully mutant H3K23R clones identified two classes of occasional lesions—megabase-scale loss of one copy of histone cluster 1 on chromosome 13 (Fig. 5a; clone H3K23R_30) and kilobase-scale deletions within histone clusters (Fig. 5b and Extended Data Fig. 4a; clone H3K18R_21). Previous studies have reported that large-scale deletions (>1 kb) represent common outcomes of CRISPR mutagenesis and can also occur after base or prime editing27. In prime editing, these events have been partly attributed to nickRNA, which can increase DNA double-strand breaks28.
Fig. 5: Genomic by-products of histone mutagenesis by prime editing.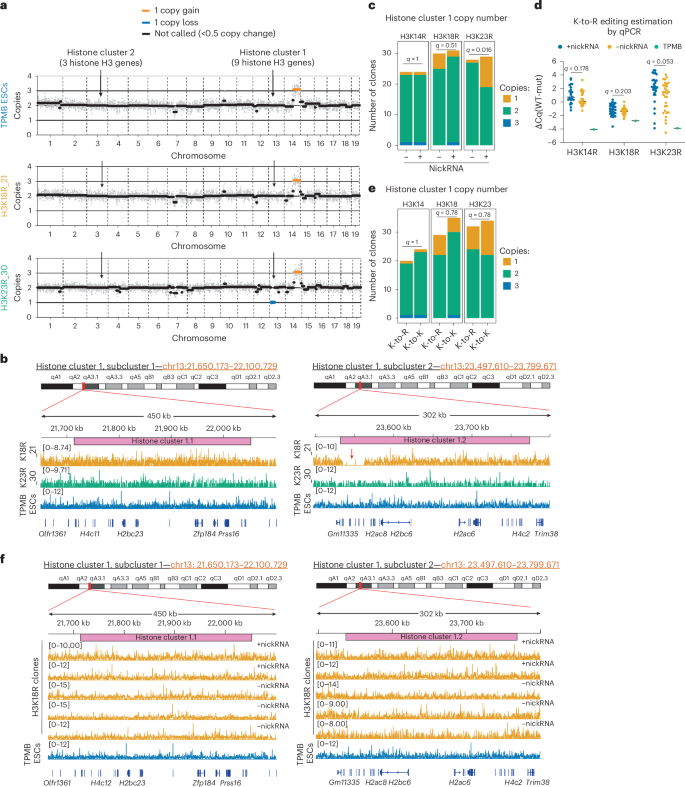
a, Chromosomal copy number plot showing large-scale amplifications or deletions in TPMB ESCs and two histone mutant clones—H3K18R_21 and H3K23R_30. Histone clusters are indicated in chromosomes 3 and 13, and called copy number changes are highlighted. Parental TPMB ESCs exhibited a partial duplication of chromosome 14, inherited by all the clones. This, however, does not compromise their pluripotency as shown in Extended Data Fig. 1. b, Shallow whole-genome sequencing profiles over histone cluster 1, subclusters 1 and 2 for TPMB ESCs, and H3K18R_21 and H3K23R_30 clones. A 25-kb deletion in the H3K18R_21 clone is highlighted with a red arrow. c, Histone cluster 1 copy number frequencies in H3K14R, H3K18R and H3K23R clones generated with or without nickRNA. qPCR-based copy number estimates were categorized as 1 (values < 1.5), 2 (values ≥ 1.5 and <2.5) or 3 (values ≥ 2.5) copies, and differences across groups were assessed using two-sided Fisher’s exact test followed by Benjamini–Hochberg multiple comparisons test (q < 0.05). More than 20 independent clonal cell lines were assessed for each condition. d, qPCR-based assessment of the H3K18R and H3K23R prime editing efficiency in the presence or absence of nickRNA. The statistical significance was assessed using two-tailed unpaired t tests with Benjamini–Krieger–Yekutieli correction for multiple comparisons (q < 0.05). More than 20 independent clonal cell lines were assessed for each condition. e, Histone cluster 1 copy number frequencies in H3K14K/H3K14R, H3K18K/H3K18R and H3K23K/H3K23R clones generated with nickRNA. qPCR-based copy number estimates were categorized as 1 (values < 1.5), 2 (values ≥ 1.5 and <2.5) or 3 (values ≥ 2.5) copies, and differences across groups were assessed using two-sided Fisher’s exact test followed by Benjamini–Hochberg multiple comparisons test (q < 0.05). More than 20 independent clonal cell lines were assessed for each condition. f, Shallow whole-genome sequencing profiles over histone cluster 1, subclusters 1 and 2 for TPMB ESCs, and five H3K18R clones generated with or without nickRNA.
To test whether omitting nickRNA reduces the frequency of large-scale deletions, we developed a qPCR assay to measure histone cluster 1 copy number and applied it to H3K14R, H3K18R and H3K23R mutants (n > 23). Depending on the condition, the frequency of histone cluster 1 copy number loss varied from 4% to 34%. The removal of nickRNA reduced copy number loss in H3K23R, but not in H3K14R or H3K18R mutants (Fig. 5c), indicating that the effect of nickRNA is locus dependent. Inclusion of nickRNA modestly increased editing efficiency at all three loci, although these effects were not statistically significant (Fig. 5d). Histone cluster 1 copy number loss did not strongly correlate with editing efficiency (Extended Data Fig. 4b,c) and occurred at similar frequencies in K-to-K and K-to-R mutagenesis reactions (Fig. 5e).
To assess the frequency of kilobase-scale deletions within histone clusters, we performed shallow whole-genome sequencing of five partially edited H3K18R and five fully mutant H3K23R clones with intact histone cluster 1 copy number by qPCR. For each genotype, two clones were generated with nickRNA and three without nickRNA. None of the ten clones showed histone cluster copy number loss (Extended Data Fig. 4d). No kilobase-scale deletions were detected in H3K18R clones (Fig. 5f and Extended Data Fig. 4e). In contrast, two H3K23R clones generated with nickRNA contained histone cluster 1 deletions ranging from 20 kb to 35 kb, with no lesions observed without nickRNA (Extended Data Fig. 4f,g).
Together, these findings show that histone prime editing can occasionally generate large-scale deletions in histone clusters. The addition of nickRNA increases the frequency of these events in a locus-specific manner. However, appropriate screening readily enables isolation of clones lacking these perturbations for downstream biological studies.
Prime editing screen maps H3 lysine contributions to fitness
Next, we aimed to systematically mutate each of the 13 lysine residues across canonical H3 to assess their contribution to cellular fitness (Fig. 6a). A single epegRNA was sufficient for 11 lysine residues, whereas H3K9 required two and H3K4 required five because of sequence divergence among H3 alleles. To distinguish biological effects from editing-associated biases, reciprocal K-to-K control epegRNAs were generated for all residues. TPMB ESCs were transfected with K-to-R or K-to-K epegRNAs in biological triplicates and edited for 11 days. Transfected cell pools were analyzed by amplicon-based NGS and single-cell sorted to establish clonal lines. For each lysine, 47 independent clones were prescreened by qPCR, after which the 12 most highly edited clones underwent amplicon-based NGS (Fig. 6b). Fitness effects were inferred from differences in editing efficiency and accumulation of PAM-only mutations between K-to-R and K-to-K conditions.
Fig. 6: Prime editing screen maps H3 lysine contributions to fitness.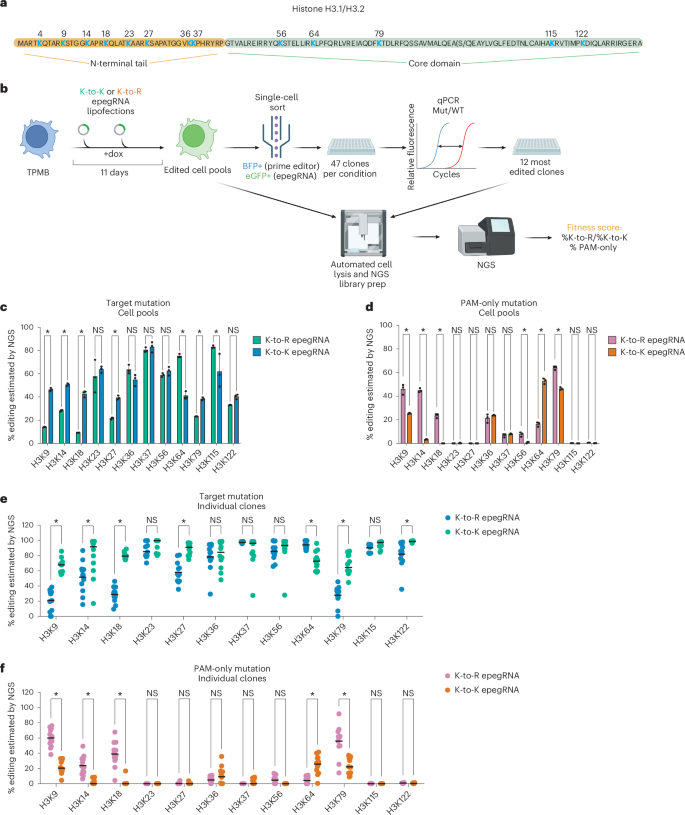
a, Histone H3.1/H3.2 amino acid sequence. b, Schematic of the H3 lysine mutagenesis screen. TPMB ESCs are transfected with either K-to-R or silent K-to-K epegRNAs targeting individual H3 lysine residues. After transfection, cell pools were single-cell sorted to establish clonal lines. The clones were prescreened by qPCR and further analyzed by amplicon-based NGS. Editing outcomes from the transfected cell pools and clonal populations were compared to evaluate the impact of specific lysine mutations on cell fitness. Schematic in b created in BioRender; Radzisheuskaya, A. https://BioRender.com/zvoto5r (2026). c,d, Bar plots showing the percentage of reads containing the target (K-to-R or K-to-K; c) or PAM-only mutation (d) across 12 histone H3 lysines in the transfected cell pools. Quantification is presented as mean ± 1 s.d. of n = 3 biological replicates (that is, independent cell transfections). The statistical significance was assessed using two-tailed unpaired t tests with Benjamini–Krieger–Yekutieli correction for multiple comparisons. *q < 0.01. e,f, Scatterplots showing the percentage of reads containing the target (K-to-R or K-to-K; e) or PAM-only mutation (f) across 12 histone H3 lysines in the individual clonal cell lines. The statistical significance was assessed using two-tailed unpaired t tests with Benjamini–Krieger–Yekutieli correction for multiple comparisons. *q < 0.01. NS, nonsignificant.
H3K23R editing showed no reduction in editing efficiency or accumulation of PAM-only mutations relative to K-to-K controls in either pooled or clonal analysis (Fig. 6c–f), with multiple fully edited H3K23R clones recovered. In contrast, H3K14R and H3K18R mutations showed markedly reduced editing efficiency and pronounced accumulation of PAM-only alleles (Fig. 6c–f), consistent with strong negative selection against highly edited cells. Similar phenotypes were observed for H3K9R and H3K79R, which reached maximal editing efficiencies of 39% and 46%, respectively, and showed substantial PAM-only enrichment. H3K27R showed a mildly reduced editing efficiency with no accumulation of PAM-only mutations (Fig. 6c,d), suggesting a modest proliferative defect without strong negative selection, consistent with the previous generation of pan-H3K27R ESCs11. H3K36R, H3K37R, H3K56R, H3K64R, H3K115R and H3K122R yielded predominantly highly or fully edited clones. H3K64R exhibited a modest gain-of-fitness phenotype, with increased editing efficiencies relative to K-to-K controls in both pooled and clonal analysis. Indel frequencies remained low across all sites (Extended Data Fig. 5a,b) and did not correlate with editing efficiency (Extended Data Fig. 5c,d).
PAM-only mutation frequencies in K-to-K conditions varied across lysine sites. To investigate this locus-specific variation, we analyzed epegRNA extension length, PBS length, reverse transcription template (RTT) length, PBS GC content, PBS melting temperature, predicted on-target score, PAM codon identity and usage frequency, PAM position in the RTT and target edit position in the RTT. Only PBS melting temperature showed a moderate-to-strong correlation with PAM-only frequency (Extended Data Fig. 5e). Higher PBS melting temperature may increase the frequency of reverse transcription initiation, which, particularly under conditions of mismatch repair inhibition, could increase the generation of incomplete or abortive prime editing products. PegRNA folding, local sequence or chromatin context may additionally contribute.
H3K4 mutagenesis required a multiplex editing strategy using five epegRNAs to account for sequence divergence among H3 alleles (Extended Data Fig. 5f,g). Unlike other lysine residues, synonymous K-to-K editing at H3K4 was inefficient, reaching only ~8% editing in cell pools and up to 33% in clonal lines (Extended Data Fig. 5h,i). K-to-R editing was dramatically reduced and associated with increased accumulation of PAM-only mutations in both pooled and clonal analyses (Extended Data Fig. 5j,k).
Because each H3K4 epegRNA perfectly matches only a subset of H3 alleles, the low editing efficiency and high frequency of incomplete editing products (Extended Data Fig. 5j,k) may result from nonproductive target engagement or inefficient PBS annealing at noncognate H3 loci. To improve H3K4 editing, we removed the PAM-disrupting mutation and extended the editing window either through repeated transfections (13 rounds) or through long-term lentiviral epegRNA expression (6 weeks; Extended Data Fig. 5l,m). These modifications improved K-to-K editing efficiency, with repeated transfection increasing median editing from 13.9% to 31% and maximum editing from 33% to 51% (Extended Data Fig. 5m). In contrast, K-to-R editing remained extremely rare, with only 2 of 36 clones reaching 11–12% editing (Extended Data Fig. 5j,m), showing no detectable changes in H3K4me1 and a modest reduction in H3K4me3 in the more edited clone (Extended Data Fig. 5n). These findings indicate strong negative selection against H3K4R cells.
Histone mutagenesis induces loss of PTMs and functional effects
We then confirmed loss of histone PTMs in highly and fully edited clones. H3K27R clones showed loss of H3K27me2 and H3K27me3, with no change in H3K27ac signal (Fig. 7a), consistent with H3K27ac localization at both canonical and noncanonical H3 (refs. 11,29). H3K36R clones showed loss of H3K36me2 and H3K36me3 (Fig. 7b), while H3K37R clones displayed loss of H3K37me1 (Fig. 7c). Partially edited H3K9R clones (30–35%) showed no reduction in H3K9me1 or H3K9me3, and a modest decrease in H3K9me2 (Extended Data Fig. 6a). Partially edited H3K79R clones (39–45%) demonstrated reduced H3K79me2 and H3K79me3 levels (Fig. 7d). We could not reliably assess H3K56ac, H3K64ac, H3K115ac or H3K122ac because suitable antibodies could not be identified, a problem previously reported for H3K56ac30,31.
Fig. 7: Histone mutagenesis induces loss of PTMs and functional effects.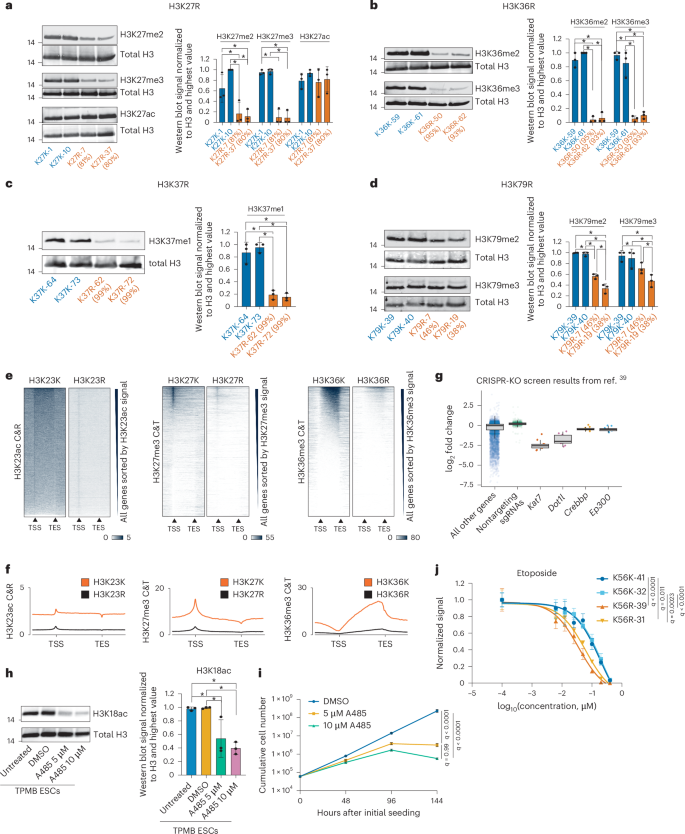
a, Western blot analysis of H3K27me2, H3K27me3 and H3K27ac levels in two H3K27K and two H3K27R clones. K-to-R editing efficiency estimated by NGS is shown in brackets. H3 levels are used as a loading control. Quantification is presented as mean ± 1 s.d. of n = 3 biological replicates (that is, independent blots from independent cell pellets). Statistical significance was assessed by two-way ANOVA followed by Tukey’s multiple comparisons test. *q < 0.05. Only significant comparisons are highlighted. b, Western blot analysis of H3K36me2 and H3K36me3 levels in two H3K36K and two H3K36R clones. K-to-R editing efficiency estimated by NGS is shown in brackets. H3 levels are used as a loading control. Quantification is presented as mean ± 1 s.d. of n = 3 biological replicates (that is, independent blots from independent cell pellets). Statistical significance was assessed by two-way ANOVA followed by Tukey’s multiple comparisons test. *q < 0.05. Only significant comparisons are highlighted. c, Western blot analysis of H3K37me1 levels in two H3K37K and two H3K37R clones. K-to-R editing efficiency estimated by NGS is shown in brackets. H3 levels are used as a loading control. Quantification is presented as mean ± 1 s.d. of n = 3 biological replicates (that is, independent blots from independent cell pellets). Statistical significance was assessed by one-way ANOVA followed by Tukey’s multiple comparisons test. *q < 0.05. Only significant comparisons are highlighted. d, Western blot analysis of H3K79me2 and H3K79me3 levels in two H3K79K and two H3K79R clones. K-to-R editing efficiency estimated by NGS is shown in brackets. H3 levels are used as a loading control. Quantification is presented as mean ± 1 s.d. of n = 3 biological replicates (that is, independent blots from independent cell pellets). Statistical significance was assessed by two-way ANOVA followed by Tukey’s multiple comparisons test. *q < 0.05. Only significant comparisons are highlighted. e, Heatmaps of C&R (H3K23ac) and C&T (H3K27me3 and H3K36me3) signals in H3K23K/H3K23R, H3K27K/H3K27R and H3K36K/H3K36R mutant cells, respectively. C&R data were normalized using Drosophila genome spike-in; C&T data were normalized using Escherichia coli genome spike-in. The experiment was performed in two biological replicates (that is, independent cell pellets). f, Average profiles of C&R (H3K23ac) and C&T (H3K27me3 and H3K36me3) signals in H3K23K/H3K23R, H3K27K/H3K27R and H3K36K/H3K36R mutant cells, respectively. C&R data were normalized using Drosophila genome spike-in; C&T data were normalized using E. coli genome spike-in. The experiment was performed in two biological replicates (that is, independent cell pellets). g, Box plot representing analysis of the CRISPR-KO screen results from ref. 39. log2 fold change is calculated as the difference in sgRNA abundance between day 0 and day 11 in the screen. Values for individual sgRNAs are shown as individual data points. Box plots show the median (horizontal line), interquartile range (box) and whiskers extending to 1.5× interquartile range. n = 2 biological replicates (that is, independently transduced cells). h, Western blot analysis of H3K18ac levels in TPMB cells treated with DMSO or A485 at 5 or 10 µM for 48 h. H3 levels are used as a loading control. Quantification is presented as mean ± 1 s.d. of n = 3 biological replicates (that is, independent blots from independent cell pellets). Statistical significance was assessed by one-way ANOVA followed by Tukey’s multiple comparisons test. *q < 0.05. Only significant comparisons are highlighted. i, Growth curve for TPMB cells treated with DMSO or A485 at 5 or 10 µM. Quantification is presented as mean ± 1 s.d. of n = 3 biological replicates (that is, independently seeded cells). Statistical significance was assessed by one-way ANOVA followed by Tukey’s multiple comparisons test (q < 0.05). j, Etoposide drug response curve for two H3K56K and two H3K56R clones. Quantification is presented as mean ± 1 s.d. of n = 3 biological replicates (that is, independently seeded cells). Differences in drug sensitivity across cell lines were assessed using one-way ANOVA with Sidak’s multiple comparisons correction (q < 0.05). Only significant comparisons are highlighted. TSS, transcription start site; TES, transcription end site.
To assess genome-wide changes in histone modifications, we profiled H3K23ac, H3K27me3 and H3K36me3 in H3K23R, H3K27R and H3K36R mutants, respectively, using C&T or CUT&RUN (C&R). This confirmed global loss of the corresponding modifications in K-to-R mutants (Fig. 7e,f).
To confirm incorporation of mutant histones into chromatin, we performed histone acid extraction followed by MS32,33. Because free histones constitute <1% total histone pool in rapidly dividing cells34, this approach predominantly recovers chromatin-associated histones. Propionylation-based sample preparation blocks tryptic cleavage at lysines, restricting digestion to arginine residues32,33. K-to-R mutations, therefore, generate mutant-specific peptides, which were detected in all analyzed samples, confirming chromatin incorporation of mutant histones (Extended Data Fig. 6b).
Our screen identified H3K4, H3K9, H3K14, H3K18 and H3K79 as important for ESC fitness (Fig. 6). The H3K4R phenotype is consistent with ESC death after depletion of H3K4 methyltransferase complex components DPY30 and RBBP5 (ref. 35). Likewise, H3K9R phenotype aligns with the established role of H3K9 methylation in heterochromatin formation and the lethality observed after deletion of all six H3K9 methyltransferases36. H3K14 is primarily acetylated by KAT7 (ref. 19), while H3K79 undergoes dimethylation and trimethylation by DOT1L37,38. Consistent with the effects of H3K14R and H3K79R mutagenesis, single-guide RNAs (sgRNAs) targeting Kat7 and Dot1l show strong depletion in the CRISPR-KO screen in ESCs39 (Fig. 7g). Although Kat7 (ref. 40) and Dot1l41 KO ESCs can be derived, both exhibit markedly impaired proliferation. H3K18 is primarily acetylated by CBP and p300 (ref. 20). While individual Cbp or Ep300 KOs are well-tolerated in ESCs (Fig. 7g), double-knockout ESCs have not been reported. To investigate whether loss of CBP/p300 catalytic activity affects ESC proliferation, we treated cells with CBP/p300 inhibitor A485 (ref. 42). This caused a marked reduction in H3K18ac levels (Fig. 7h) and cell death (Fig. 7i). Although CBP and p300 have multiple substrates20, our data support an important role for H3K18ac in mediating CBP/p300 function.
H3K56ac has been implicated in chromatin restoration following DNA replication and repair in yeast43, where H3K56R mutants exhibit heightened sensitivity to DNA damage44,45,46. Similarly, H3K56R causes developmental defects9,47 and genotoxic sensitivity in Drosophila9. To test whether this function is conserved in mammals, we treated fully edited H3K56R cells with etoposide. H3K56R mutants showed significantly increased etoposide sensitivity relative to H3K56K controls (Fig. 7j), demonstrating a conserved role for H3K56 in the regulation of genome stability.
Because histone mutations can act as oncogenic drivers48,49,50, we compared residues identified in our screen with cancer-associated histone mutations. A recent analysis of ~12,000 adult tumor samples51 identified driver mutations at H3K4, H3K14, H3K18, H3K27, H3K36 and H3K64 (Extended Data Fig. 6c). The frequency and driver status of these mutations did not correlate with fitness phenotypes observed in our screen. Notably, the oncogenic status of the acetyl-mimic H3K18Q mutation further supports the functional importance of H3K18ac.
Combinatorial H3 lysine mutations reveal functional crosstalk
To investigate functional interactions across lysine residues, we sequentially introduced double-mutant combinations involving H3K23R, H3K27R, H3K36R and H3K37R using highly edited single mutants as starting populations. Highly edited double-mutant clones were obtained for all attempted combinations (Fig. 8a) and showed loss of the corresponding histone modifications (Fig. 8b–d and Extended Data Fig. 7a,b). Editing efficiency during the second round of mutagenesis did not significantly differ between K-to-K and K-to-R conditions (Fig. 8a). For the H3K27R + H3K36R combination, comparable editing efficiencies were obtained irrespective of editing order. Notably, double H3K27R + H3K36R and H3K27R + H3K37R mutants showed reduced colony-forming capacity relative to the corresponding single mutants, indicating impaired stem cell self-renewal (Fig. 8e).
Fig. 8: Combinatorial H3 lysine mutations reveal functional crosstalk.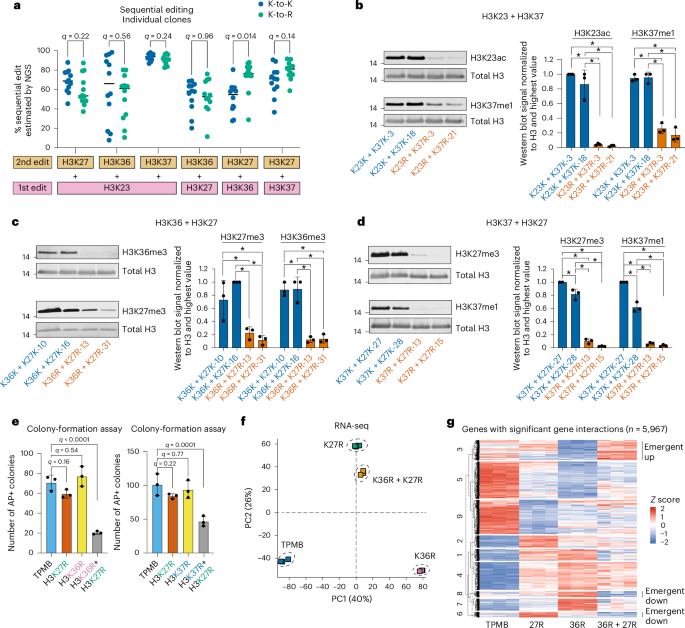
a, Scatterplots showing the percentage of reads containing the target (K-to-R or K-to-K) mutation in individual clonal cell lines across six sequential mutagenesis experiments. The genotypes of the starting cell lines are indicated in pink boxes, and the second edits introduced are indicated in brown boxes. The statistical significance was assessed using two-tailed unpaired t tests with Benjamini–Krieger–Yekutieli correction for multiple comparisons (q = 0.01). b, Western blot analysis of H3K23ac and H3K37me1 levels in two K23K + K37K and two K23R + K37R clones. H3 levels are used as a loading control. Quantification is presented as mean ± 1 s.d. of n = 3 biological replicates (that is, independent blots from independent cell pellets). Statistical significance was assessed by two-way ANOVA followed by Tukey’s multiple comparisons test. *q < 0.05. Only significant comparisons are highlighted. c, Western blot analysis of H3K27me3 and H3K36me3 levels in two K36K + K27K and two K36R + K27R clones. H3 levels are used as a loading control. Quantification is presented as mean ± 1 s.d. of n = 3 biological replicates (that is, independent blots from independent cell pellets). Statistical significance was assessed by two-way ANOVA followed by Tukey’s multiple comparisons test. *q < 0.05. Only significant comparisons are highlighted. d, Western blot analysis of H3K27me3 and H3K37me1 levels in two K37K + K27K and two K37R + K27R clones. H3 levels are used as a loading control. Quantification is presented as mean ± 1 s.d. of n = 3 biological replicates (that is, independent blots from independent cell pellets). Statistical significance was assessed by two-way ANOVA followed by Tukey’s multiple comparisons test. *q < 0.05. Only significant comparisons are highlighted. e, The number of AP-positive colonies recovered after plating WT (TPMB), single (H3K27R, H3K36R, H3K37R) or double (H3K36R + K3K27R, H3K37R + H3K27R) mutant cells. Quantification is presented as mean ± 1 s.d. of n = 3 biological replicates (that is, independently plated wells). Statistical significance was assessed by one-way ANOVA followed by Dunnett’s multiple comparisons test (q < 0.05). f, PCA of the RNA-seq samples, with samples colored by genotype. g, Heatmap of statistically significant gene interactions (q < 0.01) identified using DESeq2 with a factorial design to model genetic interactions between the two mutations (5,967 genes). Gene expression values were z scored and clustered using k-means clustering (k = 9). Gene clusters showing distinct expression patterns in the double mutant compared to single mutants and WT are indicated as emergent (clusters 3, 6 and 8). PCA, principal component analysis.
To further characterize the H3K27R + H3K36R phenotype, we performed RNA sequencing (RNA-seq) of WT, single-mutant and double-mutant cells (Fig. 8f). Differential expression analysis using a factorial DESeq2 (ref. 52) design was used to model genetic interactions between the two mutations (Fig. 8g). Among genes with significant interaction effects, most showed epistatic responses, with the double mutant resembling either the H3K27R (clusters 4, 5 and 7) or the H3K36R (clusters 2 and 9) single-mutant state. Smaller subsets showed buffering (cluster 1) or emergent (clusters 3, 6 and 8) transcriptional responses. Genes within the emergent groups were enriched for pathways linked to differentiation, proliferation and transcriptional regulation (Extended Data Fig. 7c), including downregulation of pluripotency-supporting factors Klf4 (refs. 53,54), Chd4 (ref. 55) and Sin3a56, and upregulation of differentiation drivers Fgfr2 (ref. 57) and Dkk58, consistent with reduced stem self-renewal capacity of the double-mutant cells. Together, these findings demonstrate functional crosstalk between H3K27 and H3K36 modifications.
Next, we tested whether combinatorial H3K23R, H3K27R, H3K36R and H3K37R mutants could be generated using single epegRNAs encoding multiple substitutions (double and quadruple configurations; Extended Data Fig. 7d). Editing efficiency showed a strong inverse relationship with editing window size (Extended Data Fig. 7e–h). The shortest-range configuration (H3K36R + H3K37R) yielded the highest editing efficiency (up to 46%), whereas longer-range configurations produced predominantly partial or singly edited clones. Together, these findings demonstrate that simultaneous multisite histone mutagenesis with single epegRNAs is feasible but substantially less efficient than sequential editing.